
|
시장보고서
상품코드
2124589
통신 과금 수익 관리 : 시장 점유율 분석, 업계 동향 및 통계, 성장 예측(2026-2031년)Telecom Billing Revenue Management - Market Share Analysis, Industry Trends & Statistics, Growth Forecasts (2026 - 2031) |
||||||
 Mordor Intelligence
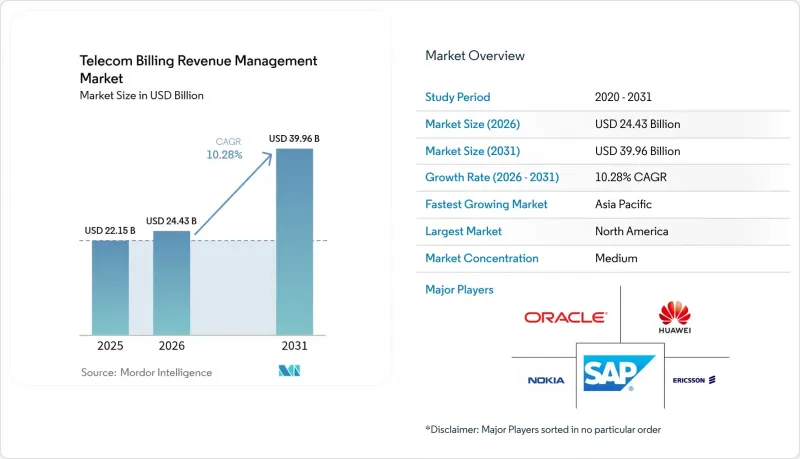
Mordor Intelligence에 의하면, 2026년 통신 과금 수익 관리 시장 규모는 244억 3,000만 달러로 추정되고 2025년 221억 5,000만 달러에서 확대해, 2031년에는 399억 6,000만 달러에 이를 것으로 예측됩니다.
2026년부터 2031년까지의 연평균 성장률(CAGR)은 10.28%를 나타낼 전망입니다.
본 보고서는 배포 방식(On-Premise 및 클라우드/SaaS), 유형(소프트웨어 및 서비스), 사업자(이동통신 사업자, 인터넷 서비스 제공업체, MVNO/MVNE), 그리고 지역별로 분류되어 있습니다.
세계의 통신 과금 수익 관리 시장 동향 및 인사이트
휴대전화·모바일 가입자 증가
특히 신흥 시장에서 모바일 가입자의 급격한 증가는 기존의 음성 및 SMS 모델을 뛰어넘는 과금 시스템의 요구 사항을 근본적으로 변화시키고 있습니다. 아시아태평양의 모바일 가입자 수는 2024년에 18억 명에 달했으며, 2030년까지 5G 연결 수가 대폭 증가할 것으로 전망됩니다. 이로 인해 2G와 5G가 혼재된 고객 포트폴리오를 관리하는 통신 사업자에게는 전례 없이 복잡한 과금 처리가 발생하게 될 것입니다. 이러한 가입자의 급증은 특히 통신 사업자가 사용량에 따른 세밀한 과금이 필요한 IoT 서비스를 출시함에 따라, 초당 수백만 건의 마이크로 트랜잭션을 처리할 수 있는 실시간 과금 시스템에 대한 수요를 이끌고 있습니다. 예를 들어, 인도에서 사기 방지 대책을 도입한 결과, 사칭 통화가 90% 감소한 사례는 가입자 증가에 따라 고도의 수익 보장 기능이 필수적임을 보여줍니다. 이 과제는 처리량에 그치지 않고 서비스의 다양성에도 미칩니다. 한 명의 가입자가 모바일 브로드밴드, 엣지 컴퓨팅, 네트워크 API 서비스를 동시에 이용할 수 있으며, 각각에 다른 과금 로직이 필요합니다. 이러한 성장을 뒷받침하기 위해 필요한 과금 인프라에 대한 투자는 정기적인 배치 처리에서 지속적인 실시간 수익 관리로의 근본적인 전환을 의미합니다.
통신 생태계 전반에 걸친 수익 분배의 복잡화
수익 분배의 복잡성은 단순한 상호 접속 계약에서 클라우드 제공업체, 컨텐츠 파트너, API 개발자가 관여하는 복잡한 다자간 생태계로 진화해 왔습니다. AT&T, T-Mobile, Verizon이 협력하여 5G 기능을 표준화하는 Aduna와 같은 플랫폼을 통한 네트워크 API 수익화의 부상은 기존의 과금 시스템으로는 대응할 수 없는 새로운 수익 분배 모델을 만들어내고 있습니다. 이러한 파트너십에서는 여러 이해관계자에 걸친 실시간 수익 분배가 필요하며, 정산 주기는 몇 달 단위가 아닌 몇 분 단위로 측정되고 있습니다. 이러한 복잡성은 5G 네트워크 슬라이싱으로 인해 더욱 심화되고 있습니다. 기업 고객이 전용 네트워크 리소스를 구매할 경우, 여러 네트워크 도메인에 걸친 성능 보증이나 이용 패턴을 바탕으로 과금을 해야 합니다. 예를 들어, 에릭슨이 주요 통신 사업자와 제휴하여 세계 네트워크 API 플랫폼을 구축한 사례는 수익 분배가 기존 통신 업계의 틀을 넘어 SaaS(Software-as-a-Service) 모델로까지 확대되고 있음을 여실히 보여줍니다. 현재 과금 시스템은 서비스 성능, 이용 패턴, 그리고 여러 당사자 간의 계약 조건에 따라 실시간으로 조정되는 동적인 수익 분배 알고리즘을 지원해야 합니다.
엄격한 통신 규제의 존재
규제 준수에 드는 비용은 과금 시스템 투자에 큰 걸림돌이 되고 있습니다. 특히 통신 사업자가 여러 관할 구역에 걸친 상충되는 요건을 충족해야 하는 상황에서는 더욱 그렇습니다. 2027년까지 시행될 ‘EU AI법’에 따라, AI를 활용한 과금 시스템을 도입하는 통신 사업자에게는 막대한 규정 준수 부담이 부과되며, 위반 시 전 세계 연간 수익의 4%에 해당하는 벌금이 부과될 것입니다. 유럽의 통신 사업자들은 전자통신법(Electronic Communications Code)에 따른 통일 종단 요금 도입으로 인해 더욱 복잡해진 상황에 직면해 있으며, 2024년까지 분당 0.2유로의 휴대전화 통화 요금을 적용하기 위해 과금 시스템을 변경해야 합니다. 예를 들어, 인도의 ‘개인정보 보호법’은 과금 시스템의 아키텍처와 데이터 처리 능력에 직접적인 영향을 미치는 규정 준수 비용을 발생시켜, 통신 사업자로 하여금 추가적인 보안 계층과 감사 추적을 도입하도록 강요하고 있습니다. 이러한 규제는 업무 효율화 목표와 종종 상충되어, 통신 사업자로 하여금 규정 준수와 혁신 중 하나를 선택하도록 강요하고 있습니다. 그 결과, 통신 사업자는 수익 창출 능력 향상보다는 규정 준수에 자원을 할당하게 되어, 과금 시스템 현대화 예산이 압박받고 있습니다.
부문별 분석
2025년에도 On-Premise형 도입은 62.10%의 시장 점유율을 유지했으며, 이는 통신 사업자들이 여전히 미션 크리티컬한 과금 인프라를 직접 관리하는 것을 선호하고 있음을 반영합니다. 그러나 설비 투자 축소와 신규 서비스 시장 출시 기간 단축을 목표로 하는 통신 사업자들의 주도 하에, 클라우드 기반 도입은 2031년까지 연평균 성장률(CAGR) 13.12%로 성장을 지속하고 있습니다. 이러한 도입 형태의 분화는 통신 사업자들의 우선순위에 있어 근본적인 차이를 반영하고 있습니다. 즉, 기존 통신사는 보안과 규제 준수를 우선시하는 반면, 신생 사업자는 운영상의 민첩성과 비용 효율성에 중점을 두고 있습니다. 예를 들어, M1 싱가포르가 Amdocs의 클라우드 네이티브 과금 플랫폼을 도입한 사례는 신중하게 설계된 클라우드 솔루션을 통해 통신사가 확장성과 보안을 모두 실현할 수 있음을 보여줍니다.
각 벤더들이 보안상의 우려를 해소하면서도 클라우드의 이점을 제공하는 하이브리드 도입 모델을 제시함에 따라, 클라우드 전환 추세는 가속화되고 있습니다. 데이터센터 장비의 자재 비용 급등으로 인해 클라우드 도입의 매력은 더욱 커지고 있습니다. 통신 사업자는 자본 지출 주기를 피하면서도 최신 세대의 인프라를 활용할 수 있기 때문입니다. 도입 형태 선택은 규제 요건에 좌우되는 경향이 강해지고 있으며, 유럽의 통신 사업자는 데이터 주권에 대한 우려로 On-Premise형 솔루션을 선호하는 반면, 아시아의 통신 사업자는 급속한 시장 확대를 위해 클라우드 도입을 적극적으로 추진하고 있습니다. 클라우드 보안 기능이 성숙해지고 규제 체계가 클라우드 네이티브 아키텍처에 적응해 감에 따라, 이러한 구분은 하이브리드 모델로 수렴해 나갈 것으로 보입니다.
지역별 분석
북미는 2025년, 성숙한 인프라 투자와 과금 시스템 현대화를 뒷받침하는 규제 안정성에 힘입어 34.95%의 시장 점유율을 유지했습니다. 이 지역 시장 주도력은 통신 사업자들이 첨단 과금 기능에 투자하려는 의지를 반영한 것이며, 버라이즌이 프론티어 커뮤니케이션즈를 200억 달러 규모로 인수한 것은 과금 시스템 요구 사항을 주도하는 인프라 통합의 규모를 여실히 보여줍니다. 예를 들어, AT&T는 종합적인 디지털 전환을 시행하고 있으며, Oracle Cloud ERP 및 EPM을 도입하여 보다 정교한 수익 관리 기능을 구현하고 있습니다. 미국은 5G 네트워크 API 이니셔티브 및 사설 네트워크 도입을 통해 지역 성장을 주도하고 있는 반면, 캐나다와 멕시코는 광섬유 인프라 확장 및 규제 현대화 노력을 통해 기여하고 있습니다. 그러나 시장 포화로 인해 가입자 수 확대가 제한되고, 통신 사업자들이 용량 확대보다 기존 인프라 최적화에 주력하고 있어 성장은 둔화되고 있습니다.
아시아태평양은 청구 시스템 현대화를 가속화하는 적극적인 디지털화 노력과 규제 개혁에 힘입어, 2031년까지 연평균 성장률(CAGR)이 12.51%에 달하며 가장 빠르게 성장하는 지역으로 부상하고 있습니다. 중국의 3대 통신사인 차이나모바일, 차이나유니콤,차이나텔레콤은 2024년에 총 1조 6,000억 위안(2,400억 달러) 이상의 매출을 올렸으며, 클라우드 네이티브 과금 플랫폼과 AI를 활용한 수익 최적화 솔루션 ‘Sohu’에 막대한 투자를 하고 있습니다. 예를 들어, 차이나모바일의 지능형 운영 관리 시스템은 AI 주도형 과금 최적화 분야에서 이 지역의 선도적 위치를 입증하고 있습니다. 인도의 통신 부문은 이 지역의 변혁 가능성을 보여주고 있으며, 통신 사업자들은 5G 인프라 자금 조달을 목적으로 요금 인상을 단행하는 동시에, 첨단 부정 방지 시스템을 도입하고 있습니다. 일본은 고도화된 과금 기능이 필요한 기업용 5G 도입 및 네트워크 슬라이싱 혁신을 통해 기여하고 있습니다.
남미에서는 광섬유 인프라 확대와 규제 현대화에 힘입어 새로운 기회가 창출되고 있습니다. 브라질은 통신 사업자의 통합과 기술 업그레이드를 통해 지역 성장을 주도하고 있습니다. 예를 들어, 밀리콤(Millicom)의 2024년 매출은 58억 달러에 달했으며, 후불 요금제 가입자의 꾸준한 증가가 라틴아메리카의 여러 시장에서 과금 시스템 수요를 견인하고 있습니다. 유럽에서는 EU AI법 및 전자통신법에 따른 규제 준수 비용으로 인해 과금 시스템에 대한 투자 예산이 제한됨에 따라 성장 전망은 엇갈리고 있습니다. 그러나 이 지역에서는 첨단 5G 구축과 네트워크 API 이니셔티브가 새로운 수익 기회를 창출하고 있어 그 혜택을 누리고 있습니다. 중동 및 아프리카에서는 새로운 기회가 생겨나고 있으며, 오만텔(OmanTel)과 같은 통신 사업자들이 과금 인프라를 현대화하는 종합적인 디지털 전환을 완료하고 있습니다.
기타 혜택 :
- 엑셀 형식 시장 전망(ME) 시트
- 3개월간의 애널리스트 지원
자주 묻는 질문
목차
제1장 서론
제2장 조사 방법
제3장 주요 요약
제4장 시장 구도
제5장 시장 규모 및 성장 예측
제6장 경쟁 구도
제7장 시장 기회 및 향후 전망
KTH 26.09.14According to Mordor Intelligence, telecom billing revenue management market size in 2026 is estimated at USD 24.43 billion, growing from 2025 value of USD 22.15 billion with 2031 projections showing USD 39.96 billion, growing at 10.28% CAGR over 2026-2031.
This report is Segmented by Deployment (On-Premise and Cloud/SaaS), Type (Software and Service), Operator (Mobile Operator, Internet Service Provider, and MVNO/MVNE), and Geography.
Global Telecom Billing Revenue Management Market Trends and Insights
Growing Number of Cellular or Mobile Subscribers
The exponential growth in mobile subscribers, particularly in emerging markets, is fundamentally reshaping billing system requirements beyond traditional voice and SMS models. Asia Pacific's mobile subscriber base reached 1.8 billion in 2024, with 5G connections projected to grow significantly by 2030, creating unprecedented billing complexity for operators managing hybrid 2G-5G customer portfolios. This subscriber surge drives demand for real-time charging systems capable of processing millions of micro-transactions per second, particularly as operators launch IoT services requiring granular usage-based billing. For instance, India's implementation of anti-fraud measures that reduced spoofed calls by 90% demonstrates how subscriber growth necessitates sophisticated revenue assurance capabilities. The challenge extends beyond volume to service diversity, where a single subscriber might simultaneously consume mobile broadband, edge computing, and network API services, each requiring distinct billing logic. The billing infrastructure investment required to support this growth represents a fundamental shift from periodic batch processing to continuous real-time revenue management.
Growing Complexities in Revenue Sharing Across the Telecom Ecosystem
Revenue sharing complexity has evolved from simple interconnect agreements to intricate multi-party ecosystems involving cloud providers, content partners, and API developers. The emergence of network API monetization through platforms like Aduna, where AT&T, T-Mobile, and Verizon collaborate to standardize 5G capabilities, creates new revenue-sharing models that traditional billing systems cannot accommodate. These partnerships require real-time revenue allocation across multiple stakeholders, with settlement periods measured in minutes rather than months. The complexity deepens with 5G network slicing, where enterprise customers purchase dedicated network resources that must be billed based on performance guarantees and usage patterns across multiple network domains. For example, Ericsson's collaboration with major operators to create a global network API platform highlights how revenue sharing now extends beyond traditional telecom boundaries into software-as-a-service models. The billing systems must now support dynamic revenue allocation algorithms that adjust in real-time based on service performance, usage patterns, and contractual terms across multiple parties.
Presence of Stringent Telecom Regulations
Regulatory compliance costs are creating significant headwinds for billing system investments, particularly as operators navigate conflicting requirements across multiple jurisdictions. The EU AI Act's implementation through 2027 imposes substantial compliance burdens on telecom operators deploying AI-powered billing systems, with penalties reaching 4% of global annual revenue for non-compliance. European operators face additional complexity from the Electronic Communications Code's harmonized termination rates, requiring billing system modifications to accommodate EUR 0.2 per minute mobile call rates by 2024. For instance, India's Personal Data Law creates compliance costs that directly impact billing system architecture and data processing capabilities, forcing operators to implement additional security layers and audit trails. These regulations often conflict with operational efficiency goals, forcing operators to choose between compliance and innovation. The cumulative effect constrains billing system modernization budgets as operators allocate resources to regulatory compliance rather than revenue-generating capabilities.
Other drivers and restraints analyzed in the detailed report include:
- Cloud-native BSS transformations by Tier-1 CSPs
- Expansion of private 5G and campus networks
- Legacy OSS/BSS integration complexity
For complete list of drivers and restraints, kindly check the Table Of Contents.
Segment Analysis
On-premises deployments maintained 62.10% market share in 2025, reflecting operators' continued preference for direct control over mission-critical billing infrastructure. However, cloud deployments are experiencing 13.12% CAGR through 2031, driven by operators seeking to reduce capital expenditure and accelerate time-to-market for new services. The deployment divide reflects fundamental differences in operator priorities, where established carriers prioritize security and regulatory compliance while emerging operators focus on operational agility and cost efficiency. For instance, M1 Singapore's implementation of Amdocs' cloud-native charging platform demonstrates how operators can achieve both scalability and security through carefully architected cloud solutions.
The cloud migration trend is accelerating as vendors introduce hybrid deployment models that address security concerns while delivering cloud benefits. Material cost inflation in data center equipment has made cloud deployments increasingly attractive, as operators can avoid capital expenditure cycles while accessing the latest-generation infrastructure. The deployment choice increasingly depends on regulatory requirements, with European operators favoring on-premises solutions due to data sovereignty concerns, while Asian operators embrace cloud deployments for rapid market expansion. This segmentation will likely converge toward hybrid models as cloud security capabilities mature and regulatory frameworks adapt to cloud-native architectures.
Complete Report Scope:
- By Deployment
- On-premise
- Cloud/SaaS
- By Type
- Software
- Services
- By Operator
- Mobile Operator
- Internet Service Provider
- MVNO/MVNE
- By Geography
- North America
- United States
- Canada
- Mexico
- South America
- Brazil
- Argentina
- Rest of South America
- Europe
- Germany
- United Kingdom
- France
- Russia
- Rest of Europe
- Asia-Pacific
- China
- India
- Japan
- Rest of Asia-Pacific
- Middle East and Africa
- Middle East
- Saudi Arabia
- Turkey
- United Arab Emirates
- Rest of Middle East
- Africa
- South Africa
- Nigeria
- Rest of Africa
- Middle East
- North America
Geography Analysis
North America maintained 34.95% market share in 2025, driven by mature infrastructure investments and regulatory stability that encourage billing system modernization. The region's market leadership reflects operators' willingness to invest in advanced billing capabilities, with Verizon's USD 20 billion acquisition of Frontier Communications demonstrating the scale of infrastructure consolidation driving billing system requirements. For instance, AT&T has implemented comprehensive digital transformations, with Oracle Cloud ERP and EPM deployments enabling more sophisticated revenue management capabilities. The United States dominates regional growth through 5G network API initiatives and private network deployments, while Canada and Mexico contribute through fiber infrastructure expansion and regulatory modernization efforts. However, growth is moderating as market saturation limits subscriber expansion and operators focus on optimizing existing infrastructure rather than expanding capacity.
Asia Pacific emerges as the fastest-growing region with 12.51% CAGR through 2031, fueled by aggressive digitalization initiatives and regulatory reforms that accelerate billing system modernization. China's three major operators, China Mobile, China Unicom, and China Telecom, collectively generated over CNY 1.6 trillion (USD 240 billion) in revenue during 2024, with significant investments in cloud-native billing platforms and AI-powered revenue optimization Sohu. For instance, China Mobile's intelligent operations management system demonstrates the region's leadership in AI-driven billing optimization. India's telecom sector demonstrates the region's transformation potential, with operators implementing tariff increases to fund 5G infrastructure while deploying advanced fraud prevention systems. Japan contributes through enterprise 5G deployments and network slicing innovations that require sophisticated billing capabilities.
South America presents emerging opportunities driven by fiber infrastructure expansion and regulatory modernization, with Brazil leading regional growth through operator consolidation and technology upgrades. For example, Millicom's 2024 revenue reached USD 5.80 billion, with strong growth in postpaid subscribers driving billing system requirements across multiple Latin American markets. Europe faces mixed growth prospects due to regulatory compliance costs under the EU AI Act and Electronic Communications Code, constraining billing system investment budgets. However, the region benefits from advanced 5G deployments and network API initiatives that create new revenue opportunities. The Middle East and Africa present emerging opportunities, with operators like Omantel completing comprehensive digital transformations that modernize billing infrastructure.
- Amdocs
- Netcracker Technology
- CSG Systems International
- Oracle
- Ericsson
- Huawei
- Nokia
- SAP SE
- Comarch
- Optiva
- Enghouse Networks
- Sterlite Technologies
- Intracom Telecom
- Subex
- MIND CTI
- Openet (Amdocs Digital)
- Hansen Technologies
- Zuora
- BillingPlatform
- Rev.io
Additional Benefits:
- The market estimate (ME) sheet in Excel format
- 3 months of analyst support
TABLE OF CONTENTS
1 INTRODUCTION
- 1.1 Study Assumptions and Market Definition
- 1.2 Scope of the Study
2 RESEARCH METHODOLOGY
3 EXECUTIVE SUMMARY
4 MARKET LANDSCAPE
- 4.1 Market Overview
- 4.2 Market Drivers
- 4.2.1 Growing Number of Cellular or Mobile Subscribers
- 4.2.2 Growing Complexities in Revenue Sharing Across the Telecom Ecosystem
- 4.2.3 Cloud-native BSS transformations by Tier-1 CSPs
- 4.2.4 Expansion of private 5G and campus networks
- 4.2.5 Rise of Gen-AI-based hyper-personalised tariffs
- 4.2.6 Telco fintech-style "super-app" monetisation
- 4.3 Market Restraints
- 4.3.1 Presence of Stringent Telecom Regulations
- 4.3.2 Legacy OSS/BSS integration complexity
- 4.3.3 Scarcity of real-time billing talent
- 4.3.4 Emerging data-sovereignty compliance costs
- 4.4 Value/Supply-Chain Analysis
- 4.5 Regulatory Landscape
- 4.6 Technological Outlook
- 4.7 Porters Five Forces Analysis
- 4.7.1 Bargaining Power of Buyers/Consumers
- 4.7.2 Bargaining Power of Suppliers
- 4.7.3 Threat of New Entrants
- 4.7.4 Threat of Substitutes
- 4.7.5 Intensity of Competitive Rivalry
- 4.8 COVID-19 and Poly-Crisis Impact Assessment
- 4.9 Investment Analysis (CAPEX and VC Funding)
5 MARKET SIZE AND GROWTH FORECASTS (VALUE)
- 5.1 By Deployment
- 5.1.1 On-premise
- 5.1.2 Cloud/SaaS
- 5.2 By Type
- 5.2.1 Software
- 5.2.2 Services
- 5.3 By Operator
- 5.3.1 Mobile Operator
- 5.3.2 Internet Service Provider
- 5.3.3 MVNO/MVNE
- 5.4 By Geography
- 5.4.1 North America
- 5.4.1.1 United States
- 5.4.1.2 Canada
- 5.4.1.3 Mexico
- 5.4.2 South America
- 5.4.2.1 Brazil
- 5.4.2.2 Argentina
- 5.4.2.3 Rest of South America
- 5.4.3 Europe
- 5.4.3.1 Germany
- 5.4.3.2 United Kingdom
- 5.4.3.3 France
- 5.4.3.4 Russia
- 5.4.3.5 Rest of Europe
- 5.4.4 Asia-Pacific
- 5.4.4.1 China
- 5.4.4.2 India
- 5.4.4.3 Japan
- 5.4.4.4 Rest of Asia-Pacific
- 5.4.5 Middle East and Africa
- 5.4.5.1 Middle East
- 5.4.5.1.1 Saudi Arabia
- 5.4.5.1.2 Turkey
- 5.4.5.1.3 United Arab Emirates
- 5.4.5.1.4 Rest of Middle East
- 5.4.5.2 Africa
- 5.4.5.2.1 South Africa
- 5.4.5.2.2 Nigeria
- 5.4.5.2.3 Rest of Africa
- 5.4.5.1 Middle East
- 5.4.1 North America
6 COMPETITIVE LANDSCAPE
- 6.1 Market Concentration
- 6.2 Strategic Moves
- 6.3 Market Share Analysis
- 6.4 Company Profiles (includes Global level Overview, Market level overview, Core Segments, Financials as available, Strategic Information, Market Rank/Share for key companies, Products and Services, and Recent Developments)
- 6.4.1 Amdocs
- 6.4.2 Netcracker Technology
- 6.4.3 CSG Systems International
- 6.4.4 Oracle
- 6.4.5 Ericsson
- 6.4.6 Huawei
- 6.4.7 Nokia
- 6.4.8 SAP SE
- 6.4.9 Comarch
- 6.4.10 Optiva
- 6.4.11 Enghouse Networks
- 6.4.12 Sterlite Technologies
- 6.4.13 Intracom Telecom
- 6.4.14 Subex
- 6.4.15 MIND CTI
- 6.4.16 Openet (Amdocs Digital)
- 6.4.17 Hansen Technologies
- 6.4.18 Zuora
- 6.4.19 BillingPlatform
- 6.4.20 Rev.io
7 MARKET OPPORTUNITIES AND FUTURE OUTLOOK
- 7.1 White-space and Unmet-Need Assessment