
|
시장보고서
상품코드
2124626
인공지능(AI) : 시장 점유율 분석, 업계 동향 및 통계, 성장 예측(2026-2031년)Artificial Intelligence - Market Share Analysis, Industry Trends & Statistics, Growth Forecasts (2026 - 2031) |
||||||
 Mordor Intelligence
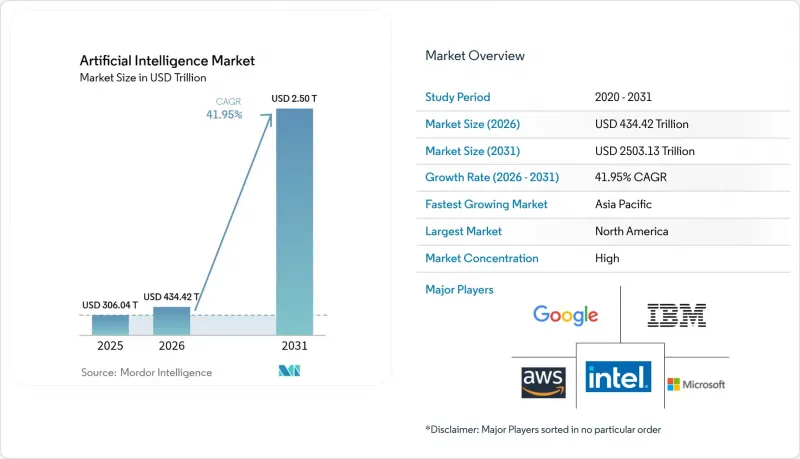
Mordor Intelligence에 의하면, 인공지능(AI) 시장 규모는 2025년 3,060억 4,000만 달러로 평가되었습니다. 2026년에는 4,344억 2,000만 달러로 확대되어 2026년부터 2031년에 걸쳐 CAGR 41.95%로 성장을 지속하여, 2031년에는 2조 5,031억 3,000만 달러에 이를 것으로 예측됩니다.

본 보고서에서는 업계를 구성 요소(하드웨어, 소프트웨어, 서비스), 배포 방식(퍼블릭 클라우드, On-Premise, 하이브리드), 기술(머신러닝, 딥러닝, 자연어 처리, 컴퓨터 비전,생성형 AI, 컨텍스트 인식 컴퓨팅, 기타), 최종 사용자 산업(은행, 금융서비스 및 보험(BFSI), IT 및 통신, 헬스케어 및 생명과학, 제조, 기타), 그리고 지역별로 분류하고 있습니다.
세계의 인공지능(AI) 시장 동향 및 인사이트
주권 AI와 국가 컴퓨팅 프로그램
정부의 자금 지원이 각국의 생태계를 형성하고 있습니다. 인도의 ‘IndiaAI 미션’에서는 현지 언어 요구를 충족하는 국산 대규모 언어 모델에 1만 372카롤 루피(1억 2,450만 달러)를 투자하고 있습니다. 일본은 AI 및 반도체 생산 능력 강화를 위해 10조 엔을 동원하며 자급자족을 향한 장기적인 노력을 보여주고 있습니다. 이러한 투자는 현지화 규정을 준수할 수 있는 국내 하드웨어 공급업체 및 시스템 통합사업자에 확실한 수요를 창출하고 있습니다.
데이터 양과 다양성의 폭발적인 증가
산업용 IoT의 도입으로 매일 테라바이트 규모의 센서 데이터가 생성되고 있으며, 기업들은 AI를 활용한 분석 도입을 서두르고 있습니다. 지멘스는 재무 업무에 머신러닝을 접목한 결과, 청구서 처리의 90%를 비접촉식으로 전환함과 동시에 연간 565만 달러의 ROI를 달성했다고 보고했습니다. 의료 영상 진단, 자율주행차, 소매업의 실시간 거래 등이 데이터 홍수를 더욱 가중시키고 있으며, 확장 가능한 스토리지, 엣지 처리 및 합성 데이터 생성 도구에 대한 수요를 높이고 있습니다.
GPU와 전력망공급 병목 현상
NVIDIA는 2026 회계연도 전망에서 H100의 만성적인 공급 부족을 지적했습니다. 이러한 제약으로 인해 현물 가격이 제조업체 권장 소매 가격(MSRP)보다 30-50% 높은 수준까지 치솟아, 기업의 도입 주기가 지연되고 있습니다. 각 전력사는 데이터센터의 전력 수요가 2026년까지 1,050 TWh에 달할 가능성이 있다고 예측하고 있으며, 이는 일부 주요 지역의 계획된 공급 증설량을 초과할 것으로 보입니다. 그 결과, 새로운 AI 클러스터 프로젝트 일정에 압박이 가해지고 있습니다.
부문별 분석
2025년, 소프트웨어는 매출 점유율 61.35%를 유지하며 인공지능(AI) 시장에서 기반적인 역할을 공고히 했습니다. 그러나 기업들이 실험 단계에서 본격적인 도입으로 초점을 옮기면서, 서비스 부문은 2031년까지 연평균 성장률(CAGR) 40.85%로 급성장할 것으로 예측됩니다. 많은 규제 산업에서는 현재 단순히 라이선스를 제공하는 것뿐만 아니라, 규정 준수 요건을 해석하고 워크플로우를 재설계할 수 있는 벤더가 요구되고 있습니다. 그 결과, 자격을 갖춘 통합 업체가 부족한 상황에서 서비스 제공업체는 특히 의료 및 금융 서비스와 같은 특정 분야의 프로젝트에서 높은 가격을 책정할 수 있게 되었습니다.
컨설팅, 통합, 매니지드 서비스 등 각 분야에서 수직적 전문 지식을 갖춘 벤더가 선호되고 있습니다. 방사선 의학 분야에서는 데이터 거버넌스, 알고리즘 검증, 임상의 워크플로우 재설계를 결합한 서비스 파트너십을 통해 병원 그룹이 5년 동안 451%의 ROI를 달성했습니다. 하드웨어, 소프트웨어 및 자문 지원을 성과 기반 계약으로 패키지화한 전문 업체들은 고객이 추상적인 모델의 정확도가 아닌 구체적인 생산성 목표를 바탕으로 프로젝트를 평가하게 됨에 따라 밸류체인의 업스트림로 진출하고 있습니다.
2025년, 퍼블릭 클라우드는 인공지능(AI) 시장의 43.72% 점유율을 차지하며, 기본 개발 환경으로서의 역할을 반영했습니다. 그러나 조직들이 프로덕션 환경에서의 지연 시간 최적화와 비용 가시성을 요구함에 따라, 하이브리드 모델은 2031년까지 연평균 성장률(CAGR) 45.55%를 나타낼 것으로 예측됩니다. 얼리 어답터 기업들은 하이퍼스케일 클러스터에서 훈련을 수행한 후, 실시간 응답을 얻기 위해 추론 처리를 On-Premise 또는 엣지 디바이스로 오프로드하고 있습니다. 자동차 제조업체들은 공장 현장에서 밀리초 수준의 시각적 작업을 수행하는 동시에 모델 재훈련을 위해 클라우드의 확장성을 유지함으로써 이 아키텍처의 유효성을 입증하고 있습니다.
엣지로의 배포는 대역폭 비용이 높은 해양 시추 시설이나 소매점 등 자원이 제한된 환경에서도 마찬가지로 중요합니다. 엄격한 데이터 상주 요건에 직면한 금융 업계와 공공 기관에서는 On-Premise 배포가 다시 활기를 띠고 있습니다. 현재 하드웨어 공급업체들은 폴리시(PolySi) 규칙에 기반하여 클라우드, On-Premise 랙, 엣지 디바이스 간에 컨테이너를 마이그레이션하는 오케스트레이션 소프트웨어를 번들로 제공하고 있으며, 이에 따라 하이브리드 솔루션을 위한 인공지능(AI) 시장 규모는 상승 추세를 유지하고 있습니다.
지역별 분석
북미는 풍부한 벤처 캐피털 자금, 성숙한 클라우드 생태계, 그리고 기업들의 급속한 AI 도입에 힘입어 2025년에도 37.12%의 점유율을 차지하며 매출 면에서 1위를 유지했습니다. ‘CHIPS and Science Act’와 같은 연방 프로그램은 AI 대응 반도체 제조 공장(팹)에 추가 자금을 투입하여 국내 하드웨어 공급을 뒷받침하고, 인공지능(AI) 시장을 강화하고 있습니다. 버지니아주, 텍사스주, 오리건주에 위치한 고성능 컴퓨팅 클러스터는 저지연을 실현하기 위해 클라우드 가용성 영역 근처에 거점을 둔 소프트웨어 스타트업들을 계속해서 유치하고 있습니다.
유럽의 성장 동향은 엄격한 데이터 개인정보 보호 규제와 막대한 국가 컴퓨팅 예산이라는 두 가지 요인에 의해 형성되고 있습니다. GDPR(EU 개인정보보호규정)을 준수하는 아키텍처로 인해 벤더들은 추론 워크로드를 지역 내 경계 내에 국한시켜야 하며, 이로 인해 On-Premise형 GPU 어플라이언스에 대한 수요가 발생하고 있습니다. 프랑스의 Mistral AI를 둘러싼 민관 공동 이니셔티브는 2025년에 20억 유로의 기업 가치를 달성하고, 다국어 모델 훈련을 확대하기 위해 10억 달러의 자금 조달을 목표로 하고 있습니다. 독일과 북유럽 국가들의 유사한 프로그램은 야심찬 탄소 감축 목표에 부합하는 친환경 데이터센터 구축에 초점을 맞추고 있으며, 이는 인공지능(AI) 시장의 지역별 두 자릿수 성장을 뒷받침하고 있습니다.
아시아태평양은 2031년까지 연평균 성장률(CAGR) 40.75%를 나타낼 것으로 예측되며, 이는 세계에서 가장 빠른 성장 속도입니다. 중국의 ‘국가 반도체 미션’은 2030년까지 칩 및 관련 인프라에 1조 위안(人民元)을 배정하고 있는 반면, 인도는 국가 AI 컴퓨팅에 1만 372 크롤을 책정하여 국내 통합업체들을 세계 랭킹 상위권으로 끌어올리고 있습니다. 일본에서는 수조 엔 규모의 기금을 통해 팹(fab) 업그레이드가 가속화되고 있으며, AI 규제 완화로 인해 상용화까지의 기간이 단축되고 있습니다. 싱가포르와 말레이시아를 포함한 동남아시아 국가들은 하이퍼스케일러가 지역 허브를 구축하도록 장려하는 데이터센터 세제 혜택을 도입하고 있으며, 이로 인해 해당 지역의 인공지능(AI) 시장 규모는 더욱 확대되고 있습니다.
기타 혜택 :
- 엑셀 형식 시장 예측(ME) 시트
- 3개월간의 애널리스트 지원
자주 묻는 질문
목차
제1장 서론
제2장 조사 방법
제3장 주요 요약
제4장 시장 구도
제5장 시장 세분화
제6장 경쟁 구도
제7장 시장 기회 및 향후 전망
KTH 26.09.14According to Mordor Intelligence, the artificial intelligence market size is expected to grow from USD 306.04 billion in 2025 to USD 434.42 billion in 2026 and is forecast to reach USD 2,503.13 billion by 2031 at 41.95% CAGR over 2026-2031.
This report Segments the Industry Into by Component (Hardware, Software, and Services), Deployment Mode (Public Cloud, On-Premise, and Hybrid), Technology (Machine Learning, Deep Learning, Natural Language Processing, Computer Vision, Generative AI, and Context-Aware Computing and Others), End-User Industry (BFSI, IT and Telecommunications, Healthcare and Life Sciences, Manufacturing, and More), and Geography.
Global Artificial Intelligence Market Trends and Insights
Sovereign AI and national compute programs
Government funding is shaping local ecosystems. India's IndiaAI Mission is channeling INR 10,372 crore (USD 124.5 million) into indigenous large language models that meet local language needs. Japan is mobilising JPY 10 trillion for AI and semiconductor capacity, signalling a long-term commitment to self-reliance. Such investments create protected demand for domestic hardware vendors and systems integrators that can comply with localisation rules.
Explosive growth in data volume and variety
Industrial IoT rollouts generate terabytes of sensor data daily, pushing enterprises to adopt AI-driven analytics. Siemens reports 90% touchless invoice processing and USD 5.65 million annual ROI after embedding machine learning into its finance operations. Healthcare imaging, autonomous vehicles, and real-time retail transactions all add to the data deluge, driving up demand for scalable storage, edge processing, and synthetic data generation tools.
GPU and power-grid supply bottlenecks
NVIDIA cited persistent H100 shortages in its FY 2026 outlook, a constraint that has inflated spot prices 30-50% above MSRP and slowed enterprise deployment cycles. Power utilities forecast that data-center electricity demand could hit 1,050 TWh by 2026, exceeding planned capacity additions in several major regions, which in turn pressures project timelines for new AI clusters.
Other drivers and restraints analyzed in the detailed report include:
- Surging adoption of cloud-based AI services
- Shift toward on-prem or private AI for TCO control
- High capex and talent shortages
For complete list of drivers and restraints, kindly check the Table Of Contents.
Segment Analysis
Software retained 61.35% revenue share in 2025, reinforcing its foundational role in the artificial intelligence market. Yet the Services segment is forecast to race ahead at 40.85% CAGR through 2031 as enterprises shift focus from experimentation to full-scale implementation. Many regulated industries now require vendors that can interpret compliance mandates and redesign workflows, rather than merely deliver licenses. The scarcity of qualified integrators, therefore, enables service providers to command premium pricing, especially for domain-specific projects in healthcare and financial services.
Across consulting, integration, and managed-services lines, vendors with vertical expertise are preferred. In radiology, service partnerships that combine data-governance, algorithm validation, and clinician workflow redesign are returning 451% ROI for hospital groups over five years. Specialists that package hardware, software, and advisory support into outcome-based contracts are moving up the value chain as customers measure projects against concrete productivity targets rather than abstract model accuracy.
Public Cloud held 43.72% of artificial intelligence market share in 2025, reflecting its role as the default development environment. Hybrid models, however, are projected to compound at 45.55% CAGR to 2031 as organizations seek latency optimization and cost visibility in production. Early adopters run training on hyperscale clusters then push inferencing to on-prem or edge devices for real-time response. Automotive OEMs validate this architecture by executing millisecond-level vision tasks on factory floors while retaining cloud elasticity for model retraining.
Edge rollouts are equally important in resource-constrained settings such as offshore rigs or retail outlets where bandwidth is expensive. On-prem deployments are resurging within finance and public-sector agencies that face strict data-residency mandates. Hardware suppliers now bundle orchestration software that migrates containers across clouds, on-prem racks, and edge devices based on policy rules, ensuring the artificial intelligence market size for hybrid solutions remains on an upward trajectory.
Complete Report Scope:
- By Component
- Hardware
- Software
- Services
- By Deployment Mode
- Public Cloud
- On-Premise
- Hybrid
- By Technology
- Machine Learning
- Deep Learning
- Natural Language Processing
- Computer Vision
- Generative AI
- Context-Aware Computing and Others
- By End-user Industry
- BFSI
- IT and Telecommunications
- Healthcare and Life Sciences
- Manufacturing
- Retail and E-commerce
- Automotive and Transportation
- Government and Defense
- Energy and Utilities
- Media and Entertainment
- Construction
- By Geography
- North America
- United States
- Canada
- Mexico
- South America
- Brazil
- Argentina
- Rest of South America
- Europe
- United Kingdom
- Germany
- France
- Italy
- Spain
- Nordics
- Rest of Europe
- Middle East and Africa
- Middle East
- Saudi Arabia
- United Arab Emirates
- Turkey
- Rest of Middle East
- Africa
- South Africa
- Egypt
- Nigeria
- Rest of Africa
- Middle East
- Asia-Pacific
- China
- India
- Japan
- South Korea
- ASEAN
- Australia
- New Zealand
- Rest of Asia-Pacific
- North America
Geography Analysis
North America remained the revenue leader with 37.12% share in 2025 thanks to deep venture capital pools, mature cloud ecosystems, and rapid enterprise adoption. Federal programs such as the CHIPS and Science Act funnel additional funding into AI-ready fabs, supporting domestic hardware supply and reinforcing the artificial intelligence market. High-performance computing clusters in Virginia, Texas, and Oregon continue to attract software start-ups that co-locate near cloud availability zones for lower latency.
Europe's growth profile is shaped by the twin forces of strict data-privacy regulation and sizable sovereign compute budgets. GDPR compliant architectures push vendors to localize inference workloads inside regional borders, creating demand for on-prem GPU appliances. France's public-private initiative around Mistral AI gained a €2 billion valuation in 2025 and aims to raise USD 1 billion to scale multilingual model training. Similar programs in Germany and the Nordics focus on green-data-center footprints that align with ambitious carbon-reduction targets, sustaining double-digit regional growth for the artificial intelligence market.
Asia-Pacific is projected to register a 40.75% CAGR through 2031, the fastest worldwide. China's National Semiconductor Mission allocates RMB 1 trillion by 2030 for chips and supporting infrastructure, while India earmarks INR10,372 crore for national AI compute, propelling domestic integrators into global rankings. Japan's multi-trillion-yen fund fast-tracks fab upgrades and light-touch AI regulation that accelerates time to commercial deployment. Southeast Asian economies, including Singapore and Malaysia, are introducing data-center tax incentives that entice hyperscalers to anchor regional hubs, further enlarging the artificial intelligence market size in the region.
- International Business Machines Corporation
- Intel Corporation
- Microsoft Corporation
- Google LLC (Alphabet Inc.)
- Amazon Web Services, Inc. (Amazon.com, Inc.)
- Oracle Corporation
- Salesforce, Inc.
- SAP SE
- SAS Institute Inc.
- Cisco Systems, Inc.
- Siemens AG
- NVIDIA Corporation
- Hewlett Packard Enterprise Company
- Accenture plc
- Baidu, Inc.
- Alibaba Cloud (Intelligent Cloud Business of Alibaba Group Holding Limited)
- Palantir Technologies Inc.
- OpenAI, Inc.
- Meta Platforms, Inc.
- Huawei Technologies Co., Ltd.
- Tencent Holdings Limited
- ServiceNow, Inc.
- Snowflake Inc.
Additional Benefits:
- The market estimate (ME) sheet in Excel format
- 3 months of analyst support
TABLE OF CONTENTS
1 INTRODUCTION
- 1.1 Study Assumptions and Market Definition
- 1.2 Scope of the Study
2 RESEARCH METHODOLOGY
3 EXECUTIVE SUMMARY
4 MARKET LANDSCAPE
- 4.1 Market Overview
- 4.2 Market Drivers
- 4.2.1 Rising demand for predictive analytics
- 4.2.2 Explosive growth in data volume/variety
- 4.2.3 Surging adoption of cloud-based AI services
- 4.2.4 Sovereign AI and national compute initiatives
- 4.2.5 Shift toward on-prem/private AI for TCO control
- 4.2.6 Demand for energy-efficient AI hardware
- 4.3 Market Restraints
- 4.3.1 High capex and talent shortages
- 4.3.2 Data-privacy and compliance barriers
- 4.3.3 GPU / power-grid supply bottlenecks
- 4.3.4 Data-center carbon-emission caps
- 4.4 Evaluation of Critical Regulatory Framework
- 4.5 Value Chain Analysis
- 4.6 Technological Outlook
- 4.7 Porter's Five Forces
- 4.7.1 Bargaining Power of Suppliers
- 4.7.2 Bargaining Power of Buyers
- 4.7.3 Threat of New Entrants
- 4.7.4 Threat of Substitutes
- 4.7.5 Competitive Rivalry
- 4.8 Impact Assessment of Key Stakeholders
- 4.9 Key Use Cases and Case Studies
- 4.10 Impact on Macroeconomic Factors of the Market
- 4.11 Investment Analysis
5 MARKET SEGMENTATION
- 5.1 By Component
- 5.1.1 Hardware
- 5.1.2 Software
- 5.1.3 Services
- 5.2 By Deployment Mode
- 5.2.1 Public Cloud
- 5.2.2 On-Premise
- 5.2.3 Hybrid
- 5.3 By Technology
- 5.3.1 Machine Learning
- 5.3.2 Deep Learning
- 5.3.3 Natural Language Processing
- 5.3.4 Computer Vision
- 5.3.5 Generative AI
- 5.3.6 Context-Aware Computing and Others
- 5.4 By End-user Industry
- 5.4.1 BFSI
- 5.4.2 IT and Telecommunications
- 5.4.3 Healthcare and Life Sciences
- 5.4.4 Manufacturing
- 5.4.5 Retail and E-commerce
- 5.4.6 Automotive and Transportation
- 5.4.7 Government and Defense
- 5.4.8 Energy and Utilities
- 5.4.9 Media and Entertainment
- 5.4.10 Construction
- 5.5 By Geography
- 5.5.1 North America
- 5.5.1.1 United States
- 5.5.1.2 Canada
- 5.5.1.3 Mexico
- 5.5.2 South America
- 5.5.2.1 Brazil
- 5.5.2.2 Argentina
- 5.5.2.3 Rest of South America
- 5.5.3 Europe
- 5.5.3.1 United Kingdom
- 5.5.3.2 Germany
- 5.5.3.3 France
- 5.5.3.4 Italy
- 5.5.3.5 Spain
- 5.5.3.6 Nordics
- 5.5.3.7 Rest of Europe
- 5.5.4 Middle East and Africa
- 5.5.4.1 Middle East
- 5.5.4.1.1 Saudi Arabia
- 5.5.4.1.2 United Arab Emirates
- 5.5.4.1.3 Turkey
- 5.5.4.1.4 Rest of Middle East
- 5.5.4.2 Africa
- 5.5.4.2.1 South Africa
- 5.5.4.2.2 Egypt
- 5.5.4.2.3 Nigeria
- 5.5.4.2.4 Rest of Africa
- 5.5.4.1 Middle East
- 5.5.5 Asia-Pacific
- 5.5.5.1 China
- 5.5.5.2 India
- 5.5.5.3 Japan
- 5.5.5.4 South Korea
- 5.5.5.5 ASEAN
- 5.5.5.6 Australia
- 5.5.5.7 New Zealand
- 5.5.5.8 Rest of Asia-Pacific
- 5.5.1 North America
6 COMPETITIVE LANDSCAPE
- 6.1 Market Concentration
- 6.2 Strategic Moves
- 6.3 Market Share Analysis
- 6.4 Company Profiles (includes Global level Overview, Market level overview, Core Segments, Financials as available, Strategic Information, Market Rank/Share for key companies, Products and Services, and Recent Developments)
- 6.4.1 International Business Machines Corporation
- 6.4.2 Intel Corporation
- 6.4.3 Microsoft Corporation
- 6.4.4 Google LLC (Alphabet Inc.)
- 6.4.5 Amazon Web Services, Inc. (Amazon.com, Inc.)
- 6.4.6 Oracle Corporation
- 6.4.7 Salesforce, Inc.
- 6.4.8 SAP SE
- 6.4.9 SAS Institute Inc.
- 6.4.10 Cisco Systems, Inc.
- 6.4.11 Siemens AG
- 6.4.12 NVIDIA Corporation
- 6.4.13 Hewlett Packard Enterprise Company
- 6.4.14 Accenture plc
- 6.4.15 Baidu, Inc.
- 6.4.16 Alibaba Cloud (Intelligent Cloud Business of Alibaba Group Holding Limited)
- 6.4.17 Palantir Technologies Inc.
- 6.4.18 OpenAI, Inc.
- 6.4.19 Meta Platforms, Inc.
- 6.4.20 Huawei Technologies Co., Ltd.
- 6.4.21 Tencent Holdings Limited
- 6.4.22 ServiceNow, Inc.
- 6.4.23 Snowflake Inc.
7 MARKET OPPORTUNITIES AND FUTURE OUTLOOK
- 7.1 White-space and Unmet-need Assessment