

|
시장보고서
상품코드
2124638
구강내 스캐너 : 시장 점유율 분석, 업계 동향 및 통계, 성장 예측(2026-2031년)Intraoral Scanners - Market Share Analysis, Industry Trends & Statistics, Growth Forecasts (2026 - 2031) |
||||||
 Mordor Intelligence
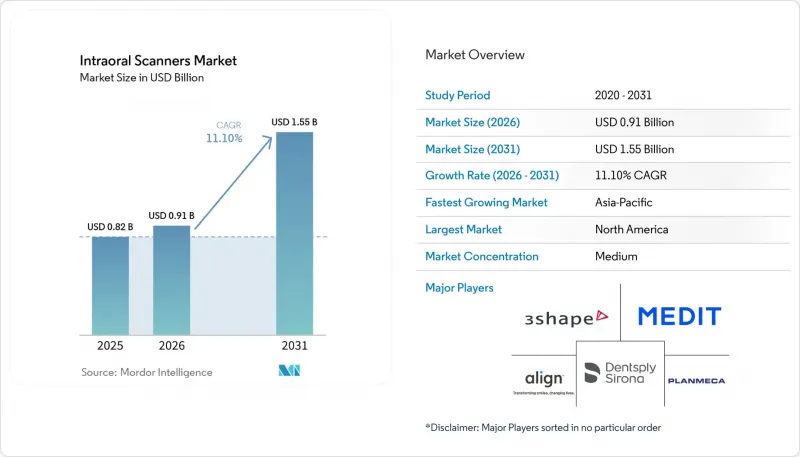
Mordor Intelligence에 의하면, 구강내 스캐너 시장 규모는 2025년에 8억 2,000만 달러로 평가되었습니다. 2026년에 9억 1,000만 달러에 달하고, 2031년까지 15억 5,000만 달러에 이를 것으로 예측되며, 2026년부터 2031년에 걸쳐 CAGR 11.10%로 성장할 전망입니다.
본 보고서는 모달리티(독립형 및 휴대형), 유형(파우더 프리형 및 파우더 베이스형), 연결 방식(유선 및 무선), 용도(교정치과 등), 최종 사용자(치과, 병원, 기타 최종 사용자),지역(북미, 유럽, 아시아태평양, 중동 및 아프리카, 남미)별로 분류되어 있습니다. 시장 예측은 금액(달러) 기준으로 제시되어 있습니다.
세계의 구강내 스캐너 시장 동향 및 인사이트
디지털 덴티스트리 및 CAD/CAM 워크플로우 도입
크라운의 납기 기간이 수 주에서 당일 처리로 단축됨에 따라, 환자 수가 많은 치과에서는 추가 수익을 확보하고 환자 이탈을 줄일 수 있게 되었습니다. 미국 내 스캐너 보급률은 2024년 진료소의 62%에 달했습니다. 이는 STL 파일 제출을 의무화하는 기공소의 요건과 디지털 인상 데이터만으로 작동하는 교정 시뮬레이션 소프트웨어의 보급이 뒷받침한 결과입니다. Glidewell과 같은 전 세계 치과 기공소에서는 2025년 크라운 수주의 78%를 STL 파일로 접수했으며, 도입이 늦어지고 있는 치과 병원은 디지털화를 추진하지 않아 주요 치과 기공소와의 거래 관계를 잃을 위험에 직면했습니다. 또한, 투명 교정기 생태계에서도 스캐너는 사실상 필수 요건이 되었으며, 해당 장치는 일상적인 업무 흐름에 더욱 깊이 통합되고 있습니다.
심미 치과 치료에 대한 수요 증가
도시 지역의 치과에서는 환자들이 미소 완성 이미지를 신속하게 확인할 수 있기를 기대함에 따라, 베니어나 본딩 사례가 급증하고 있는 것으로 보고되고 있습니다. 구강내 스캔을 통해 직접 생성되는 디지털 모크업 덕분에 선택적 치료 상담 건수가 더 높은 비율로 증가하고 있으며, 치과의사는 20% 이상의 추가 요금을 책정할 수 있게 되었습니다. 소셜 미디어를 통한 이미지에 대한 인식이 높아지면서 젊은 층이 저침습적 수복 치료를 요구하게 되었고, 치과 병원들은 단 한 번의 내원만으로 진료석에서 미리보기가 가능한 스캐너에 투자해야 하는 상황에 놓여 있습니다. 성장은 여전히 고소득 도시 지역에 편중되어 있으며, 지방 수요는 아직 초기 단계에 머물러 있습니다.
높은 초기 투자 비용과 총 소유 비용
도입 가격은 약 1만 5,000달러부터 시작되며, 고급 진단 기능을 결합하면 5만 달러를 초과하기도 하는데, 이는 미국 치과의사의 순소득 중앙값의 최대 100%에 해당합니다. 추가 소프트웨어, 일회용 팁, 서비스 계약으로 인해 총 소유 비용이 상승하며, 진료 건수가 적은 클리닉에서는 투자 회수 기간이 길어집니다. 관세와 대출 금리로 인해 저소득 시장에서는 실질 가격이 상승하여 도입을 더욱 저해하고 있습니다.
부문별 분석
2025년에는 카트형 시스템이 구강내 스캐너 시장의 60.00%를 차지했습니다. 이는 여러 진료실이 있는 환경에서 중앙 집중식 스테이션이 진료용 의자당 자본 비용을 절감하기 때문입니다. 반면, 이동식 치과 진료 및 도시 지역의 제한된 부동산 사정으로 인해 공간 절약이 중요시됨에 따라 휴대용 핸드헬드 유닛 시장은 연평균 성장률(CAGR) 13.00%로 확대될 것으로 예측됩니다. 한 번 충전으로 90분을 초과하는 무선 작동 시간이 원동력이 되어, 휴대용 모델과 관련된 구강내 스캐너 시장 규모는 2031년까지 7억 3,000만 달러에 달할 것으로 예측됩니다. 그러나 임플란트 전문의들은 뛰어난 열 관리와 높은 스캔 정밀도를 이유로 여전히 카트형을 선호하고 있어, 그로 인해 모달리티의 다양성이 유지되고 있습니다.
하이브리드 설계는 두 유형의 경계를 모호하게 만들고 있습니다. 유선 모드와 무선 모드를 전환할 수 있는 탈부착식 핸드피스를 통해 치과 진료소는 중복 구매 없이 증례의 복잡성에 따라 최적의 설정을 선택할 수 있습니다. 병원 및 교육 기관에서는 네트워크 보안의 관점에서 여전히 유선 연결을 선호하고 있어, 예측 기간 동안 안정적인 듀얼 모달리티 시장 구조가 지속될 것으로 보입니다.
2025년에는 파우더 프리 광학 시스템이 매출의 85.00%를 차지하며, 연평균 성장률(CAGR) 11.00%로 시장 전체의 성장세와 보조를 맞췄습니다. 이산화티타늄 분진을 제거함으로써 스캔 시간이 단축되고, 환자의 편안함이 향상되며, 유럽의 화학 물질 규제에서 지적된 흡입 위험이 해소됩니다. 파우더 방식의 장치는 주로 중고 시장이나 반사면의 보정이 필요한 특수한 이용 사례로 제한되어 있습니다. AI 제어에 의한 노광 기술의 발전에 따라 이러한 틈새 시장조차 축소되고 있습니다. 2030년까지 분석가들은 분말 기반 제품 시장 점유율이 5% 미만으로 떨어질 것으로 예측하고 있으며, 사실상 이 부문은 단일 지배적 기술로 통합될 것입니다.
지역별 분석
북미는 FDA의 510(k) 규정 명확화와 디지털 인상 비용을 보상하는 민간 보험 코드의 지원에 힘입어 2025년 매출의 42.20%를 차지했습니다. 시장 침투율은 60%를 넘어섰으며, 이 지역의 초점은 초기 구매에서 교체 주기 및 AI를 활용한 소프트웨어 업그레이드로 이동하고 있습니다. 캐나다는 미국에 뒤처져 있지만, 각 주의 보험사들이 디지털 인상물 환급 제도를 시범 도입함에 따라 그 격차는 점차 좁혀지고 있습니다.
아시아태평양은 연평균 성장률(CAGR) 12.80%를 기록하며 가장 빠르게 성장하고 있습니다. 중국 국무원(국무원)은 치과 의료 인프라 확대와 최신 진단 기능 도입을 의무화하고 있는 반면, 인도의 민간 치과 체인들은 병원 내 실험실 비용을 확보하기 위해 네트워크 전반에 스캐너를 도입하고 있습니다(3). 일본과 한국에서는 국민건강보험의 지원 덕분에 시장 침투율이 50%를 넘어섰습니다. 동남아시아에서는 가격에 대한 민감성과 규제의 불균일성이 보급을 저해하고 있지만, 대상을 좁힌 자금 조달 및 구독 모델이 경제적 부담의 격차를 해소하는 데 일조하고 있습니다.
유럽은 약 30%의 점유율을 차지하고 있으며, 독일, 영국, 스칸디나비아 국가에서 도입이 특히 활발합니다. EU의 의료기기 규정에 따라 규정 준수 비용은 증가했으나, 국경을 넘는 치과 관광을 배경으로 중부 유럽의 치과 병원들은 내원 환자를 유치하기 위해 스캐너에 대한 투자와 신호 품질 향상에 적극적으로 나서고 있습니다. 남유럽은 구매력이 낮아 도입 속도가 여전히 완만하지만, 이탈리아와 스페인에서 특정 대상을 대상으로 한 보조금 제도를 통해 디지털화로의 전환이 서서히 촉진되기 시작하고 있습니다.
중동, 아프리카 및 남미는 각각 매출의 8% 미만을 차지할 뿐이지만, 높은 성장세를 보이는 도시권이 존재합니다. UAE와 사우디아라비아의 정부 산하 클리닉에서는 세계적 모범 사례에 부합하기 위해 스캐너 도입이 진행되고 있습니다. 대조적으로, 라틴아메리카에서는 관세로 인한 가격 프리미엄이 있음에도 불구하고, 브라질의 민간 부문을 중심으로 보급이 진행되고 있습니다.
기타 혜택 :
- 엑셀 형식 시장 예측(ME) 시트
- 3개월간의 애널리스트 지원
자주 묻는 질문
목차
제1장 서론
제2장 조사 방법
제3장 주요 요약
제4장 시장 구도
제5장 시장 규모 및 성장 예측
제6장 경쟁 구도
제7장 시장 기회 및 향후 전망
KTH 26.09.14According to Mordor Intelligence, the intraoral scanners market size is projected to be USD 0.82 billion in 2025, USD 0.91 billion in 2026, and reach USD 1.55 billion by 2031, growing at a CAGR of 11.10% from 2026 to 2031.
This report is Segmented by Modality (Stand-Alone and Portable), Type (Powder-Free and Powder-Based), Connectivity (Wired and Wireless), Application (Orthodontics, and More), End User (Dental Clinics, Hospitals, and Other End Users), and Geography (North America, Europe, Asia-Pacific, Middle East and Africa, and South America). The Market Forecasts are Provided in Terms of Value (USD).
Global Intraoral Scanners Market Trends and Insights
Adoption of Digital Dentistry and CAD/CAM Workflows
The turnaround time for crown delivery has dropped from weeks to same-day service, enabling high-volume clinics to capture incremental revenue and reduce patient attrition. United States scanner penetration reached 62% of practices in 2024, driven by lab mandates that now require STL submissions and by orthodontic simulation software that operates exclusively on digital impressions. Global laboratories, such as Glidewell, received 78% of the 2025 crown orders as STL files, forcing late adopters to digitize or risk losing key lab relationships. Clear-aligner ecosystems also make scanners a virtual prerequisite, further integrating devices into routine workflows.
Increasing Demand for Cosmetic and Aesthetic Dental Procedures
Urban clinics report a surge in veneer and bonding cases as patients expect rapid visualizations of smile outcomes. Digital mock-ups generated directly from intraoral scans increase elective consultations at higher rates and enable providers to command fee premiums of more than 20%. Social-media-driven image consciousness drives younger demographics to seek minimally invasive restorations, pressuring practices to invest in scanners that deliver chairside previews within a single visit. Growth remains skewed towards high-income metros, while rural demand remains nascent.
High Initial Capital Expenditure and Total Cost of Ownership
Entry pricing starts at around USD 15,000 and can exceed USD 50,000 when bundled with advanced diagnostics, representing up to 100% of a median U.S. dentist's net income. Add-on software, disposable tips, and service contracts lift total ownership costs, lengthening payback periods for low-volume clinics. Tariffs and financing rates raise effective prices in lower-income markets, further deterring adoption.
Other drivers and restraints analyzed in the detailed report include:
- Technological Improvements in Scan Speed, Accuracy, and AI Automation
- Growth of Teledentistry and Remote Treatment Planning
- Limited Interoperability and Proprietary File Formats Across Scanner Ecosystems
For complete list of drivers and restraints, kindly check the Table Of Contents.
Segment Analysis
Cart systems controlled 60.00% of the intraoral scanners market in 2025 because centralized stations lower per-chair capital cost in multi-operatory settings. Portable hand-held units are forecast to rise at a 13.00% CAGR as mobile dentistry and tight urban real estate prioritize space savings. The intraoral scanners market size tied to portable models is projected to reach USD 0.73 billion by 2031, driven by wireless operation times exceeding 90 minutes per charge. Yet implantologists still favor carts for superior thermal management and higher scan fidelity, thereby maintaining modality diversity.
Hybrid designs blur the line: detachable handpieces that shift between wired and wireless modes help practices optimize for case complexity without making duplicate purchases. Hospitals and teaching institutions still prefer tethers for network security, indicating a stable dual-modality landscape through the forecast horizon.
Powder-free optics accounted for 85.00% of the revenue in 2025 and mirrored overall growth with an 11.00% CAGR. Eliminating titanium dioxide dust reduces scan times, enhances patient comfort, and eliminates the inhalation risk flagged under European chemical regulations. Powder-based devices primarily reside on resold secondary markets and in specialty use cases that require reflective-surface compensation. As AI-controlled exposure improves, even those niches are shrinking. By 2030, analysts expect powder-based share to dip below 5%, effectively consolidating the category into a single dominant technology.
Complete Report Scope:
- By Modality
- Stand-Alone (Cart-Based)
- Portable (Hand-Held)
- By Type
- Powder-Free
- Powder-Based
- By Connectivity
- Wired
- Wireless
- By Application
- Orthodontics
- Prosthodontics
- Implantology
- Other Applications
- By End User
- Dental Clinics
- Hospitals
- Other End Users
- Geography
- North America
- United States
- Canada
- Mexico
- Europe
- Germany
- United Kingdom
- France
- Italy
- Spain
- Rest of Europe
- Asia-Pacific
- China
- Japan
- India
- South Korea
- Australia
- Rest of Asia-Pacific
- Middle-East and Africa
- GCC
- South Africa
- Rest of Middle East and Africa
- South America
- Brazil
- Argentina
- Rest of South America
- North America
Geography Analysis
North America captured 42.20% of 2025 revenue, propelled by FDA 510(k) regulatory clarity and private insurance codes that reimburse digital impressions. Market penetration surpassed 60%, transitioning regional focus from first-time purchases to replacement cycles and AI-powered software upgrades. Canada trails the United States but is narrowing the gap as provincial insurers pilot digital-impression reimbursement schemes.
The Asia-Pacific region is the fastest-growing, with a 12.80% CAGR. China's State Council is expanding the dental base and mandating modern diagnostic capabilities, while India's private chains deploy a scanner network-wide to capture in-house lab fees[3]. Penetration is over 50% in Japan and South Korea, thanks to national health insurance support. Price sensitivity and fragmented regulation continue to limit uptake in Southeast Asia; however, targeted financing and subscription models are helping to close the affordability gap.
Europe holds a roughly 30% share with strong adoption in Germany, the U.K., and Scandinavia. The EU Medical Device Regulation has raised compliance costs, but cross-border dental tourism motivates Central European clinics to invest in scanners and improve signal quality to attract incoming patients. Southern Europe remains slower due to lower spending power, though targeted subsidies in Italy and Spain are starting to encourage digital upgrades.
Middle East & Africa and South America each represent under 8% of sales but feature high-growth urban clusters. Government-backed clinics in the UAE and Saudi Arabia are adopting scanners to align with global best practices. In contrast, the Latin American uptake is centered in Brazil's private sector, despite tariff-driven price premiums.
- 3 Shape
- Align Technology
- Condor Technologies NV
- Densys Ltd.
- Dentsply Sirona
- GC Corporation
- Guangdong Launca Medical Device Tech Co., Ltd.
- Straumann Group
- Ivoclar Vivadent
- MEDIT Corp.
- Owandy Radiology
- Planmeca
- Shining 3D Tech Co., Ltd.
- Vatech Co., Ltd.
- Zimmer Biomet
Additional Benefits:
- The market estimate (ME) sheet in Excel format
- 3 months of analyst support
TABLE OF CONTENTS
1 Introduction
- 1.1 Study Assumptions & Market Definition
- 1.2 Scope of the Study
2 Research Methodology
3 Executive Summary
4 Market Landscape
- 4.1 Market Overview
- 4.2 Market Drivers
- 4.2.1 Adoption of Digital Dentistry and CAD/CAM Workflows
- 4.2.2 Increasing Demand for Cosmetic and Aesthetic Dental Procedures
- 4.2.3 Technological Improvements in Scan Speed, Accuracy, and AI Automation
- 4.2.4 Growth of Teledentistry and Remote Treatment Planning Requiring High-Quality Digital Impressions
- 4.2.5 Rising Availability of Flexible Financing and Subscription Models Lowering Barrier to Entry
- 4.3 Market Restraints
- 4.3.1 High Initial Capital Expenditure and Total Cost of Ownership
- 4.3.2 Limited Interoperability and Proprietary File Formats across Scanner Ecosystems
- 4.3.3 Bandwidth, Data Privacy, and Cybersecurity Challenges in Cloud-Enabled Workflows
- 4.3.4 Limited Reimbursement Policies and Low Adoption Rates in Certain Regions
- 4.4 Value / Supply-Chain Analysis
- 4.5 Regulatory Outlook
- 4.6 Porter's Five Forces Analysis
- 4.6.1 Bargaining Power of Suppliers
- 4.6.2 Bargaining Power of Buyers
- 4.6.3 Threat of New Entrants
- 4.6.4 Threat of Substitutes
- 4.6.5 Intensity of Competitive Rivalry
5 Market Size & Growth Forecasts (Value, USD)
- 5.1 By Modality
- 5.1.1 Stand-Alone (Cart-Based)
- 5.1.2 Portable (Hand-Held)
- 5.2 By Type
- 5.2.1 Powder-Free
- 5.2.2 Powder-Based
- 5.3 By Connectivity
- 5.3.1 Wired
- 5.3.2 Wireless
- 5.4 By Application
- 5.4.1 Orthodontics
- 5.4.2 Prosthodontics
- 5.4.3 Implantology
- 5.4.4 Other Applications
- 5.5 By End User
- 5.5.1 Dental Clinics
- 5.5.2 Hospitals
- 5.5.3 Other End Users
- 5.6 Geography
- 5.6.1 North America
- 5.6.1.1 United States
- 5.6.1.2 Canada
- 5.6.1.3 Mexico
- 5.6.2 Europe
- 5.6.2.1 Germany
- 5.6.2.2 United Kingdom
- 5.6.2.3 France
- 5.6.2.4 Italy
- 5.6.2.5 Spain
- 5.6.2.6 Rest of Europe
- 5.6.3 Asia-Pacific
- 5.6.3.1 China
- 5.6.3.2 Japan
- 5.6.3.3 India
- 5.6.3.4 South Korea
- 5.6.3.5 Australia
- 5.6.3.6 Rest of Asia-Pacific
- 5.6.4 Middle-East and Africa
- 5.6.4.1 GCC
- 5.6.4.2 South Africa
- 5.6.4.3 Rest of Middle East and Africa
- 5.6.5 South America
- 5.6.5.1 Brazil
- 5.6.5.2 Argentina
- 5.6.5.3 Rest of South America
- 5.6.1 North America
6 Competitive Landscape
- 6.1 Market Concentration
- 6.2 Market Share Analysis
- 6.3 Company Profiles (includes Global-level Overview, Market-level Overview, Core Segments, Financials, Strategic Information, Market Rank/Share, Products & Services, Recent Developments)
- 6.3.1 3Shape A/S
- 6.3.2 Align Technology Inc.
- 6.3.3 Condor Technologies NV
- 6.3.4 Densys Ltd.
- 6.3.5 Dentsply Sirona Inc.
- 6.3.6 GC Corporation
- 6.3.7 Guangdong Launca Medical Device Tech Co., Ltd.
- 6.3.8 Institut Straumann AG
- 6.3.9 Ivoclar Vivadent AG
- 6.3.10 MEDIT Corp.
- 6.3.11 Owandy Radiology
- 6.3.12 Planmeca Oy
- 6.3.13 Shining 3D Tech Co., Ltd.
- 6.3.14 Vatech Co., Ltd.
- 6.3.15 Zimmer Biomet Holdings Inc.
7 Market Opportunities & Future Outlook
- 7.1 White-Space & Unmet-Need Assessment


