

|
시장보고서
상품코드
2124672
유체 동력 장비 시장 : 시장 점유율 분석, 업계 동향 및 통계, 성장 예측(2026-2031년)Fluid Power Equipment - Market Share Analysis, Industry Trends & Statistics, Growth Forecasts (2026 - 2031) |
||||||
 Mordor Intelligence
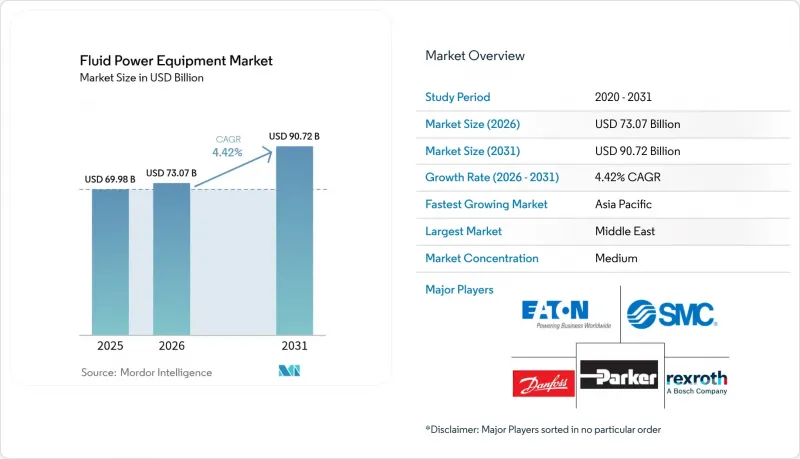
Mordor Intelligence에 의하면, 유체 동력 장비 시장 규모는 2025년 699억 8,000만 달러로 평가되었고, 2026년에는 730억 7,000만 달러로 추정되고, 2026-2031년 CAGR 4.42%로 성장을 지속할 전망이며, 2031년에는 907억 2,000만 달러에 이를 것으로 예측됩니다.
본 보고서는 기술별(유압 장비, 공압 장비), 제품 유형별(펌프, 모터, 밸브, 실린더, 어큐뮬레이터, 필터), 최종 사용자 산업별(건설, 농업, 자재관리·물류, 항공우주 및 방위 등), 유통 채널별(OEM, 애프터마켓), 지역별로 분류되어 있습니다. 시장 예측은 금액(달러) 기준으로 제시되어 있습니다.
세계의 유체 동력 장비 시장 동향 및 인사이트
에너지 효율 및 환경 고려
CARB Tier 5 및 향후 시행될 EPA 2027 규정 등의 규제로 인해 이동식 및 고정식 장비에 고효율 펌프, 모터, 밸브의 도입이 가속화되고 있습니다. IE5 동기 릴랙턴스 모터와 결합된 가변 속도 구동 장치를 통해 지방자치단체의 상수도 유틸리티에서 펌프의 전력 소비량이 최대 60%까지 절감되었습니다. 펄스 폭 변조(PWM)로 제어되는 디지털 유압 밸브는 스로틀링 손실을 제거하고 정수압 전달 효율을 15-36% 향상시켰습니다. 파커 허니핀은 2030년까지 사업 활동에 따른 탄소 발자국을 50% 감축하는 것을 목표로 하고 있으며, 이 목표가 해당 기업의 에너지 최적화 부품 수요를 뒷받침하고 있습니다. 이러한 요인들이 복합적으로 작용하여 주요 응용 분야의 개조 및 교체 활동을 촉진하고, 유체 동력 장비 시장을 견인하고 있습니다.
산업 자동화의 발전
인더스트리 4.0 아키텍처 덕분에 유체 동력 부품은 작동 매개변수를 실시간으로 통신할 수 있게 되어, 적응형 제어와 원격 진단이 용이해졌습니다. SMC 주식회사의 OPC UA 대응 공압 장비는 전자기기 조립 라인에서 예기치 못한 가동 중단 시간을 20-30% 줄이고 있습니다. 현재 머신러닝 알고리즘을 통해 펌프의 배기량과 작동 압력이 동적으로 조정되어, 정수압 변속기의 에너지 이용률이 36% 향상되었습니다. 또한, 협동 로봇이나 무인 운반차(AGV)에서 하이브리드형 전기유압 구동 방식이 보급되고 있어, 이에 따라 유체 동력 장비 시장의 잠재적 수요가 확대되고 있습니다.
중공업 분야의 주기적인 설비 투자
파커 허니핀(Parker Hannifin)의 2025년 2분기 북미 다각화 산업 부문 매출은 운송 및 오프로드 분야 고객들이 새로운 유압 장비 주문을 연기함에 따라 유기적으로 5.8% 감소했습니다. 건설 기계 OEM 업체들은 금리 상승과 인프라 투자 전망의 불확실성을 배경으로 재생 주기를 연장하고 있으며, 이로 인해 단기적인 유체 동력 부품 수요가 둔화되고 있습니다. 이와 유사한 신중한 태도는 고압 펌프 및 모터의 주요 수요처인 광업 및 1차 금속 부문에서도 나타납니다. 이러한 변동으로 인해 거시적인 투자 심리가 안정될 때까지는 유체 동력 장비 시장의 꾸준한 성장이 제한될 것입니다.
부문별 분석
유압 솔루션은 2025년 매출의 60.92%를 차지했으며, 굴삭기, 프레스 기계, 시추 장비에서 타의 추종을 불허하는 출력 밀도 덕분에 유체 동력 장비 시장 점유율에서 가장 큰 비중을 차지하고 있습니다. 각 공급업체들은 가변 용량 펌프와 디지털 컨트롤러를 결합하여 유량 제어 정밀도를 향상시키고 연료 소비량을 절감하고 있습니다. 공압 분야는 규모는 작지만, 전자기기 조립 및 생명과학 분야의 포장에서 경량 엔드 이펙터에 대한 수요를 배경으로 2031년까지 연평균 성장률(CAGR) 4.69%를 기록할 전망입니다. 공압 분야의 유체 동력 장비 시장 규모 확대는 사이클 카운트 및 누출률 경보를 엣지 게이트웨이에 전송하는 스마트 센서에 의해 더욱 가속화되고 있습니다. 하이브리드 아키텍처도 부상하고 있습니다. 저유량의 공압 시스템이 위치 결정을 담당하고, 유압 시스템이 최대 출력을 공급함으로써 두 분야 모두에 새로운 수익 기회가 창출되고 있습니다.
높은 스위칭 주파수의 디지털 밸브에 대한 지속적인 연구 개발로 인해, 이 두 기술 간의 성능 격차는 점차 좁혀지고 있습니다. 현장 테스트에 따르면, 이산 유량식 유압 회로는 비례 제어에 비해 에너지 손실을 20% 줄이고 있으며, 이러한 개선 사항은 자재관리용 지게차 분야에서 지지를 얻고 있습니다. 공압 분야에서는 압력 피드백 기능을 통합한 진공 이젝터의 설계를 통해 압축 공기 소비량을 최대 50% 절감함으로써 공장 운영 비용을 낮추고 있습니다. 이러한 발전들이 결합되어 유체 동력 장비 시장은 기존의 강점과 디지털의 민첩성을 양립시키는 현대화의 궤도를 계속 걷고 있습니다.
2025년 매출에서 펌프가 차지하는 비중은 27.12%로 평가되었고, 모든 회로의 핵심이자 광범위한 유체 동력 장비 시장의 초석으로서의 역할이 입증되고 있습니다. 수요는 상수도 관리, 제철소, 임업용 수확기 등 다방면에 걸쳐 있습니다. 전자식 압력 보정, 양방향 텔레매틱스, 상태 모니터링 프로브는 모두 펌프의 부품표(BOM) 구성 비율을 높여 공급업체의 부가가치 향상으로 이어지고 있습니다. 대조적으로, 어큐뮬레이터와 필터는 현재 규모가 작지만 2031년까지 연평균 5.52%의 성장이 예상됩니다. 이러한 급속한 성장은 각각 반도체 제조 공장에서의 에너지 회수 의무화와 식품 공장에서의 오염 기준 강화에 기인합니다.
필터는 차압을 줄이고, 엘리먼트의 수명을 연장하며, 모터의 부하를 경감시키는 고분리 성능의 마이크로 글라스 미디어로 전환되고 있습니다. 어큐뮬레이터의 설계에는 2만 회의 충방전 사이클을 견딜 수 있는 블래더 소재가 채택되어 있어, 하이브리드 크레인 및 농업용 분무기의 가동 프로파일을 충족하고 있습니다. 이러한 카테고리의 이익률은 업계 평균을 상회하는 추세를 보이고 있으며, 이는 공급업체들이 시스템 전반의 최적화 및 수명 주기 모니터링을 목적으로 한 연구 개발에 주력하고 있는 이유를 뒷받침합니다. 이러한 제품 구성의 변화로 인해, 표면상의 성장률은 완만할지라도 유체 동력 장비 시장 규모는 수익성 향상으로 이어질 전망입니다.
지역별 분석
아시아태평양은 2025년 매출의 34.10%를 차지하며 1위 점유율을 유지했습니다. 이는 중국의 전자 산업 클러스터, 인도의 고속도로 정비, 그리고 동남아시아의 포장 수출 거점이 주도하고 있습니다. 각 지역 정부는 유압 프레스와 공압식 픽 앤 플레이스 시스템 모두를 우대하는 산업 자동화 보조금을 지속적으로 추진하고 있으며, 이것이 유체 동력 장비 시장의 꾸준한 성장을 뒷받침하고 있습니다. 중국 내 전기차로의 전환 가속화는 배터리 제조용 컨베이어 및 냉각 펌프에 대한 수요를 자극하고 있습니다. 인도의 휴대전화 조립을 위한 ‘생산 연계형 인센티브(PLI)’ 제도에 따라 수십 곳의 새로운 클린룸 시설 건설이 요구되고 있으며, 각 시설에는 수소 내성 공압 밸브가 장착될 예정이므로 판매량은 더욱 증가할 것으로 보입니다.
중동은 가장 빠르게 성장하는 지역으로, 2031년까지 연평균 성장률(CAGR)이 5.44%를 나타낼 것으로 예측됩니다. 사우디아라비아의 ‘비전 2030’이나 UAE의 ‘오퍼레이션 3,000억’과 같은 전략에 따라 태양광 발전을 이용한 해수 담수화, 그린 수소용 전해 장치, 첨단 물류에 대한 투자가 집중되고 있으며, 이 모든 분야는 견고한 유체 동력 제어에 의존하고 있습니다. 가혹한 주변 온도 환경에서는 특수 씰과 열 안정성이 높은 작동유가 요구되며, 이는 전 세계 부품 공급업체들에게 수익성이 높은 틈새 시장을 창출하고 있습니다. 유럽 공급망의 가교 역할을 하는 튀르키예에서는 고톤수 유압 프레스를 이용한 자동차용 프레스 가공 능력이 확대되고 있으며, 이는 수주 증가를 뒷받침하고 있습니다.
북미와 유럽에서는 설비 투자의 둔화로 인해 단기적인 성장세는 완만하지만, 유체 동력 장비 시장에 있어 여전히 중요한 혁신의 거점으로 남아 있습니다. 파커 허니핀의 북미 산업용 매출은 감소했으나, 항공우주 애프터마켓 수요와 의료기기 수주가 그 감소분의 일부를 상쇄했습니다. 유럽에서 Tier 5 오프로드 배기가스 기준으로의 전환에 따라 유압 굴삭기 및 농업용 분무기에 대한 저배출 펌프 개조가 활발해지고 있으며, 이는 신규 기계 생산 감소를 상쇄하고 있습니다. 이러한 성숙한 지역에서는 거시경제의 불확실성이 완화되면, 기존 공장에서 법규에 따른 에너지 효율 향상 노력도 뒷받침되어 다시 활기를 되찾을 것으로 전망됩니다.
기타 혜택 :
- 엑셀 형식 시장 예측(ME) 시트
- 3개월간의 애널리스트 지원
자주 묻는 질문
목차
제1장 서론
제2장 조사 방법
제3장 주요 요약
제4장 시장 구도
제5장 시장 규모 및 성장 예측
제6장 경쟁 구도
제7장 시장 기회 및 향후 전망
AJY 26.09.15According to Mordor Intelligence, the fluid power equipment market size is expected to grow from USD 69.98 billion in 2025 to USD 73.07 billion in 2026 and is forecast to reach USD 90.72 billion by 2031 at 4.42% CAGR over 2026-2031.
This report is Segmented by Technology (Hydraulic Equipment, and Pneumatic Equipment), Product Type (Pumps, Motors, Valves, Cylinders, and Accumulators and Filters), End-User Industry (Construction, Agriculture, Material Handling and Logistics, Aerospace and Defense and More), Distribution Channel (OEM, and Aftermarket), and Geography. The Market Forecasts are Provided in Terms of Value (USD).
Global Fluid Power Equipment Market Trends and Insights
Energy Efficiency and Environmental Considerations
Regulations such as CARB Tier 5 and forthcoming EPA 2027 rules are accelerating the adoption of high-efficiency pumps, motors and valves in mobile and stationary equipment. Variable-speed drives paired with IE5 synchronous reluctance motors are cutting pump electricity use by up to 60 % in municipal water utilities. Digital hydraulic valves managed through pulse-width modulation are eliminating throttling losses, raising hydrostatic transmission efficiency by 15-36 %. Parker Hannifin aims to lower its operational carbon footprint 50 % by 2030, a target that underpins demand for its energy-optimized components. Combined, these forces lift the fluid power equipment market by driving retrofit and replacement activity across core applications.
Advances in Industrial Automation
Industry 4.0 architectures allow fluid power components to communicate operating parameters in real time, facilitating adaptive control and remote diagnostics. SMC Corporation's OPC UA-enabled pneumatics cut unscheduled downtime 20-30 % in electronics assembly lines. Machine-learning algorithms now adjust pump displacement and working pressures dynamically, improving energy utilization by 36 % in hydrostatic transmissions. Hybrid electro-hydraulic actuation is gaining traction in collaborative robots and automated guided vehicles, enlarging addressable demand for the fluid power equipment market.
Cyclical Capital Expenditure in Heavy Industries
North American diversified industrial revenue at Parker Hannifin fell 5.8 % organically in Q2 2025 as transportation and off-highway customers delayed new hydraulic equipment orders. Construction machinery OEMs are stretching rebuild cycles amid higher interest rates and uncertain infrastructure outlays, dampening near-term fluid power component uptake. Similar caution is visible in mining and primary metal segments, both large consumers of high-pressure pumps and motors. These swings limit consistent growth for the fluid power equipment market until macro-investment sentiment stabilizes.
Other drivers and restraints analyzed in the detailed report include:
- Technical Improvements in Sealing and Material Science
- Growing Investments in Off-Highway Electrification
- Price Volatility of Raw Materials
For complete list of drivers and restraints, kindly check the Table Of Contents.
Segment Analysis
Hydraulic solutions accounted for 60.92% of 2025 revenue, underpinning the largest slice of the fluid power equipment market share thanks to unmatched power density in excavators, presses and drilling rigs. Vendors are pairing variable-displacement pumps with digital controllers, improving metering accuracy and lowering fuel burn. Pneumatics, although smaller, is set to register a 4.69% CAGR to 2031 on the strength of lightweight end-effectors in electronics assembly and life-science packaging. The fluid power equipment market size expansion in pneumatics is further supported by smart sensors that transmit cycle counts and leak-rate alerts to edge gateways. Hybrid architectures are also emerging: low-flow pneumatics handles positioning, while hydraulics delivers peak force, creating incremental revenue opportunities across both lines.
Continuous R&D in high-switch-frequency digital valves is narrowing performance gaps between the two technologies. Field tests show discrete-flow hydraulic circuits trimming energy losses 20 % relative to proportional control, an upgrade gaining favor in material-handling forklifts. On the pneumatic side, vacuum-ejector designs with integrated pressure feedback now reduce compressed-air consumption up to 50 %, cutting factory operating costs. Together these advances keep the fluid power equipment market on a modernization trajectory that balances traditional strengths with digital agility.
Pumps represented 27.12% of 2025 sales, affirming their role as the heart of every circuit and a cornerstone of the broader fluid power equipment market. Demand spans utility water management, steel mills and forestry harvesters. Electronic pressure compensation, bi-directional telematics and condition-monitoring probes all raise pump bill-of-materials content, enlarging supplier value capture. In contrast, accumulators and filters, while smaller today, are forecast to grow 5.52% annually to 2031. Their surge stems from energy-recovery mandates and stricter contamination codes in semiconductor fabs and food plants, respectively.
Filters are shifting toward high-separation microglass media that deliver lower differential pressure, prolonging element life and reducing motor load. Accumulator designs now incorporate bladder materials rated for 20,000 charge cycles, meeting duty profiles of hybrid cranes and agricultural sprayers. Margins in these categories trend above corporate averages, reinforcing why vendors allocate R&D aimed at total-system optimization and lifecycle monitoring. The mix shift positions the fluid power equipment market size for better profitability even as headline growth remains moderate.
Complete Report Scope:
- By Technology
- Hydraulic Equipment
- Pneumatic Equipment
- By Product Type
- Pumps
- Motors
- Valves
- Cylinders
- Accumulators and Filters
- By End-User Industry
- Construction
- Agriculture
- Material Handling and Logistics
- Oil and Gas
- Aerospace and Defense
- Machine Tools
- Food Processing and Packaging
- Other End-User Industries
- By Distribution Channel
- OEM
- Aftermarket
- By Geography
- North America
- United States
- Canada
- Mexico
- South America
- Brazil
- Argentina
- Rest of South America
- Europe
- Germany
- France
- United Kingdom
- Italy
- Spain
- Russia
- Rest of Europe
- Asia Pacific
- China
- Japan
- India
- South Korea
- Australia and New Zealand
- Southeast Asia
- Rest of Asia Pacific
- Middle East
- Saudi Arabia
- United Arab Emirates
- Turkey
- Rest of Middle East
- Africa
- South Africa
- Egypt
- Rest of Africa
- North America
Geography Analysis
Asia Pacific accounted for a leading 34.10% of 2025 turnover, anchored by China's electronics clusters, India's highway build-out and Southeast Asia's packaging export hubs. Regional governments continue to promote industrial automation grants that favor both hydraulic presses and pneumatic pick-and-place systems, supporting consistent growth in the fluid power equipment market. China's accelerated shift to electric vehicles is stimulating demand for battery manufacturing conveyors and cooling pumps. India's Production-Linked Incentive schemes for mobile phone assembly call for dozens of new clean-room facilities, each equipped with hydrogen-tolerant pneumatic valves, further lifting volumes.
The Middle East is the fastest-growing territory, projected at a 5.44% CAGR through 2031. Saudi Arabia's Vision 2030 and the UAE's Operation 300 Bn strategies funnel investment into solar desalination, green hydrogen electrolysers and advanced logistics, all reliant on robust fluid power control. Harsh ambient temperatures demand specialty seals and high-thermal-stability fluids, creating premium niches for global component vendors. Turkey, acting as a bridge to European supply chains, is expanding automotive stamping capacity that employs high-tonnage hydraulic presses, propelling incremental orders.
North America and Europe display slower near-term momentum due to softer capital expenditure, yet they remain vital innovation hubs for the fluid power equipment market. Parker Hannifin's North American industrial sales slipped, but aerospace aftermarket demand and medical equipment orders offset part of the decline. The European transition to Tier 5 off-road standards is sparking retrofits of hydraulic excavators and agricultural sprayers with low-emission pumps, counterbalancing weaker new-machine builds. These mature regions will likely regain traction once macro uncertainty eases, aided by legislated energy-efficiency upgrades across brownfield factories.
- Bosch Rexroth AG
- Parker-Hannifin Corporation
- Danfoss A/S
- SMC Corporation
- Eaton Corporation plc
- Festo SE and Co. KG
- Kawasaki Heavy Industries Ltd.
- Hydac Verwaltungs GmbH
- HydraForce Inc.
- Emerson Electric Co.
- IMI plc (IMI Precision Engineering)
- Ingersoll Rand Inc.
- Flowserve Corporation
- Nachi-Fujikoshi Corp.
- Argo-Hytos Group AG
- Bucher Industries AG (Bucher Hydraulics)
- Camozzi Automation SpA
- Norgren Limited
Additional Benefits:
- The market estimate (ME) sheet in Excel format
- 3 months of analyst support
TABLE OF CONTENTS
1 INTRODUCTION
- 1.1 Study Assumptions and Market Definition
- 1.2 Scope of the Study
2 RESEARCH METHODOLOGY
3 EXECUTIVE SUMMARY
4 MARKET LANDSCAPE
- 4.1 Market Overview
- 4.2 Market Drivers
- 4.2.1 Energy Efficiency and Environmental Considerations
- 4.2.2 Advances in Industrial Automation
- 4.2.3 Technical Improvements in Sealing and Material Science
- 4.2.4 Growing Investments in Off-Highway Electrification
- 4.2.5 Rising Demand from Smart Manufacturing Facilities
- 4.2.6 Hydrogen-Ready Pneumatics for Clean-Room Operations
- 4.3 Market Restraints
- 4.3.1 Cyclical Capital Expenditure in Heavy Industries
- 4.3.2 Price Volatility of Raw Materials
- 4.3.3 Leakage-Driven Energy Losses in Hydraulic Systems
- 4.3.4 Supply Chain Fragmentation for Precision Components
- 4.4 Industry Ecosystem Analysis
- 4.5 Regulatory Landscape
- 4.6 Technological Outlook
- 4.7 Porter's Five Forces Analysis
- 4.7.1 Threat of New Entrants
- 4.7.2 Bargaining Power of Suppliers
- 4.7.3 Bargaining Power of Buyers
- 4.7.4 Threat of Substitutes
- 4.7.5 Industry Rivalry
- 4.8 Impact of Macroeconomic Factors
5 MARKET SIZE AND GROWTH FORECASTS (VALUE)
- 5.1 By Technology
- 5.1.1 Hydraulic Equipment
- 5.1.2 Pneumatic Equipment
- 5.2 By Product Type
- 5.2.1 Pumps
- 5.2.2 Motors
- 5.2.3 Valves
- 5.2.4 Cylinders
- 5.2.5 Accumulators and Filters
- 5.3 By End-User Industry
- 5.3.1 Construction
- 5.3.2 Agriculture
- 5.3.3 Material Handling and Logistics
- 5.3.4 Oil and Gas
- 5.3.5 Aerospace and Defense
- 5.3.6 Machine Tools
- 5.3.7 Food Processing and Packaging
- 5.3.8 Other End-User Industries
- 5.4 By Distribution Channel
- 5.4.1 OEM
- 5.4.2 Aftermarket
- 5.5 By Geography
- 5.5.1 North America
- 5.5.1.1 United States
- 5.5.1.2 Canada
- 5.5.1.3 Mexico
- 5.5.2 South America
- 5.5.2.1 Brazil
- 5.5.2.2 Argentina
- 5.5.2.3 Rest of South America
- 5.5.3 Europe
- 5.5.3.1 Germany
- 5.5.3.2 France
- 5.5.3.3 United Kingdom
- 5.5.3.4 Italy
- 5.5.3.5 Spain
- 5.5.3.6 Russia
- 5.5.3.7 Rest of Europe
- 5.5.4 Asia Pacific
- 5.5.4.1 China
- 5.5.4.2 Japan
- 5.5.4.3 India
- 5.5.4.4 South Korea
- 5.5.4.5 Australia and New Zealand
- 5.5.4.6 Southeast Asia
- 5.5.4.7 Rest of Asia Pacific
- 5.5.5 Middle East
- 5.5.5.1 Saudi Arabia
- 5.5.5.2 United Arab Emirates
- 5.5.5.3 Turkey
- 5.5.5.4 Rest of Middle East
- 5.5.6 Africa
- 5.5.6.1 South Africa
- 5.5.6.2 Egypt
- 5.5.6.3 Rest of Africa
- 5.5.1 North America
6 COMPETITIVE LANDSCAPE
- 6.1 Market Concentration
- 6.2 Strategic Moves
- 6.3 Market Share Analysis
- 6.4 Company Profiles (Includes Global Level Overview, Market Level Overview, Core Segments, Financials as Available, Strategic Information, Market Rank/Share for Key Companies, Products and Services, and Recent Developments)
- 6.4.1 Bosch Rexroth AG
- 6.4.2 Parker-Hannifin Corporation
- 6.4.3 Danfoss A/S
- 6.4.4 SMC Corporation
- 6.4.5 Eaton Corporation plc
- 6.4.6 Festo SE and Co. KG
- 6.4.7 Kawasaki Heavy Industries Ltd.
- 6.4.8 Hydac Verwaltungs GmbH
- 6.4.9 HydraForce Inc.
- 6.4.10 Emerson Electric Co.
- 6.4.11 IMI plc (IMI Precision Engineering)
- 6.4.12 Ingersoll Rand Inc.
- 6.4.13 Flowserve Corporation
- 6.4.14 Nachi-Fujikoshi Corp.
- 6.4.15 Argo-Hytos Group AG
- 6.4.16 Bucher Industries AG (Bucher Hydraulics)
- 6.4.17 Camozzi Automation SpA
- 6.4.18 Norgren Limited
7 MARKET OPPORTUNITIES AND FUTURE OUTLOOK
- 7.1 White-Space and Unmet-Need Assessment


