
|
시장보고서
상품코드
2124714
가상 이벤트 : 시장 점유율 분석, 업계 동향과 통계, 성장 예측(2026-2031년)Virtual Events - Market Share Analysis, Industry Trends & Statistics, Growth Forecasts (2026 - 2031) |
||||||
 Mordor Intelligence
Mordor Intelligence에 의하면, 가상 이벤트 시장 규모는 2026년에 166억 1,000만 달러에 이르고, 2031년까지 276억 5,000만 달러에 달할 것으로 예측되며, 예측 기간중 CAGR 10.72%를 기록할 전망입니다.
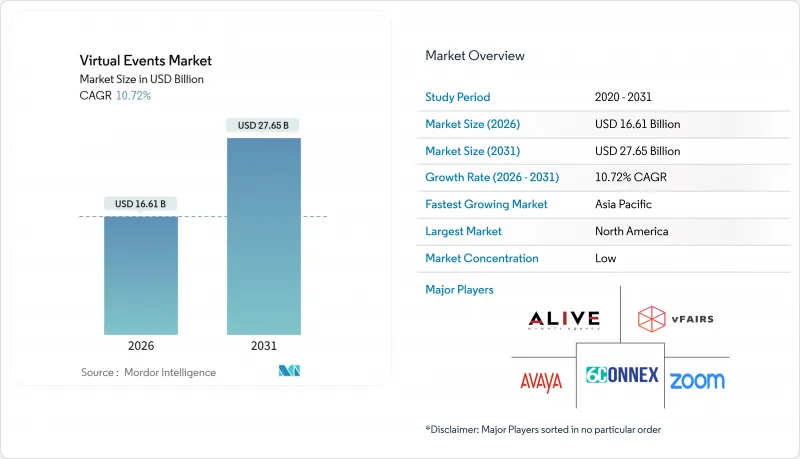
본 보고서는 플랫폼(웹 기반 플랫폼, XR 플랫폼 등), 서비스 유형(커뮤니케이션 서비스, 채용·네트워킹 등), 용도(회의·정상회담 등), 이벤트 유형(웨비나 등), 최종 사용자 산업(교육 기관 등), 수익원(스폰서십 등) 및 지역별로 분류되어 있습니다. 시장 전망은 금액(달러) 기준으로 제시됩니다.
세계 가상 이벤트 시장 동향 및 인사이트
통합 커뮤니케이션 서비스(UCaaS) 및 클라우드 기반 협업 플랫폼의 급속한 보급
UCaaS(Unified Communications as a Service) 번들로 전환을 추진하는 기업들은 음성, 채팅, 화이트보드 도구 외에도 이벤트 스트리밍 기능이 표준으로 탑재되기를 점점 더 기대하고 있으며, 이를 통해 개별 웨비나 라이선스를 줄이고 평가 주기를 단축하고 있습니다. Microsoft Teams, Zoom Workplace, Cisco Webex 등 각사는 추가 조달 없이 사내 타운홀 미팅을 개최하는 월간 활성 사용자 수가 3자리 수 성장을 기록하고 있으며, 경쟁상의 차별화 요소는 API의 충실도나 타사 도구와의 연동으로 이동하고 있습니다. 클라우드 네이티브 도입으로 서버 용량의 병목 현상이 해소되어, 이벤트 관리자는 몇 시간 만에 등록 포털을 확장할 수 있게 되었습니다. 그 결과, 한계 비용이 감소함에 따라 사내의 빈번한 브리핑이나 대외적인 제품 발표회가 촉진되고, 점점 더 광범위한 기업 활동에서 디지털 형식이 정착되고 있습니다. 이러한 동향에 따라 가상 이벤트 시장의 잠재 고객 기반이 확대되고 있습니다.
전 세계적인 원격 및 하이브리드 근무 모델의 확산
공공 부문의 노동 데이터에 따르면, 미국에서는 재택근무가 취업 인구의 약 4분의 1에서 정착되고 있으며, 대륙을 아우르는 조사에서도 유럽과 아시아태평양에서 유사한 추세가 지속되고 있는 것으로 밝혀졌습니다. 분산된 인력으로 인해 시간대 차이가 증가하고 탄소 배출 보고의 책임 범위도 확대됨에 따라, 분기별 킥오프나 파트너 브리핑에서는 브라우저 기반의 모임이 기본 솔루션으로 자리 잡고 있습니다. 주최측은 현재 비동기 재생, 모듈식 트랙, 온디맨드 라이브러리를 중심으로 의제를 설계하고 있으며, 참가자들이 일률적으로 같은 시간대에 참여해야 했던 팬데믹 이전의 관행을 뒤집고 있습니다. 기업들이 유연한 근무 방식을 인재 전략에 반영함에 따라, 가상 이벤트 시장에는 안정적인 수요가 유입되고 있습니다.
대규모 온라인 이벤트에서의 데이터 보안 및 개인정보 보호에 대한 우려
규제 당국은 참가자 데이터에 대한 감시를 강화하고 있으며, 저장된 데이터의 암호화, 역할 기반 접근 제어, 그리고 상세한 감사 로그 도입을 의무화하고 있습니다. 의료, 금융 서비스, 정부 기관에서는 플랫폼과의 계약을 승인하기 전에 ISO 27001 또는 SOC 2 인증을 요구하고 있어, 이로 인해 판매 주기가 길어지고 있습니다. XR 환경에서는 시선 추적, 공간적 움직임, 생체 인식 단서를 통해 개인의 속성이 드러날 가능성이 있으므로 기밀성이 더욱 높아지고, 새로운 규정 준수 점검 사항이 발생하고 있습니다. 전담 개인정보 보호 담당자를 둘 수 없는 소규모 단체는 가상 환경으로의 전환을 미루는 경우가 많아, 그 결과 가상 이벤트 시장의 단기 규모가 축소되고 있습니다.
부문 분석
2025년, 웹 기반 솔루션은 가상 이벤트 시장 점유율의 48.43%를 차지할 것으로 예상되며, 이는 HTML5 및 WebRTC가 기업의 방화벽 내부에서도 원활한 로그인 경험을 실현하고 있음을 뒷받침합니다. 기업들은 설치 없이 접속할 수 있는 점, 자동 확장성, 그리고 간편한 규정 준수 감사를 중요하게 여기고 있습니다. 브라우저가 주류를 이루고 있어 진입 비용을 낮게 유지할 수 있으며, 빈번한 사내 업데이트나 외부 웨비나 개최가 촉진되어 가상 이벤트 시장 전체의 규모를 확대시키고 있습니다. 한편, 몰입형 XR 행사장은 통합 장벽을 낮추는 멀티 벤더 헤드셋 표준의 후원을 받아 2031년까지 연평균 성장률(CAGR) 11.64%로 성장할 것으로 전망됩니다. 자동차 디자인 워크스루, 외과 수술 시뮬레이션, 고급 부동산 투어 등에서는 이미 공간적 몰입감을 통한 체험 향상이 입증되었습니다. 헤드셋 가격과 사용자 편의성은 여전히 과제로 남아 있지만, 제조, 의료, 교육 분야의 얼리 어답터들이 더 광범위한 보급의 길을 뒷받침하고 있습니다.
브라우저와 XR 플랫폼의 상호작용은 공생 관계에 있습니다. 브라우저 기반 로비에서는 고부가가치 세션을 옵션인 헤드셋 환경으로 유도하는 사례가 증가하고 있으며, 접근성과 몰입감을 융합하고 있습니다. 클라우드 오케스트레이션을 통해 주최자는 2D와 3D 스트림을 병행하여 전개할 수 있으며, 고도의 상호작용성을 시도하면서도 시청자에 대한 도달 범위를 유지할 수 있습니다. 포토리얼리스틱 아바타, 제스처 인식, 공간 오디오에 대한 벤처 투자가 잇따르는 가운데, 가상 이벤트 시장은 선택의 폭을 넓히고 있으며, XR은 이분법적인 대안이 아닌 부가적인 레이어로 자리매김하고 있습니다.
2025년에는 커뮤니케이션 서비스가 매출의 38.64%를 차지하며, 모든 웨비나, 타운홀 미팅, 교육 모듈의 기반이 될 것입니다. UCaaS 계약의 번들화를 통해 추가 비용이 절감되는 한편, 채팅,투표, Q&A를 통해 수집된 데이터는 보다 광범위한 분석 스택에 활용되어 플랫폼에 대한 사용자 충성도를 높이고 있습니다. 마케팅 및 프로모션 서비스는 연평균 11.98%의 복합 성장률로 확대될 것으로 예상되며, 이는 기존의 전시회에서 클릭 수나 체류 시간을 정량적으로 측정할 수 있는 스폰서 지원 가상 부스로의 전환을 반영합니다. 브라우저 쿠키가 단계적으로 폐지됨에 따라, 등록 양식을 통해 수집되는 퍼스트 파티 데이터의 가치는 더욱 높아져, 브랜드가 자체 고객층을 구축하고 리드 스코어링 모델을 정교화할 수 있게 해줍니다. 기능이 강화된 대시보드를 통해 자산 다운로드 수, 부스 방문 수, 미팅 요청이 실시간으로 시각화되어 스폰서십 패키지의 가치가 높아지고, 가상 이벤트 시장 전체의 규모가 확대되고 있습니다.
현재, 부서 간 협업 팀이 행사 전 이메일 캠페인, 플랫폼 내 퀴즈, 행사 후 육성 트랙을 결합한 캠페인을 공동으로 설계하고 있으며, 마케팅 자동화, CRM, 분석 API를 연동하고 있습니다. 화이트 라벨을 통한 맞춤화를 통해 스폰서는 로비,슬라이드 자료, 세션 재생 허브에 자사의 시각적 정체성을 반영하여 브랜드 인지도를 높일 수 있습니다. 데이터 기반의 인사이트와 측정 가능한 ROI가 만들어내는 선순환 덕분에, 광고주의 예산은 계속해서 디지털 플로어 플랜으로 유입되며 가상 이벤트 시장의 성장을 가속화하고 있습니다.
지역별 분석
북미는 견고한 광대역 환경, 높은 소프트웨어 예산, 그리고 탄탄한 벤더 생태계의 뒷받침을 받아 2025년 가상 이벤트 시장 점유율의 40.12%를 차지했습니다. 미국 기업들은 이벤트 모듈을 협업 스위트에 빠르게 통합하고 있는 반면, 캐나다의 금융 부문은 규정 준수를 준수하는 클라우드 호스팅을 활용하고 있습니다. 멕시코에서는 콜센터 확장이 교육 수요 증가를 견인하고 있습니다. 아시아태평양은 두 번째 성장 거점으로 부상하고 있으며, 19억 건의 5G 연결이 저지연 스트리밍을 실현함으로써 연평균 12.45%의 복합 성장률이 예상됩니다. 인도에서 한국에 이르는 각국 정부가 디지털 서비스 로드맵에 자금을 지원하며 클라우드 보급을 뒷받침하고 있습니다. 다양한 언어 환경과 중소기업(SME)의 디지털화 진전이 AI 자막 및 모바일 우선 앱 수요를 견인하며, 가상 이벤트 시장의 확대에 기여하고 있습니다.
GDPR(EU 개인정보보호규정)에 의해 규정된 유럽의 규제 환경에서는 암호화와 소버린 클라우드 옵션이 우선시되고 있으며, 견고한 데이터 보호 실적을 갖춘 플랫폼에 대한 조달이 진행되고 있습니다. 다국어 회의가 표준화됨에 따라 AI 번역 모듈의 중요성이 높아지고 있습니다. 독일과 프랑스에서는 자동차 및 제약 분야 정상회의가 빈번하게 개최되는 반면, 영국의 핀테크 클러스터에서는 웨비나가 정기적으로 열리고 있습니다. 남미는 다른 지역에 비해 뒤처져 있지만, 브라질이 광대역 구축을 가속화하고 아르헨티나의 수출 지향 기술 허브가 온라인을 통해 해외 투자자를 유치하고 있어 성장세를 보이고 있습니다. 개발은행의 지원 프로그램을 통해 가상 시민 포럼에 보조금이 투입되면서 공공 부문에서의 도입이 정착되고 있습니다.
중동 및 아프리카은 여전히 상황이 제각각입니다. 사우디아라비아와 아랍에미리트는 국가 디지털 전략에 따라 하이퍼스케일 데이터센터에 자금을 지원하며, 기업의 도입을 뒷받침하고 있습니다. 아프리카 시장은 대역폭 병목 현상에 직면해 있지만, 모바일 인터넷을 통해 많은 사용자가 낮은 비트레이트의 스트리밍으로 참여하고 있어, 벤더들은 코덱 및 오프라인 동기화형 앱의 최적화를 추진하고 있습니다. 남아프리카공화국과 나이지리아는 각각 광업 및 핀테크 분야에서 하이브리드형 박람회의 시범 운영을 진행 중이며, 이는 이 지역의 가상 이벤트 시장이 상승세를 보이고 있음을 보여줍니다.
기타 혜택:
- 엑셀 형식 시장 예측(ME) 시트
- 3개월간의 애널리스트 지원
자주 묻는 질문
목차
제1장 서론
제2장 조사 방법
제3장 주요 요약
제4장 시장 구도
제5장 시장 규모와 성장 예측
제6장 경쟁 구도
제7장 시장 기회와 향후 전망
LSH 26.09.14According to Mordor Intelligence, the virtual events market size stood at USD 16.61 billion in 2026 and is projected to reach USD 27.65 billion by 2031, advancing at a 10.72% CAGR during the forecast period.
This report is Segmented by Platform (Web-Based Platform, XR Platform, and More), Service Type (Communication Services, Recruitment and Networking, and More), Application (Conferences and Summits, and More), Event Type (Webinar, and More), End-User Industry (Educational Institutions, and More), Revenue Source (Sponsorship, and More), and Geography. The Market Forecasts are Provided in Terms of Value (USD).
Global Virtual Events Market Trends and Insights
Rapid Adoption of Unified Communications as a Service and Cloud-Based Collaboration Platforms
Enterprises migrating toward UCaaS bundles increasingly expect event-broadcast functions to sit beside voice, chat, and whiteboard tools, trimming separate webinar licenses and slashing evaluation cycles. Microsoft Teams, Zoom Workplace, and Cisco Webex each report triple-digit growth in monthly active users who launch company town halls without incremental procurement, refocusing competitive differentiation on API depth and third-party integrations. Cloud-native deployment removes server-capacity bottlenecks, letting event managers scale registration portals in hours. The resulting low marginal cost encourages frequent internal briefings and externally facing product showcases, normalizing digital formats for a broadening set of corporate rituals. These dynamics expand the addressable base for the virtual events market.
Expansion of Remote and Hybrid Work Models Globally
Public-sector labor data show telework stabilizing near one-quarter of the employed population in the United States, while cross-continent studies highlight similar persistence in Europe and Asia-Pacific. Distributed workforces multiply time-zone conflicts and widen carbon-reporting liabilities, making browser-based gatherings the default solution for quarterly kickoffs and partner briefings. Organizers now design agendas around asynchronous replay, modular tracks, and on-demand libraries, reversing pre-pandemic conventions that assumed uniform attendance windows. As companies integrate flexible work into talent strategies, consistent demand streams into the virtual events market.
Data Security and Privacy Concerns in Large-Scale Online Events
Regulators are sharpening scrutiny of attendee data, compelling encryption at rest, role-based access controls, and granular audit logs. Healthcare, financial services, and government agencies demand ISO 27001 or SOC 2 attestations before green-lighting platform contracts, stretching sales cycles. XR environments amplify sensitivity because eye-tracking, spatial movement, and biometric cues can reveal personal attributes, triggering new compliance checkpoints. Smaller associations lacking dedicated privacy officers often postpone virtual expansions, trimming near-term volumes in the virtual events market.
Other drivers and restraints analyzed in the detailed report include:
- Integration of Generative AI for Real-Time Translation and Content Personalization
- Carbon-Neutral Event Mandates Embedded in Fortune 500 ESG Strategies
- Limited Audience Engagement and Networking Fatigue
For complete list of drivers and restraints, kindly check the Table Of Contents.
Segment Analysis
Web-based solutions claimed 48.43% of the virtual events market share in 2025, underscoring how HTML5 and WebRTC deliver frictionless log-on experiences inside corporate firewalls. Enterprises value zero-install access, automatic scaling, and straightforward compliance audits. The dominance of browsers keeps entry costs low, inviting frequent internal updates and external webinars that expand the overall virtual events market size. Yet immersive XR venues are set to grow at an 11.64% CAGR to 2031, powered by multi-vendor headset standards that shrink integration hurdles. Automotive design walk-throughs, surgical simulations, and luxury real-estate tours already showcase the experiential lift of spatial presence. Although headset prices and user comfort remain hurdles, early adopters in manufacturing, healthcare, and education validate the pathway for broader adoption.
The interplay between browser and XR platforms is symbiotic. Browser-based lobbies increasingly route high-value sessions to optional headset environments, melding accessibility with immersion. Cloud orchestration lets organizers spin up parallel 2D and 3D streams, preserving audience reach while experimenting with advanced interactivity. As venture investment pours into photorealistic avatars, gesture recognition, and spatial audio, the virtual events market gains optionality, positioning XR as an additive layer rather than a binary substitute.
Communication services accounted for 38.64% of revenue in 2025, serving as the backbone of every webinar, town hall, and training module. Bundling UCaaS contracts compresses incremental spend, while data gathered through chats, polls, and Q&A feeds broader analytics stacks, reinforcing platform stickiness. Marketing and promotion services are forecast to compound at 11.98% annually, mirroring a shift from traditional trade shows to sponsored virtual booths that quantify every click and dwell. First-party data captured through gated registration forms becomes even more valuable as browser cookies are phased out, enabling brands to build owned audiences and refine lead-scoring models. Enhanced dashboards visualize asset downloads, booth traffic, and meeting requests in real time, elevating sponsorship packages and boosting the overall size of the virtual events market.
Cross-functional teams now co-design campaigns that weave pre-event email journeys with in-platform quizzes and post-event nurture tracks, linking marketing automation, CRM, and analytics APIs. White-label customization lets sponsors overlay visual identities on lobbies, slide decks, and session replay hubs, amplifying brand recall. The virtuous loop of data-driven insights and measurable ROI keeps advertiser budgets flowing toward digital floor plans, accelerating growth inside the virtual events market.
Complete Report Scope:
- By Platform
- Web-Based Platform
- XR Platform
- Cloud Deployment
- On-Premise Deployment
- By Service Type
- Communication Services
- Recruitment and Networking
- Marketing and Promotion
- Training and Education
- By Application
- Conferences and Summits
- Exhibitions / Trade Shows
- Product Launches
- Other Applications
- By Event Type
- Webinar
- Virtual Expo / Fairs / Festivals
- Entertainment and Festivals
- Corporate Meetings
- Other Event Types
- By End-User Industry
- Educational Institutions
- Corporate Enterprises
- Government and Public Sector
- Other End-User Industries
- By Revenue Source
- Sponsorship
- Ticket Sale
- Other Revenue Sources
- By Geography
- North America
- United States
- Canada
- Mexico
- South America
- Brazil
- Argentina
- Rest of South America
- Europe
- Germany
- France
- United Kingdom
- Italy
- Spain
- Rest of Europe
- Asia-Pacific
- China
- Japan
- India
- South Korea
- Australia
- Rest of Asia-Pacific
- Middle East and Africa
- Middle East
- Saudi Arabia
- United Arab Emirates
- Turkey
- Rest of Middle East
- Africa
- South Africa
- Egypt
- Nigeria
- Rest of Africa
- Middle East
- North America
Geography Analysis
North America wielded 40.12% of virtual events market share in 2025, backed by robust broadband, high software budgets, and a dense vendor ecosystem. U.S. enterprises rapidly bundle event modules into collaboration suites, while Canada's financial sector leans on compliant cloud hosting. Mexico's call-center expansion fuels incremental training demand. A second growth pole emerges in Asia-Pacific, projected to compound at 12.45% annually as 1.9 billion 5G connections unlock low-latency streaming. Governments from India to South Korea bankroll digital-service roadmaps, reinforcing cloud uptake. Diverse language landscapes and rising SME digitalization drive demand for AI subtitles and mobile-first apps, widening the virtual events market.
Europe's regulatory environment, defined by GDPR, prioritizes encryption and sovereign-cloud options, steering procurement toward platforms with robust data-protection pedigrees. Multilingual conference norms elevate AI translation modules. Germany and France host frequent automotive and pharmaceutical summits, while the United Kingdom's fintech clusters generate steady webinar cadences. South America trails but shows momentum as Brazil accelerates broadband rollout and Argentina's export tech hubs court foreign investors online. Development-bank schemes channel grants into virtual civic forums, anchoring public-sector uptake.
The Middle East and Africa remain heterogeneous. Saudi Arabia and the United Arab Emirates fund hyperscale data centers under national digital blueprints, spurring enterprise adoption. African markets face bandwidth bottlenecks, yet mobile internet leads many users to engage via low-bitrate streams, prompting vendors to optimize codecs and offline-synced apps. South Africa and Nigeria pilot hybrid trade shows for mining and fintech, respectively, signaling an upward curve for the regional virtual events market.
- 6Connex Inc.
- Alive Events Agency Pty Ltd
- Zoom Video Communications Inc.
- Avaya LLC
- vFairs LLC
- ALE International SAS
- NTT DATA Corporation
- Cisco Systems Inc.
- Cvent Holding Corp.
- EventX Limited
- George P. Johnson Experience Marketing Inc.
- Airmeet Inc.
- Microsoft Corporation
- ON24 Inc.
- Hopin Ltd.
- Accelevents Inc.
- BigMarker Holdings Inc.
- Stova Inc.
- Hubilo Technologies Inc.
- Bizzabo Ltd.
Additional Benefits:
- The market estimate (ME) sheet in Excel format
- 3 months of analyst support
TABLE OF CONTENTS
1 INTRODUCTION
- 1.1 Study Assumptions and Market Definition
- 1.2 Scope of the Study
2 RESEARCH METHODOLOGY
3 EXECUTIVE SUMMARY
4 MARKET LANDSCAPE
- 4.1 Market Overview
- 4.2 Industry Supply-Chain Analysis
- 4.3 Market Drivers
- 4.3.1 Rapid Adoption of Unified Communications as a Service (UCaaS) and Cloud-Based Collaboration Platforms
- 4.3.2 Expansion of Remote and Hybrid Work Models Globally
- 4.3.3 Cost Savings and Extended Reach Versus Physical Events
- 4.3.4 Growing Acceptance of Immersive VR and XR Experiences for Audience Engagement
- 4.3.5 Integration of Generative AI for Real-Time Translation and Content Personalization
- 4.3.6 Carbon-Neutral Event Mandates Driving Virtual Format Adoption in Fortune 500 ESG Strategies
- 4.4 Market Restraints
- 4.4.1 Data Security and Privacy Concerns in Large-Scale Online Events
- 4.4.2 Limited Audience Engagement and Networking Fatigue
- 4.4.3 Rising Platform Saturation Leading to Vendor Lock-In Risk for Enterprises
- 4.4.4 Inconsistent Cross-Border Virtual Event Taxation and Compliance Requirements
- 4.5 Impact of Macroeconomic Factors on the Market
- 4.6 Regulatory Landscape
- 4.7 Technological Outlook
- 4.8 Porter's Five Forces Analysis
- 4.8.1 Bargaining Power of Suppliers
- 4.8.2 Bargaining Power of Consumers
- 4.8.3 Threat of New Entrants
- 4.8.4 Threat of Substitute Products
- 4.8.5 Intensity of Competitive Rivalry
5 MARKET SIZE AND GROWTH FORECASTS (VALUE)
- 5.1 By Platform
- 5.1.1 Web-Based Platform
- 5.1.2 XR Platform
- 5.1.3 Cloud Deployment
- 5.1.4 On-Premise Deployment
- 5.2 By Service Type
- 5.2.1 Communication Services
- 5.2.2 Recruitment and Networking
- 5.2.3 Marketing and Promotion
- 5.2.4 Training and Education
- 5.3 By Application
- 5.3.1 Conferences and Summits
- 5.3.2 Exhibitions / Trade Shows
- 5.3.3 Product Launches
- 5.3.4 Other Applications
- 5.4 By Event Type
- 5.4.1 Webinar
- 5.4.2 Virtual Expo / Fairs / Festivals
- 5.4.3 Entertainment and Festivals
- 5.4.4 Corporate Meetings
- 5.4.5 Other Event Types
- 5.5 By End-User Industry
- 5.5.1 Educational Institutions
- 5.5.2 Corporate Enterprises
- 5.5.3 Government and Public Sector
- 5.5.4 Other End-User Industries
- 5.6 By Revenue Source
- 5.6.1 Sponsorship
- 5.6.2 Ticket Sale
- 5.6.3 Other Revenue Sources
- 5.7 By Geography
- 5.7.1 North America
- 5.7.1.1 United States
- 5.7.1.2 Canada
- 5.7.1.3 Mexico
- 5.7.2 South America
- 5.7.2.1 Brazil
- 5.7.2.2 Argentina
- 5.7.2.3 Rest of South America
- 5.7.3 Europe
- 5.7.3.1 Germany
- 5.7.3.2 France
- 5.7.3.3 United Kingdom
- 5.7.3.4 Italy
- 5.7.3.5 Spain
- 5.7.3.6 Rest of Europe
- 5.7.4 Asia-Pacific
- 5.7.4.1 China
- 5.7.4.2 Japan
- 5.7.4.3 India
- 5.7.4.4 South Korea
- 5.7.4.5 Australia
- 5.7.4.6 Rest of Asia-Pacific
- 5.7.5 Middle East and Africa
- 5.7.5.1 Middle East
- 5.7.5.1.1 Saudi Arabia
- 5.7.5.1.2 United Arab Emirates
- 5.7.5.1.3 Turkey
- 5.7.5.1.4 Rest of Middle East
- 5.7.5.2 Africa
- 5.7.5.2.1 South Africa
- 5.7.5.2.2 Egypt
- 5.7.5.2.3 Nigeria
- 5.7.5.2.4 Rest of Africa
- 5.7.5.1 Middle East
- 5.7.1 North America
6 COMPETITIVE LANDSCAPE
- 6.1 Market Concentration
- 6.2 Strategic Moves
- 6.3 Market Share Analysis
- 6.4 Company Profiles (includes Global level Overview, Market level overview, Core Segments, Financials as available, Strategic Information, Market Rank/Share for key companies, Products and Services, and Recent Developments)
- 6.4.1 6Connex Inc.
- 6.4.2 Alive Events Agency Pty Ltd
- 6.4.3 Zoom Video Communications Inc.
- 6.4.4 Avaya LLC
- 6.4.5 vFairs LLC
- 6.4.6 ALE International SAS
- 6.4.7 NTT DATA Corporation
- 6.4.8 Cisco Systems Inc.
- 6.4.9 Cvent Holding Corp.
- 6.4.10 EventX Limited
- 6.4.11 George P. Johnson Experience Marketing Inc.
- 6.4.12 Airmeet Inc.
- 6.4.13 Microsoft Corporation
- 6.4.14 ON24 Inc.
- 6.4.15 Hopin Ltd.
- 6.4.16 Accelevents Inc.
- 6.4.17 BigMarker Holdings Inc.
- 6.4.18 Stova Inc.
- 6.4.19 Hubilo Technologies Inc.
- 6.4.20 Bizzabo Ltd.
7 MARKET OPPORTUNITIES AND FUTURE OUTLOOK
- 7.1 White-Space and Unmet-Need Assessment