|
시장보고서
상품코드
2124717
멀티탭 : 시장 점유율 분석, 업계 동향과 통계, 성장 예측(2026-2031년)Power Strip - Market Share Analysis, Industry Trends & Statistics, Growth Forecasts (2026 - 2031) |
||||||
 Mordor Intelligence
Mordor Intelligence에 의하면, 멀티탭 시장 규모는 2025년 140억 1,000만 달러에서 2026년에는 149억 9,000만 달러에 이르고, 2026-2031년 CAGR 6.98%로 성장을 지속하여 2031년까지 210억 2,000만 달러에 달할 것으로 예측됩니다.
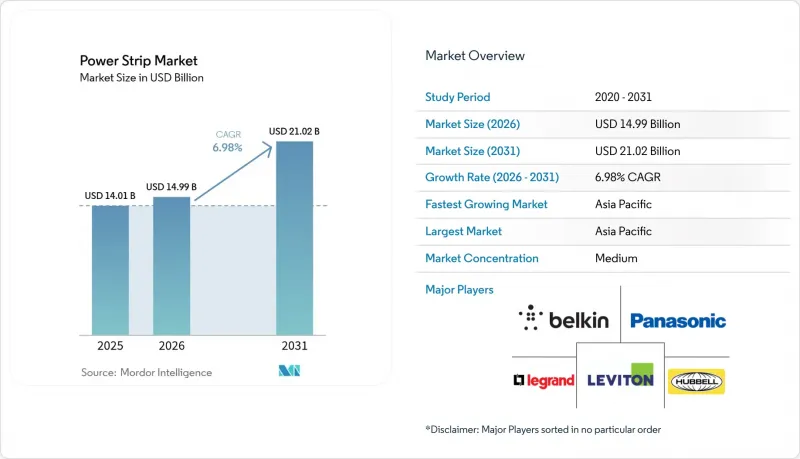
본 보고서는 설치 유형(가구용 배전 장치(FPDU), 멀티 콘센트 어셈블리 등), 보호 기능(서지 보호, 과부하 보호 등),용도(범용/일반 용도, 특수 보호 등), 최종 사용자(산업 제조 시설, 데이터센터 및 IT 룸 등), 판매 채널(오프라인 및 온라인), 지역별로 분류되어 있습니다.
전 세계 멀티탭 시장 동향 및 인사이트
가정 내 전자기기 보급
미국에서는 1가구당 평균 연결 기기 수가 25대를 넘어, 기존의 콘센트 구성으로는 감당하기 어려워지면서 서지 보호 기능이 내장된 멀티 소켓 솔루션에 대한 수요가 증가하고 있습니다. 뉴욕주의 조사에 따르면, 고급 기능을 갖춘 스마트 멀티탭은 대기 전력 손실을 억제함으로써 가구당 연간 106.1kWh 및 78.81달러를 절약할 수 있는 것으로 나타났습니다. 따라서, 특히 에너지 규제에 따라 대기 전력 소비가 적극적으로 억제되고 있는 시장에서 거주자에게 소비 패턴을 실시간으로 시각화해 주는 Wi-Fi 지원 멀티탭이 주목을 받고 있습니다. 각 제조업체는 주류 스마트 홈 생태계에 적합하도록 더 슬림한 디자인과 음성 어시스턴트와의 호환성을 갖춘 제품을 출시하고 있습니다.
에너지 효율이 높은 스마트 홈 전력 관리에 대한 수요
전력 회사의 리베이트 프로그램과 건축 기준 개정으로 인해 스마트 멀티탭은 단순한 선택적 업그레이드에서 표준 설비로 변화하고 있습니다. 캘리포니아주의 ‘신기술 프로그램’은 소매업체에 대한 인식 제고 및 인센티브 조정을 통해 자동 전환 모델의 보급을 촉진한 마케팅 전략의 유효성을 입증했습니다. 유럽에서도 유사한 추세가 나타나고 있으며, 유럽연합 집행위원회의 규정에 따라 네트워크 연결 기기의 대기 전력이 0.5와트로 제한됨에 따라 회로를 완전히 차단할 수 있는 멀티탭의 보급이 가속화되고 있습니다. 현재 펌웨어에는 부하 주기를 예측하는 머신러닝 알고리즘이 내장되어 있으며, 각 벤더들은 클라우드 대시보드와 원격 펌웨어 업데이트를 중심으로 한 지속적인 수익 기회를 포착하고자 하고 있습니다.
엄격한 안전 인증 준수 비용
제조업체는 UL 1363, UL 1449 및 의료 분야용 UL 60601-1과 같은 업계별 규정을 준수해야 합니다. 이들 규정은 모두 변형별 25만 달러를 초과할 수도 있는 철저한 파괴 시험을 요구합니다. 새롭게 등장하고 있는 사이버 보안 관련 추가 기능으로 인해 침투 테스트나 보안 부팅 검증이 더욱 의무화되면서, 프로젝트 주기와 엔지니어링 예산이 압박받고 있습니다. 그 결과, 중소 벤더들은 투자 회수 기간이 장기화되는 상황에 직면하여 틈새 시장이나 가격 주도형 입장으로 밀려나는 경우가 많아지고 있으며, 이에 따라 컴플라이언스 팀을 보유한 다국적 기업들이 경쟁 우위를 더욱 확대되고 있습니다.
부문 분석
FPDU는 책상 아래의 트렁킹 및 소프트 배선을 지정하는 오픈 플랜 사무실 리모델링을 배경으로 2025년 매출의 30.86%를 차지했습니다. 모빌리티 퍼스트 가구의 인기가 높아짐에 따라, FPDU 도입을 위한 멀티탭 시장 규모는 연평균 6.62%로 확대될 것으로 예측됩니다. 스마트 Wi-Fi/블루투스 지원 멀티탭은 현재 판매량에서 차지하는 비중이 14.72%에 그치지만, 가정 내 조명, 보안, 엔터테인먼트 기기의 디지털화가 진행됨에 따라 연평균 성장률(CAGR) 7.45%로 성장을 지속하고, 있습니다. 이동 가능한 멀티탭은 행사나 건설 현장에서 여전히 수요가 있지만, 현장 안전 규제가 강화됨에 따라 그 점유율은 감소 추세를 보이고 있습니다. 데이터센터용 랙 마운트 제품은 설치 효율화를 위해 유압·자기식 차단기나 색상으로 구분된 상 식별자를 갖춘 고밀도 폼 팩터로 전환되고 있습니다. 각 제조업체들은 인라인형 에너지·환경 센서를 제품에 통합하는 사례가 늘어나고 있으며, 예측 유지보수에 초점을 맞춘 SaaS(Software-as-a-Service)형 애드온 도입을 위한 기반이 마련되고 있습니다.
2세대 플랫 헤드 설계는 호텔 및 교육 시설 건축 시 발생하는 구조적 제약에 대응하고 있으며, 한편 벽면과 수평을 이루는 유형은 미관을 중시하는 건축 기준을 준수하기 쉽게 해줍니다. 국제적인 대형 가구 기업들은 현재 워크스테이션에 USB-C PD 콘센트를 탑재하고 있으며, 설계 단계부터 전력 관리 기능을 통합함으로써 멀티탭 시장에 추가적인 성장 동력을 제공합니다.
2025년에는 서지 보호 모델이 매출의 37.05%를 차지했습니다. 이는 과도적인 과전압 완화가 모든 지역에서 여전히 필수 사양으로 남아 있기 때문입니다. 그러나 전력 회사가 수요 반응(Demand Response) 체계를 강화함에 따라, 에너지 모니터링 기능을 갖춘 SKU와 관련된 멀티탭 시장 규모는 2031년까지 연평균 성장률(CAGR) 7.78%로, 다른 분야를 압도하는 속도로 확대될 전망입니다. 프리미엄 모델에는 ±1%의 정확도를 가진 계측 IC가 내장되어 있으며, 클라우드 API를 공개함으로써 빌딩 관리 시스템이 부하를 미세 조정할 수 있게 되었습니다. 과부하 보호는 여전히 필수 기능이지만, 현재는 돌입 전류와 실제 고장을 구별하는 알고리즘을 통한 차단기 리셋 기능이 차별화의 핵심이 되고 있습니다. IP 규격에 부합하는 방수 시리즈는 농업, 건설, 식품 가공 분야에서 시장 점유율을 확보하고 있는 반면, UL 94 V-0 규격을 준수하는 난연성 케이스를 채택한 제품은 병원에서의 사용이 확대되고 있습니다.
지역별 분석
아시아태평양은 싱가포르, 말레이시아, 인도의 새로운 서버 팜 건설에 힘입어 2025년에는 전 세계 매출의 45.05%를 차지했습니다. 이 지역의 멀티탭 시장 규모는 정부의 에너지 효율화 의무화 및 스마트 시티 예산 확대에 힘입어 2031년까지 연평균 성장률(CAGR) 7.55%로 성장할 것으로 전망됩니다. 중국에서는 2급 도시를 중심으로 이더넷 지원 멀티탭이 내장된 벽면 콘센트를 활용한 아파트 리모델링이 가속화되고 있습니다. 인도에서는 전자기기 생산 연계형 인센티브 제도로 인해 내수 수요가 확대되고 있으며, BIS 가이드라인에 기반한 인증을 받은 현지 생산이 촉진되고 있습니다. 한편, 동남아시아 각국 정부는 서지 보호 기능이 탑재된 멀티탭을 학교 현대화 보조금에 포함시키고, 규격 적합 제품에 대한 수입 관세를 감면하고 있습니다.
북미는 여전히 규모는 크지만 성숙기에 접어든 시장입니다. 버지니아주의 ‘데이터 어레이’와 애리조나주의 태양광 발전 캠퍼스 내 데이터센터 확장이 지능형 랙 PDU 수요를 끌어올리고 있습니다. 캐나다의 주요 주에서는 스마트 홈 보급률이 60%를 넘어 주택 업그레이드 주기를 촉진하고 있습니다. 2선 도시를 대상으로 한 첨단 멀티탭에 대한 유틸리티자의 리베이트 프로그램이 가정 내 지속적인 보급을 뒷받침하고 있습니다.
유럽의 전망은 에코디자인 지침과 난방 부하의 전기화에 달려 있습니다. 독일과 프랑스의 건축 기준법에서는 현재 평방미터당 콘센트 수가 규정되어 있으며, 이는 간접적으로 애프터마켓에서의 설치를 뒷받침하고 있습니다. 남미 및 중동 및 아프리카(MEA) 지역은 인프라 구축 및 관광 산업의 성장과 연동된 기회로 가득한 시장이지만, 환율 변동으로 인해 프로젝트 일정이 차질을 빚는 경우가 종종 있습니다.
기타 혜택:
- 엑셀 형식 시장 예측(ME) 시트
- 3개월간의 애널리스트 지원
자주 묻는 질문
목차
제1장 서론
제2장 조사 방법
제3장 주요 요약
제4장 시장 구도
제5장 시장 규모와 성장 예측
제6장 경쟁 구도
제7장 시장 기회와 향후 전망
LSH 26.09.14According to Mordor Intelligence, the power strip market size is expected to grow from USD 14.01 billion in 2025 to USD 14.99 billion in 2026 and is forecast to reach USD 21.02 billion by 2031 at 6.98% CAGR over 2026-2031.
This report is Segmented by Installation Type (Furniture Power Distribution Units (FPDUs), Multioutlet Assemblies, and More), Protection Feature (Surge Protection, Overload Protection, and More), Application (Common / General Purpose, Special Protection, and More), End-User (Industrial Manufacturing Facilities, Data Centers and IT Rooms, and More), Distribution Channel (Offline and Online), and Geography.
Global Power Strip Market Trends and Insights
Proliferation of Electronic Devices in Households
Average connected-device counts per home have surpassed 25 in the United States, stretching traditional outlet configurations and intensifying demand for multi-socket solutions with integrated surge protection. New York State research shows that intelligent advanced power strips can save 106.1 kWh and USD 78.81 per household each year by curbing standby losses. WiFi-enabled strips giving residents real-time visibility into consumption patterns are therefore gaining traction, especially in markets where energy codes actively discourage phantom load draw. Manufacturers are responding with slimmer form factors and voice-assistant compatibility to align with prevailing smart-home ecosystems.
Demand for Energy-Efficient Smart-Home Power Management
Utility rebate programs and revised building codes are converting smart strips from optional upgrades into baseline fixtures. California's Emerging Technology Program validated marketing blueprints that drove widespread adoption of auto-switching models through retailer education and incentive alignment. Europe follows a similar arc, with Commission rules capping networked equipment standby to 0.5 watts and accelerating uptake of strips capable of full circuit isolation. As firmware now incorporates machine-learning algorithms that forecast load cycles, vendors seize recurring-revenue opportunities around cloud dashboards and remote firmware updates.
Stringent Safety-Certification Compliance Costs
Manufacturers must navigate UL 1363, UL 1449, and sector-specific rules such as UL 60601-1 for healthcare, each requiring exhaustive destructive testing that can exceed USD 250,000 per variant. Emerging cybersecurity add-ons further mandate penetration tests and secure-boot validations, stretching project cycles and engineering budgets. Smaller vendors consequently face longer payback horizons and often retreat to niche or price-led positions, allowing multinationals with compliance teams to widen competitive moats.
Other drivers and restraints analyzed in the detailed report include:
- Data-Center and IT-Infrastructure Expansion
- Surge in Remote Working Worldwide
- Utility Rebates and Building-Code Mandates for APS
- Industrial-IoT-Driven Networked PDU Adoption
- Counterfeit Low-Cost Products Pressure Pricing
For complete list of drivers and restraints, kindly check the Table Of Contents.
Segment Analysis
FPDUs commanded 30.86% of 2025 revenue on the back of open-plan office refurbishments specifying under-desk trunking and soft-wiring. The power strip market size for FPDU deployments is projected to expand at 6.62% annually as mobility-first furniture gains momentum. Smart WiFi/Bluetooth strips, while only 14.72% of current volumes, post a 7.45% CAGR as households digitize lighting, security, and entertainment clusters. Relocatable Power Taps retain relevance in events and construction, but their share is trending down amid stricter site-safety enforcement. Rack-mount products in data halls are pivoting toward high-density form factors with hydraulic-magnetic breakers and color-coded phase identifiers to streamline installation. Manufacturers increasingly bundle in-line energy and environmental sensors, setting the stage for Software-as-a-Service add-ons focused on predictive maintenance.
Second-generation flat-head designs answer millwork constraints in hospitality and education builds, while wall-flush variants simplify compliance with aesthetics-oriented building codes. International furniture giants now embed USB-C PD outlets in workstations, embedding power management at the design phase and supplying incremental lift to the power strip market.
Surge-protected models held 37.05% revenue in 2025 because transient over-voltage mitigation remains a non-negotiable specification across geographies. The power strip market size linked to energy-monitoring SKUs will, however, outpace at 7.78% CAGR through 2031 as utilities tighten demand-response frameworks. Premium models integrate metering ICs accurate to +-1% and expose cloud APIs, enabling building-management systems to fine-tune loads. Overload protection remains table stakes, yet differentiation now revolves around algorithmic breaker reset that distinguishes inrush from genuine faults. IP-rated waterproof series secure share in agriculture, construction, and food-processing, while fire-retardant casings compliant with UL 94 V-0 escalate usage in hospitals.
Complete Report Scope:
- By Installation Type
- Furniture Power Distribution Units (FPDUs)
- Multioutlet Assemblies
- Relocatable Power Taps (RPTs)
- Rack-mount Power Distribution Strips
- Flat-head / Low-profile Power Strips
- Embedded / In-wall Power Strips
- Smart WiFi / Bluetooth Power Strips
- By Protection Feature
- Surge Protection
- Overload Protection
- Waterproof / Dust-proof (IP Rated)
- Fire-resistant Casing
- Energy Monitoring and Metering
- By Application
- Common / General Purpose
- Special Protection
- Smart Power Strips
- Heavy-duty Industrial
- By End-User
- Industrial Manufacturing Facilities
- Data Centers and IT Rooms
- Commercial Offices and Retail
- Healthcare Facilities
- Hospitality and Leisure
- Education and Public Institutions
- Residential
- By Distribution Channel
- Offline (Electrical Wholesalers and Retail)
- Online (E-commerce Platforms)
- By Geography
- North America
- United States
- Canada
- Mexico
- Europe
- Germany
- United Kingdom
- France
- Italy
- Spain
- Russia
- Rest of Europe
- Asia-Pacific
- China
- Japan
- India
- South Korea
- ASEAN
- Australia and New Zealand
- Rest of Asia-Pacific
- South America
- Brazil
- Argentina
- Rest of South America
- Middle East and Africa
- Middle East
- Saudi Arabia
- UAE
- Turkey
- Rest of Middle East
- Africa
- South Africa
- Nigeria
- Rest of Africa
- Middle East
- North America
Geography Analysis
Asia-Pacific retained 45.05% of worldwide revenue in 2025, underpinned by new server farms in Singapore, Malaysia, and India. The region's power strip market size is pegged for a 7.55% CAGR through 2031 as state energy-efficiency mandates and smart-city budgets gain steam. In China, Tier-2 urban centers are accelerating apartment retrofits with embedded wall outlets hosting Ethernet-based power strips. India's production-linked incentive schemes for electronics amplify domestic demand and favor certified local manufacturing under BIS guidelines. Southeast Asian governments, meanwhile, bundle surge-protected strips into school modernization grants, alleviating import duties for compliant products.
North America remains a sizeable but maturing territory. Data-center expansions across Virginia's "Data Alley" and Arizona's solar-powered campuses buoy demand for intelligent rack PDUs. Smart-home penetration rates surpass 60% in Canada's major provinces, lifting residential upgrade cycles. Utility rebate programs for Tier 2 advanced power strips underpin sustained household uptake.
Europe's prospects hinge on eco-design directives and electrification of heating loads; German and French building codes now earmark receptacle counts per square meter, indirectly driving aftermarket installations. South America and MEA represent opportunistic plays tied to infrastructure rollouts and tourism growth, though currency volatility often skews project timelines.
- Eaton (Tripp Lite)
- Legrand SA
- Schneider Electric (incl. APC)
- Koninklijke Philips N.V.
- ABB Ltd
- Hubbell Incorporated
- Belkin International
- Leviton Manufacturing
- Panasonic Corporation
- Delixi Electric
- Falconer Electronics
- Cyber Power Systems
- General Electric Co.
- Anker Innovations
- TP-Link Technologies
- Bestek Corp.
- Huntkey Enterprise Group
- Mersen S.A.
- Monster Inc.
- Accell Corporation
- Hama GmbH and Co KG
- UbiGear
Additional Benefits:
- The market estimate (ME) sheet in Excel format
- 3 months of analyst support
TABLE OF CONTENTS
1 INTRODUCTION
- 1.1 Study Assumptions and Market Definition
- 1.2 Scope of the Study
2 RESEARCH METHODOLOGY
3 EXECUTIVE SUMMARY
4 MARKET LANDSCAPE
- 4.1 Market Overview
- 4.2 Market Drivers
- 4.2.1 Proliferation of electronic devices in households
- 4.2.2 Demand for energy-efficient smart-home power management
- 4.2.3 Data-center and IT-infrastructure expansion
- 4.2.4 Surge in remote working worldwide
- 4.2.5 Utility rebates and building-code mandates for APS
- 4.2.6 Industrial-IoT-driven networked PDU adoption
- 4.3 Market Restraints
- 4.3.1 Stringent safety-certification compliance costs
- 4.3.2 Counterfeit low-cost products pressure pricing
- 4.3.3 PoE adoption reducing outlet demand for devices
- 4.3.4 E-waste directives raising producer responsibility
- 4.4 Supply Chain Analysis
- 4.5 Regulatory Landscape
- 4.6 Technological Outlook
- 4.7 Porter's Five Forces Analysis
- 4.7.1 Bargaining Power of Suppliers
- 4.7.2 Bargaining Power of Buyers
- 4.7.3 Threat of New Entrants
- 4.7.4 Intensity of Competitive Rivalry
- 4.7.5 Threat of Substitutes
5 MARKET SIZE AND GROWTH FORECASTS (VALUE)
- 5.1 By Installation Type
- 5.1.1 Furniture Power Distribution Units (FPDUs)
- 5.1.2 Multioutlet Assemblies
- 5.1.3 Relocatable Power Taps (RPTs)
- 5.1.4 Rack-mount Power Distribution Strips
- 5.1.5 Flat-head / Low-profile Power Strips
- 5.1.6 Embedded / In-wall Power Strips
- 5.1.7 Smart WiFi / Bluetooth Power Strips
- 5.2 By Protection Feature
- 5.2.1 Surge Protection
- 5.2.2 Overload Protection
- 5.2.3 Waterproof / Dust-proof (IP Rated)
- 5.2.4 Fire-resistant Casing
- 5.2.5 Energy Monitoring and Metering
- 5.3 By Application
- 5.3.1 Common / General Purpose
- 5.3.2 Special Protection
- 5.3.3 Smart Power Strips
- 5.3.4 Heavy-duty Industrial
- 5.4 By End-User
- 5.4.1 Industrial Manufacturing Facilities
- 5.4.2 Data Centers and IT Rooms
- 5.4.3 Commercial Offices and Retail
- 5.4.4 Healthcare Facilities
- 5.4.5 Hospitality and Leisure
- 5.4.6 Education and Public Institutions
- 5.4.7 Residential
- 5.5 By Distribution Channel
- 5.5.1 Offline (Electrical Wholesalers and Retail)
- 5.5.2 Online (E-commerce Platforms)
- 5.6 By Geography
- 5.6.1 North America
- 5.6.1.1 United States
- 5.6.1.2 Canada
- 5.6.1.3 Mexico
- 5.6.2 Europe
- 5.6.2.1 Germany
- 5.6.2.2 United Kingdom
- 5.6.2.3 France
- 5.6.2.4 Italy
- 5.6.2.5 Spain
- 5.6.2.6 Russia
- 5.6.2.7 Rest of Europe
- 5.6.3 Asia-Pacific
- 5.6.3.1 China
- 5.6.3.2 Japan
- 5.6.3.3 India
- 5.6.3.4 South Korea
- 5.6.3.5 ASEAN
- 5.6.3.6 Australia and New Zealand
- 5.6.3.7 Rest of Asia-Pacific
- 5.6.4 South America
- 5.6.4.1 Brazil
- 5.6.4.2 Argentina
- 5.6.4.3 Rest of South America
- 5.6.5 Middle East and Africa
- 5.6.5.1 Middle East
- 5.6.5.1.1 Saudi Arabia
- 5.6.5.1.2 UAE
- 5.6.5.1.3 Turkey
- 5.6.5.1.4 Rest of Middle East
- 5.6.5.2 Africa
- 5.6.5.2.1 South Africa
- 5.6.5.2.2 Nigeria
- 5.6.5.2.3 Rest of Africa
- 5.6.5.1 Middle East
- 5.6.1 North America
6 COMPETITIVE LANDSCAPE
- 6.1 Market Concentration
- 6.2 Strategic Moves
- 6.3 Market Share Analysis
- 6.4 Company Profiles (includes Global level Overview, Market level overview, Core Segments, Financials as available, Strategic Information, Market Rank/Share for key companies, Products and Services, and Recent Developments)
- 6.4.1 Eaton (Tripp Lite)
- 6.4.2 Legrand SA
- 6.4.3 Schneider Electric (incl. APC)
- 6.4.4 Koninklijke Philips N.V.
- 6.4.5 ABB Ltd
- 6.4.6 Hubbell Incorporated
- 6.4.7 Belkin International
- 6.4.8 Leviton Manufacturing
- 6.4.9 Panasonic Corporation
- 6.4.10 Delixi Electric
- 6.4.11 Falconer Electronics
- 6.4.12 Cyber Power Systems
- 6.4.13 General Electric Co.
- 6.4.14 Anker Innovations
- 6.4.15 TP-Link Technologies
- 6.4.16 Bestek Corp.
- 6.4.17 Huntkey Enterprise Group
- 6.4.18 Mersen S.A.
- 6.4.19 Monster Inc.
- 6.4.20 Accell Corporation
- 6.4.21 Hama GmbH and Co KG
- 6.4.22 UbiGear
7 MARKET OPPORTUNITIES AND FUTURE OUTLOOK
- 7.1 White-space and Unmet-need Assessment