

|
시장보고서
상품코드
2124927
누수 감지 솔루션 : 시장 점유율 분석, 업계 동향과 통계, 성장 예측(2026-2031년)Global Leak Detection Solutions - Market Share Analysis, Industry Trends & Statistics, Growth Forecasts (2026 - 2031) |
||||||
 Mordor Intelligence
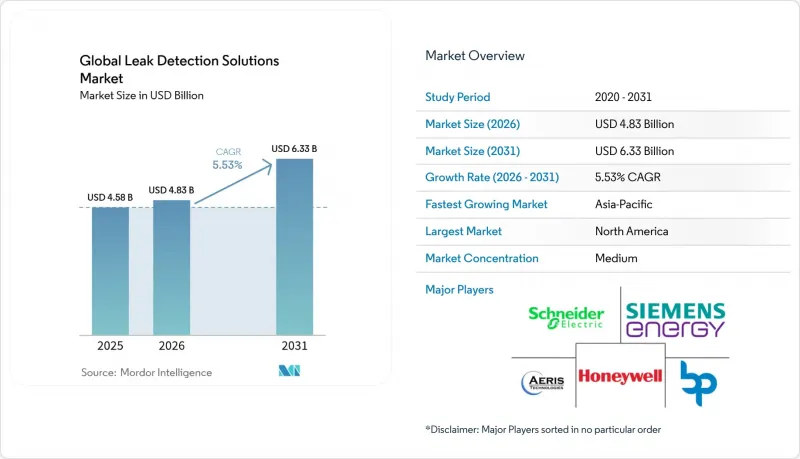
Mordor Intelligence에 의하면, 누수 감지 솔루션 시장 규모는 2025년에 45억 8,000만 달러로 평가되었고, 2026년 48억 3,000만 달러에서 2031년까지 63억 3,000만 달러에 이를 것으로 예측되며, 예측 기간(2026-2031년) CAGR은 5.53%를 기록할 전망입니다.
본 보고서는 기술별(음향/초음파, 압력 분석 등), 최종 사용자 산업(석유 및 가스,화학, 수처리 등), 구성 요소(하드웨어, 소프트웨어, 서비스), 도입 형태(고정식/설치형, 휴대용/핸드헬드형 등), 파이프라인 단계(업스트림, 중류 등), 지역(북미, 남미, 유럽, 아시아태평양, 중동 및 아프리카)별로 분류되어 있습니다.
전 세계 누출 감지 솔루션 시장 동향 및 인사이트
엄격한 메탄 누출 규제가 시장 변혁을 주도
2024년 1미터톤당 900달러로 시작하여 2026년까지 1,500달러로 인상되는 ‘인플레이션 억제법’의 메탄 추가 과금은 지속적인 모니터링 비용을 과금 지불보다 저렴하게 만들어 프로젝트의 경제성을 재구축했습니다. 이와 더불어, ‘슈퍼 에미터’ 프로토콜에 따라 제3자가 시간당 100kg을 초과하는 누출에 대해 사업자의 대응을 요청할 수 있게 되면서, 고정식 센서 및 위성 데이터 피드의 도입이 가속화되었습니다. 사업자들은 가동 중단을 피하기 위해 기존의 ‘메소드 21’ 조사를 광학식 가스 이미징 및 광섬유 어레이로 대체함으로써, 고해상도 카메라 패키지의 수주량을 끌어올렸습니다.
수소 및 CCUS 파이프라인 프로젝트의 급속한 확대
수소 분자는 메탄보다 분자 크기가 작고 확산성이 높기 때문에 1 ppm 미만의 누출을 감지할 수 있는 감지기가 요구되고 있습니다. 라만 분석 장치는 수 미터 거리에서도 그러한 감도를 발휘한다는 것이 입증되었습니다. 미국 에너지부는 2025년에 수소 전용 감지 기술 연구 개발(R&D)에 2,500만 달러를 배정했습니다. GAIL을 포함한 인도의 국영 사업자들은 수소 전용 간선 파이프라인을 평가했으며, 이로 인해 특수 센서에 대한 지속적인 수요가 발생했습니다.
기존 파이프라인에 광섬유 및 LiDAR를 도입하는 데 따르는 막대한 설비 투자
분산형 광섬유 센싱의 비용은 1킬로미터당 5만-10만 달러이며, 사후 설치에는 대부분의 경우 굴착이나 랙 개조가 필요하여 처리 능력에 지장을 초래합니다. 위험 구역에 적합한 LiDAR 헤드의 가격은 20만-50만 달러로, 원유 가격이 하락했을 때는 도입이 제한되었습니다. 그 결과, 이익률이 낮은 생산 지역의 사업자들은 감지 범위가 좁음에도 불구하고 휴대용 초음파 감지기를 선호하여 채택했습니다.
부문 분석
음향 및 초음파 시스템은 2025년 매출의 26.74%를 차지하며, 누출 감지 솔루션 시장에서 가장 큰 단일 기술 그룹을 형성하고 있습니다. 압전 센서는 반경 40m 이내에서 즉시 경보를 발령하고 보정이 필요 없기 때문에 육상 집유 라인에 적합한 가치 제안을 제공했습니다. 레이저 흡수 및 LiDAR 플랫폼은 절대 매출액 기준으로는 여전히 규모가 작지만, 정량화된 배출량 측정 프로토콜이 규제 당국에 인정받은 것을 계기로 연평균 성장률(CAGR) 8.41%로 성장했습니다.
열화상 카메라는 휴대형에서 클라우드 연결형으로 전환되고, 예측 분석을 위한 복사 측정 데이터를 스트리밍으로 전송하게 됨에 따라 정유시설 운영자들 사이에서 그 매력이 확대되었습니다. 광섬유 분산형 센싱은 유지보수 접근이 제한되었던 해저 타이백 구간에서 계약을 수주했습니다. 분석 모델링을 통해 음향 방출을 기반으로 한 저장 탱크 모니터링의 국소화 오차가 1% 미만임이 밝혀져, 고정자산 분야에서 음향 기술의 우위가 입증되었습니다.
석유 및 가스 부문은 법정 누출 벌금 및 탄화수소 누출이 초래하는 중대한 영향을 반영하여 2025년 매출의 60.35%를 차지했습니다. 그럼에도 불구하고, 상수도 유틸리티자는 노후화된 배수관 및 가뭄에 따른 물 손실 감축 의무화에 힘입어 연평균 성장률(CAGR) 5.76%라는 가장 빠른 성장세를 기록했습니다. 상수도 유틸리티자들은 음용수 네트워크에서 ‘누수 유무’를 판별하는 데 98.3%의 정확도를 달성한 AI 분류기를 도입했습니다. 화학 및 발전 사업자는 기업의 넷제로(Net Zero) 방침에 따라 클램프온식 유량계를 채택한 반면, 수소 개발 사업자는 안전 기준 요건을 충족하기 위해 라만 분광법을 기반으로 한 검출기를 요구했습니다.
지역별 분석
북미는 메탄 배출 규제, 파이프라인 안전 규제 강화, 그리고 셰일 분지를 면밀히 조사하는 MethaneSAT와 같은 위성 검증 프로그램의 전개로 인해 2025년에는 전 세계 매출의 37.70%를 차지했습니다. 캐나다의 수소 로드맵에 따라 특수 누출 센서 수주가 더욱 증가한 반면, 멕시코의 국경을 넘는 파이프라인 건설은 미드스트림 모니터링 솔루션에 대한 추가 수요를 창출했습니다. 이 지역의 누출 감지 솔루션 시장 규모는 정유사들이 노후화된 자산을 디지털화함에 따라 꾸준히 확대될 것으로 예측됩니다.
아시아태평양은 2031년까지 연평균 성장률(CAGR) 7.62%를 기록했습니다. 인도는 2025년에 13억 달러를 투자하여 총 길이 2,800km의 LPG 파이프라인을 가동하고, 새로운 가스 회랑 구축에 50억 달러를 배정함으로써 하드웨어 수입 및 현지 조립이 확대되었습니다. 일본은 메탄 누출을 억제하기 위한 양자 협정을 체결하고, 도시 하수관의 드론 점검에 관한 연구 개발(R&D)에 자금을 지원했습니다. 중국에서는 도시 지역의 주요 도로 아래에 있는 상수도관의 파손을 감지하기 위해 L-밴드 SAR과 지하 레이더를 결합한 기술의 도입을 확대하여, 지자체로부터의 수주가 가속화되었습니다.
유럽에서는 EU가 기업의 지속가능성 보고 및 메탄 배출 강도 공개를 강화함에 따라 그 성장세가 유지되었습니다. 사업자들은 북해의 상호 연결선을 따라 광섬유 케이블을 설치하고, 배전망을 감시하기 위해 LiDAR를 탑재한 헬리콥터에 투자했습니다. 중동 및 아프리카에서는 숙련된 인력이 부족했으나, 걸프 지역의 CCUS 허브 증가와 동아프리카의 새로운 원유 수출 파이프라인 건설로 인해 턴키 방식의 누출 감지 패키지 계약이 체결되었습니다. 지역 유틸리티자들은 기술 이전 협정을 활용하여 역량 격차를 해소했습니다.
기타 혜택:
- 엑셀 형식 시장 예측(ME) 시트
- 3개월간의 애널리스트 지원
자주 묻는 질문
목차
제1장 서론
제2장 조사 방법
제3장 주요 요약
제4장 시장 구도
제5장 시장 규모와 성장 예측
제6장 경쟁 구도
제7장 시장 기회와 향후 전망
LSH 26.09.14According to Mordor Intelligence, the leak detection solutions market size was valued at USD 4.58 billion in 2025 and estimated to grow from USD 4.83 billion in 2026 to reach USD 6.33 billion by 2031, at a CAGR of 5.53% during the forecast period (2026-2031).
This report is Segmented by Technology (Acoustic/Ultrasonic, Pressure Analysis, and More), End-User Industry (Oil and Gas, Chemical, Water Treatment, and More), Component (Hardware, Software, and Services), Deployment Mode (Fixed/Stationary, Portable/Handheld, and More), Pipeline Stage (Upstream, Midstream, and More), and Geography (North America, South America, Europe, Asia-Pacific, and Middle East and Africa).
Global Leak Detection Solutions Market Trends and Insights
Stringent fugitive-methane regulations drive market transformation
The Inflation Reduction Act's methane surcharge, which started at USD 900 per metric ton in 2024 and climbs to USD 1,500 by 2026, re-shaped project economics by making continuous monitoring cheaper than paying fees. Complementary "Super Emitter" protocols allowed third parties to trigger operator response on leaks above 100 kg/hr, accelerating the adoption of fixed sensors and satellite data feeds. Operators substituted legacy Method 21 surveys with optical gas imaging and fiber-optic arrays to avoid downtime, lifting order volumes for high-resolution camera packages.
Rapid expansion of hydrogen and CCUS pipeline projects
Hydrogen molecules are smaller and more diffusive than methane, demanding detectors that spot leaks below 1 ppm; Raman analyzers demonstrated such sensitivity at several-meter stand-off distances. The U.S. Department of Energy earmarked USD 25 million for hydrogen-specific detection R&D in 2025. India's state operators, including GAIL, evaluated dedicated hydrogen trunklines, creating follow-on demand for specialized sensors.
High CAPEX for fiber-optic and LiDAR deployments in brown-field pipelines
Distributed fiber-optic sensing costs USD 50,000-100,000 per kilometer, and retrofits often require trenching or rack modifications that disrupt throughput. LiDAR heads suitable for hazardous zones were priced between USD 200,000 and USD 500,000, restricting adoption when crude prices softened. Operators in lower-margin basins thus favored portable ultrasonic detectors despite narrower coverage.
Other drivers and restraints analyzed in the detailed report include:
- AI-enabled predictive analytics lower false positives
- Satellite constellations enable global emissions transparency
- Scarcity of skilled thermography and acoustics technicians in emerging markets
For complete list of drivers and restraints, kindly check the Table Of Contents.
Segment Analysis
Acoustic and ultrasonic systems held 26.74% of 2025 revenues, making them the largest single technology cohort in the leak detection solutions market. Piezo-electric sensors delivered instantaneous alerts within a 40 m radius and required no calibration, a value proposition that suited onshore gathering lines. Laser absorption and LiDAR platforms, while still smaller in absolute sales, expanded at an 8.41% CAGR, buoyed by regulatory recognition of quantified emission measurement protocols.
Thermal imagers moved from handheld to cloud-connected variants that streamed radiometric data for predictive analytics, broadening appeal among refinery operators. Fiber-optic distributed sensing gained contracts along subsea tiebacks where maintenance access was limited. Analytical modeling showed sub-1% localization error for acoustic-emission-based storage-tank monitoring, validating acoustic dominance in fixed assets.
The oil and gas sector captured 60.35% of 2025 revenue, reflecting statutory leak fees and the high-consequence nature of hydrocarbon releases. Nevertheless, water treatment utilities logged the quickest expansion at 5.76% CAGR, spurred by aging mains and drought-linked loss-reduction mandates. Utilities deployed AI classifiers that achieved 98.3% accuracy on leak/no-leak differentiation in potable networks. Chemical and power-generation operators adopted clamp-on flowmeters following corporate net-zero policies, while hydrogen developers demanded Raman-based detectors to satisfy safety case requirements.
Complete Report Scope:
- By Technology
- Acoustic / Ultrasonic
- Pressure Analysis
- Thermal Imaging
- Fiber Optic
- Laser Absorption and LiDAR
- Vapor Sensing
- E-RTTM
- Other Technologies
- By End-User Industry
- Oil and Gas
- Chemical
- Water Treatment
- Power Generation
- Other End-Users
- By Component
- Hardware
- Software
- Services
- By Deployment Mode
- Fixed / Stationary
- Portable / Handheld
- Drone-Mounted / Aerial
- By Pipeline Stage
- Upstream
- Midstream
- Downstream
- By Geography
- North America
- United States
- Canada
- Mexico
- South America
- Brazil
- Argentina
- Rest of South America
- Europe
- Germany
- United Kingdom
- France
- Italy
- Russia
- Rest of Europe
- Asia-Pacific
- China
- Japan
- India
- South Korea
- Australia
- Rest of Asia-Pacific
- Middle East and Africa
- Middle East
- Saudi Arabia
- United Arab Emirates
- Turkey
- Rest of Middle East
- Africa
- South Africa
- Nigeria
- Rest of Africa
- Middle East
- North America
Geography Analysis
North America retained 37.70% of global revenue in 2025 owing to methane-fee statutes, enhanced pipeline safety regulations, and the rollout of satellite verification programs such as MethaneSAT that scrutinized shale basins. Canada's hydrogen roadmap further boosted orders for specialized leak sensors, while Mexico's cross-border pipeline build created incremental demand for midstream monitoring solutions. The leak detection solutions market size in the region is forecast to advance steadily as refiners digitize aging assets.
Asia-Pacific recorded a 7.62% CAGR through 2031. India commissioned a USD 1.3 billion, 2,800 km LPG pipeline in 2025 and earmarked USD 5 billion for new gas corridors, lifting hardware imports, and local assembly. Japan signed bilateral pacts to curb methane leakage and funded R&D on drone-based inspections for municipal sewer lines. China expanded L-band SAR combined with ground-penetrating radar to detect water-line failures beneath urban arteries, accelerating municipal orders.
Europe maintained momentum as the EU tightened corporate sustainability reporting and methane-intensity disclosure. Operators integrated fiber-optic strings along North Sea interconnectors and invested in LiDAR-equipped helicopters to monitor distribution grids. The Middle East and Africa lagged in skilled labor, but rising CCUS hubs in the Gulf and new crude export pipelines in East Africa unlocked contracts for turnkey leak detection packages. Regional utilities leveraged technology transfer agreements to bridge capability gaps.
- Honeywell International Inc.
- Aeris Technologies Inc.
- Bridger Photonics Inc.
- Schneider Electric SE
- Siemens Energy AG
- Xylem Inc.
- Krohne Messtechnik GmbH
- PSI Software AG
- Teledyne FLIR LLC
- ClampOn AS
- PermAlert (Division of Tremco Incorporated)
- OptaSense Ltd. (a Luna Innovations company)
- Physical Sciences Inc.
- Veeder-Root Company
- Atmos International Limited
- Emerson Electric Co.
- Baker Hughes Company - Avitas Systems
- Perma-Pipe International Holdings Inc.
- Sensit Technologies LLC
- Pentair plc
- Synodon Inc.
- INGU Solutions Inc.
- New Cosmos Electric Co. Ltd.
- Pressure Pipe Inspection Company (PPIC)
- Enagas S.A.
- TTK SAS
Additional Benefits:
- The market estimate (ME) sheet in Excel format
- 3 months of analyst support
TABLE OF CONTENTS
1 INTRODUCTION
- 1.1 Study Assumptions and Market Definition
- 1.2 Scope of the Study
2 RESEARCH METHODOLOGY
3 EXECUTIVE SUMMARY
4 MARKET LANDSCAPE
- 4.1 Market Overview
- 4.2 Market Drivers
- 4.2.1 Stringent fugitive-methane regulations (e.g., U.S. Inflation Reduction Act)
- 4.2.2 Rapid expansion of hydrogen and CCUS pipeline projects
- 4.2.3 AI-enabled predictive analytics lowers false positives
- 4.2.4 Adoption of leak-detection-as-a-service (LDaaS) business models
- 4.2.5 Satellite constellations providing high-resolution emissions data
- 4.2.6 Mandatory ESG reporting driving proactive leak management
- 4.3 Market Restraints
- 4.3.1 High CAPEX for fiber-optic and LiDAR deployments in brown-field pipelines
- 4.3.2 Scarcity of skilled thermography and acoustics technicians in emerging markets
- 4.3.3 Cyber-security vulnerabilities in cloud-linked LD systems
- 4.3.4 False alarms in multiphase flow conditions reducing operator confidence
- 4.4 Value Chain Analysis
- 4.5 Regulatory Landscape
- 4.6 Technological Outlook
- 4.7 Porter's Five Forces Analysis
- 4.7.1 Threat of New Entrants
- 4.7.2 Bargaining Power of Consumers
- 4.7.3 Bargaining Power of Suppliers
- 4.7.4 Threat of Substitute Products
- 4.7.5 Intensity of Competitive Rivalry
- 4.8 Impact of Macroeconomic Factors
5 MARKET SIZE AND GROWTH FORECASTS (VALUE)
- 5.1 By Technology
- 5.1.1 Acoustic / Ultrasonic
- 5.1.2 Pressure Analysis
- 5.1.3 Thermal Imaging
- 5.1.4 Fiber Optic
- 5.1.5 Laser Absorption and LiDAR
- 5.1.6 Vapor Sensing
- 5.1.7 E-RTTM
- 5.1.8 Other Technologies
- 5.2 By End-User Industry
- 5.2.1 Oil and Gas
- 5.2.2 Chemical
- 5.2.3 Water Treatment
- 5.2.4 Power Generation
- 5.2.5 Other End-Users
- 5.3 By Component
- 5.3.1 Hardware
- 5.3.2 Software
- 5.3.3 Services
- 5.4 By Deployment Mode
- 5.4.1 Fixed / Stationary
- 5.4.2 Portable / Handheld
- 5.4.3 Drone-Mounted / Aerial
- 5.5 By Pipeline Stage
- 5.5.1 Upstream
- 5.5.2 Midstream
- 5.5.3 Downstream
- 5.6 By Geography
- 5.6.1 North America
- 5.6.1.1 United States
- 5.6.1.2 Canada
- 5.6.1.3 Mexico
- 5.6.2 South America
- 5.6.2.1 Brazil
- 5.6.2.2 Argentina
- 5.6.2.3 Rest of South America
- 5.6.3 Europe
- 5.6.3.1 Germany
- 5.6.3.2 United Kingdom
- 5.6.3.3 France
- 5.6.3.4 Italy
- 5.6.3.5 Russia
- 5.6.3.6 Rest of Europe
- 5.6.4 Asia-Pacific
- 5.6.4.1 China
- 5.6.4.2 Japan
- 5.6.4.3 India
- 5.6.4.4 South Korea
- 5.6.4.5 Australia
- 5.6.4.6 Rest of Asia-Pacific
- 5.6.5 Middle East and Africa
- 5.6.5.1 Middle East
- 5.6.5.1.1 Saudi Arabia
- 5.6.5.1.2 United Arab Emirates
- 5.6.5.1.3 Turkey
- 5.6.5.1.4 Rest of Middle East
- 5.6.5.2 Africa
- 5.6.5.2.1 South Africa
- 5.6.5.2.2 Nigeria
- 5.6.5.2.3 Rest of Africa
- 5.6.5.1 Middle East
- 5.6.1 North America
6 COMPETITIVE LANDSCAPE
- 6.1 Market Concentration
- 6.2 Strategic Moves
- 6.3 Market Share Analysis
- 6.4 Company Profiles (includes Global level Overview, Market level overview, Core Segments, Financials as available, Strategic Information, Market Rank/Share for key companies, Products and Services, and Recent Developments)
- 6.4.1 Honeywell International Inc.
- 6.4.2 Aeris Technologies Inc.
- 6.4.3 Bridger Photonics Inc.
- 6.4.4 Schneider Electric SE
- 6.4.5 Siemens Energy AG
- 6.4.6 Xylem Inc.
- 6.4.7 Krohne Messtechnik GmbH
- 6.4.8 PSI Software AG
- 6.4.9 Teledyne FLIR LLC
- 6.4.10 ClampOn AS
- 6.4.11 PermAlert (Division of Tremco Incorporated)
- 6.4.12 OptaSense Ltd. (a Luna Innovations company)
- 6.4.13 Physical Sciences Inc.
- 6.4.14 Veeder-Root Company
- 6.4.15 Atmos International Limited
- 6.4.16 Emerson Electric Co.
- 6.4.17 Baker Hughes Company - Avitas Systems
- 6.4.18 Perma-Pipe International Holdings Inc.
- 6.4.19 Sensit Technologies LLC
- 6.4.20 Pentair plc
- 6.4.21 Synodon Inc.
- 6.4.22 INGU Solutions Inc.
- 6.4.23 New Cosmos Electric Co. Ltd.
- 6.4.24 Pressure Pipe Inspection Company (PPIC)
- 6.4.25 Enagas S.A.
- 6.4.26 TTK SAS
7 MARKET OPPORTUNITIES AND FUTURE OUTLOOK
- 7.1 White-space and Unmet-Need Assessment


