

|
시장보고서
상품코드
2125380
애플리케이션 아웃소싱 : 시장 점유율 분석, 업계 동향 및 통계, 성장 예측(2026-2031년)Application Outsourcing - Market Share Analysis, Industry Trends & Statistics, Growth Forecasts (2026 - 2031) |
||||||
 Mordor Intelligence
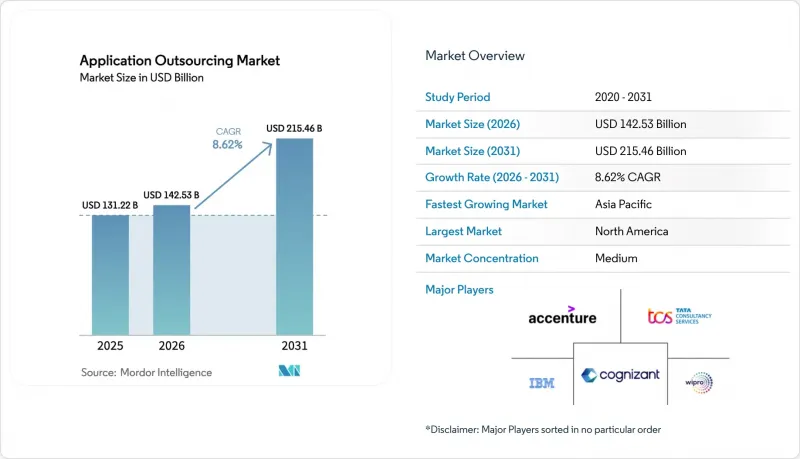
Mordor Intelligence에 의하면, 애플리케이션 아웃소싱 시장 규모는 2025년 1,312억 2,000만 달러로 평가되었습니다. 2026년에는 1,425억 3,000만 달러로 확대되어 2026년부터 2031년에 걸쳐 CAGR 8.62%로 성장을 지속하여, 2031년에는 2,154억 6,000만 달러에 이를 것으로 예측됩니다.
본 보고서는 서비스 유형(애플리케이션 개발·통합, 애플리케이션 유지보수·지원 등), 배포 모델(On-Premise, 클라우드, 하이브리드), 최종 사용자 산업(은행, 금융서비스 및 보험(BFSI), 헬스케어 및 생명과학 등), 조직 규모(대기업, 중소기업),수주 모델(고정 가격, 시간·재료비 방식 등), 그리고 지역별로 분류되어 있습니다.
세계의 애플리케이션 아웃소싱 시장 동향 및 인사이트
중소기업의 디지털 전환(DX) 프로그램 급증
현재 중소기업은 생산성과 고객 도달 범위를 향상시키는 최신 애플리케이션으로 가는 지름길로서 아웃소싱을 활용하고 있습니다. 미국에서는 초기 투자 장벽을 제거하는 유연한 이용 모델에 매력을 느껴, 중소기업의 60%가 2025년에 소프트웨어 개발 아웃소싱을 계획했습니다. 전 세계적으로 5억 달러에서 50억 달러의 매출을 올리는 기업이 4만 개 이상 존재하기 때문에 이 부문은 서비스 제공업체에게 3,000억-4,000억 달러 규모 시장을 형성하고 있습니다. 서비스 제공업체들은 이에 대응하여, 제한된 예산에 부합하면서도 쉽게 확장 가능한 ‘클라우드 우선’ 및 API 주도형 솔루션을 패키지로 제공합니다. 그 결과, 2030년에 이르러 중소기업 부문의 매출은 애플리케이션 아웃소싱 시장 전체의 성장률을 상회할 것으로 예측됩니다.
BFSI 업계의 플랫폼 뱅킹 및 오픈 파이낸스 API로의 전환
은행과 보험사는 임베디드 파이낸스, 오픈 API 생태계, 클라우드 네이티브 아키텍처를 지원하기 위해 애플리케이션에 대한 투자를 가속화하고 있습니다. JP모건 체이스는 워크로드를 클라우드로 이전함으로써 고급 데이터 기능을 활용할 수 있게 되어 AI 분야에서의 리더십을 공고히 할 수 있다고 보고했습니다. 금융 기관의 약 72%는 이미 주요 IT 기능을 아웃소싱하고 있으며, 규제 기한으로 인해 플랫폼의 급격한 변경이 요구되면 이러한 추세는 더욱 강화될 것입니다. BFSI 부문이 애플리케이션 아웃소싱 시장에서 가장 큰 점유율을 차지하는 가운데, 리스크, 규정 준수, 결제 통합에 대한 전문 지식을 갖춘 제공업체들은 경쟁 우위를 확보하고 있습니다.
국경을 넘는 데이터 전송에 따른 규정 준수 비용 증가
GDPR(EU 개인정보보호규정), CCPA, 업계별 규제 등 데이터 주권에 관한 규제가 강화됨에 따라 기업들은 제공 모델을 재설계해야 할 뿐만 아니라, 경우에 따라 워크로드를 지역별로 분산해야 할 수도 있습니다. 법률 고문들은 규정 준수 위반으로 인한 벌금이나 시정 조치가 인력 차익 거래로 얻는 이익을 상쇄할 수 있다고 경고하고 있습니다. 서비스 제공업체들은 지역별 클라우드 존 및 니어쇼어 센터 제공을 통해 이에 대응하고 있지만, 추가적인 암호화, 감사 및 데이터 전송 영향 평가로 인해 프로젝트 비용이 여전히 증가하고 있으며, 계약 체결까지의 주기가 길어지고 있습니다.
부문별 분석
애플리케이션 유지보수 및 지원 시장은 2025년에 404억 9,000만 달러 시장 규모를 기록하며, 전체 애플리케이션 아웃소싱 시장의 30.85%를 차지했습니다. 오랫동안 운영되어 온 ERP, CRM, 공급망 플랫폼에는 여전히 높은 가용성과 단계적인 업그레이드가 요구되고 있으며, 이것이 매니지드 서비스에 대한 안정적인 수요를 뒷받침하고 있습니다. 그러나 제로데이 공격 증가와 규제 당국의 벌금 확대에 따라 보안은 부수적인 서비스에서 성장의 원동력으로 변모하고 있습니다.
이사회가 사이버 리스크를 중시하는 가운데, 애플리케이션 보안 서비스는 연평균 성장률(CAGR) 12.61%로 확대되고 있습니다. 기업들은 코드 스캔 도구와 연중무휴 24시간 SOC 인력을 모두 갖춘 외부 전문가를 선호하는 경향이 있습니다. 그 결과, 보안 프로젝트를 위한 애플리케이션 아웃소싱 시장 규모는 급격히 확대될 것으로 예상되는 반면, 유지보수 부문의 점유율은 점차 축소될 것으로 전망됩니다. 개발, 통합, 현대화 및 테스트 서비스가 포트폴리오를 구성하고 있으며, 기업의 92%가 2030년까지 어느 정도의 레거시 시스템 리팩토링을 계획하고 있습니다.
2025년 매출 중 클라우드 도입이 56.35%를 차지했으며, 이는 739억 6,000만 달러에 해당합니다. 이는 구독형 인프라와 자동 확장이 이제 현대화 로드맵을 정의하고 있음을 여실히 보여줍니다. 분석, 디지털 상거래, 협업 워크로드를 클라우드로 이전하는 기업들이 애플리케이션 아웃소싱 시장에서 가장 큰 단일 성장 요인으로 부상하고 있습니다.
규제 산업에서는 On-Premise 시스템을 하룻밤 사이에 폐지할 수 없기 때문에 하이브리드 모델 시장 규모는 연평균 성장률(CAGR) 9.81%로 확대되고 있습니다. 프로바이더는 데이터센터와 하이퍼스케일러 리전을 연결하는 쿠버네티스 기반 툴체인을 제공하여 지연 시간과 규정 준수를 적절하게 관리하고 있습니다. 이러한 균형이 성숙해짐에 따라 On-Premise 환경 내 애플리케이션 아웃소싱 시장 점유율은 점차 감소하고 있지만, 초저지연 및 주권 데이터와 관련된 업무에서는 On-Premise의 중요성이 여전히 남아 있습니다. 이 부문에서 공급업체들은 혼합 환경 전반에 걸친 네트워크, 신원, 가시성 각 계층을 관리하는 데 주력하고 있습니다.
지역별 분석
북미는 550억 5,000만 달러의 매출을 기록하며, 2025년 애플리케이션 아웃소싱 시장 매출의 41.95%를 차지했습니다. 기업들은 AI, 이벤트 주도형 아키텍처, 제로 트러스트 보안을 대규모로 도입하고 있습니다. 멕시코, 콜롬비아, 코스타리카에 걸쳐 있는 니어쇼어 센터는 연간 20%에 가까운 성장률을 보이며, 애자일 팀의 시간대 차이로 인한 마찰을 완화하고 있습니다.
아시아태평양은 11.85%라는 가장 높은 연평균 성장률(CAGR)을 기록하고 있으며, 인도, 베트남, 필리핀이 서비스 제공의 주축을 이루고 있습니다. 인도 단독으로 2029년까지 208억 1,000만 달러 규모의 소프트웨어 수출을 목표로 하고 있습니다. 중국의 국내 클라우드 추진은 새로운 컨설팅 업무를 창출하고 있는 반면, 호주와 싱가포르는 규제 대상 워크로드의 지역 허브로 자리 잡고 있습니다. 임금 상승과 이직률 증가로 인해 각 벤더들은 자동화 및 2선 도시로의 투자를 지속하고 있습니다.
유럽에서는 데이터 주권 관련 지침의 영향으로 수요가 견조한 추세를 보이고 있습니다. 독일과 영국이 여전히 최대 구매국이며, 폴란드, 루마니아, 우크라이나는 언어적 친화성 덕분에 유럽 및 미국 고객으로부터 니어쇼어 예산을 확보하고 있습니다. 네덜란드의 BPO 시장은 2025년까지 연평균 성장률(CAGR) 6.7%를 기록할 전망입니다. 하이퍼스케일러가 구축한 로컬 클라우드 리전은 기존의 지연이라는 장벽을 제거하고, 엣지 분석 관련 거래를 뒷받침하고 있습니다.
라틴아메리카, 중동 및 아프리카는 새로운 성장의 무대가 되고 있습니다. 브라질, 칠레, 아르헨티나에서는 북미 기업을 대상으로 비용 경쟁력이 있는 애자일 팀을 제공합니다. 걸프 국가 정부들은 대규모 디지털 서비스 프로그램에 자금을 지원하며, 클라우드 및 사이버 보안 노하우에 대한 수요를 창출하고 있습니다. 한편, 남아프리카공화국과 나이지리아에서는 핀테크 및 통신 분야의 코딩 인재 기반이 구축되고 있습니다. 규제 명확화와 네트워크 용량 개선이 2030년까지 이들 지역이 애플리케이션 아웃소싱 시장 전체에서 어느 정도의 점유율을 확보할지 결정할 것입니다.
기타 혜택 :
- 엑셀 형식 시장 예측(ME) 시트
- 3개월간의 애널리스트 지원
자주 묻는 질문
목차
제1장 서론
제2장 조사 방법
제3장 주요 요약
제4장 시장 구도
제5장 시장 규모 및 성장 예측
제6장 경쟁 구도
제7장 시장 기회 및 향후 동향
KTH 26.09.14According to Mordor Intelligence, the application outsourcing market size is expected to grow from USD 131.22 billion in 2025 to USD 142.53 billion in 2026 and is forecast to reach USD 215.46 billion by 2031 at 8.62% CAGR over 2026-2031.
This report is Segmented by Service Type (Application Development and Integration, Application Maintenance and Support, and More), Deployment Model (On-Premise, Cloud, and Hybrid), End-User Industry (BFSI, Healthcare and Life Sciences, and More), Organisation Size (Large Enterprises and Small and Medium Enterprises), Contract Model (Fixed-Price, Time and Material, and More), and Geography.
Global Application Outsourcing Market Trends and Insights
Surging digital-transformation programmes among SMEs
SMEs now treat outsourcing as the fastest path to modern applications that improve productivity and customer reach. In the United States, 60% of smaller firms plan to outsource software builds in 2025, attracted by flexible consumption models that remove upfront capital barriers. With more than 40,000 companies worldwide generating between USD 500 million and USD 5 billion in revenue, the segment offers a USD 300-400 billion pool for service providers. Providers respond by packaging cloud-first, API-driven offerings that fit limited budgets yet scale easily. As a result, SME revenue is expected to outpace overall application outsourcing market growth through 2030.
BFSI's pivot to platform banking and open-finance APIs
Banks and insurers accelerate application spending to support embedded finance, open-API ecosystems, and cloud-native architectures. JPMorgan Chase reports that moving workloads to the cloud unlocks advanced data capabilities and cements its AI leadership. Nearly 72% of financial institutions already outsource substantial IT functions, and that intensity rises when regulatory deadlines push rapid platform changes. Providers with domain knowledge in risk, compliance, and payments integration gain a competitive edge as BFSI contributes the single largest slice of the application outsourcing market.
Rising compliance costs for cross-border data transfer
Tighter data-sovereignty rules such as GDPR, CCPA, and sector-specific mandates force enterprises to redesign delivery models and sometimes split workloads by region. Legal counsel warns that non-compliance fines and remediation can offset labor arbitrage gains. Providers answer with regional cloud zones and nearshore centers, yet extra encryption, audit, and transfer-impact assessments still raise project costs and slow deal cycles.
Other drivers and restraints analyzed in the detailed report include:
- Cloud-native application demand for AI/ML workloads
- Cost-optimisation pressure post-2022 tech-margin squeeze
- Talent attrition and wage inflation in offshore hotspots
For complete list of drivers and restraints, kindly check the Table Of Contents.
Segment Analysis
Application Maintenance & Support contributed USD 40.49 billion in 2025, translating to 30.85% of the overall application outsourcing market. Long-running ERP, CRM, and supply-chain platforms still require dependable uptime and incremental upgrades, which keeps steady demand for managed services. Yet rising zero-day exploits and regulatory fines move security from an ancillary service into a growth engine.
Application Security Services expand at 12.61% CAGR as boards elevate cyber risk. Enterprises prefer external specialists who combine code-scanning tools with 24X7 SOC talent. As a result, the application outsourcing market size for security projects is forecast to climb sharply, while maintenance's share slowly contracts. Development, integration, modernization, and testing services round out the portfolio, with 92% of firms planning some level of legacy refactoring before 2030.
Cloud deployments own 56.35% of 2025 revenue, equivalent to USD 73.96 billion, underscoring how subscription infrastructure and automated scaling now define modernization roadmaps. Enterprises moving analytics, digital commerce, and collaboration workloads to the cloud create the largest single contributor to the application outsourcing market.
Hybrid models rise at a 9.81% CAGR because regulated industries cannot abandon on-premises systems overnight. Providers deliver Kubernetes-based toolchains that bridge data centers and hyperscaler regions, keeping latency and compliance in check. As this balance matures, the application outsourcing market share for on-premises environments gradually declines, yet on-premises remains relevant for ultra-low-latency or sovereign data tasks. The segment keeps providers busy governing network, identity, and observability layers across mixed estates.
Complete Report Scope:
- By Service Type
- Application Development and Integration
- Application Maintenance and Support
- Application Testing and QA
- Application Modernisation and Migration
- Application Security Services
- Others
- By Deployment Model
- On-premise
- Cloud
- Hybrid
- By End-user Industry
- BFSI
- Healthcare and Life Sciences
- Media and Entertainment
- Logistics and Transportation
- Retail and E-commerce
- Manufacturing
- Government and Public Sector
- IT and Telecom
- Other End-User Industries
- By Organisation Size
- Large Enterprises
- Small & Medium Enterprises (SMEs)
- By Contract Model
- Fixed-price
- Time and Material
- Outcome-based / Managed Services
- Build-Operate-Transfer (BOT)
- By Geography
- North America
- United States
- Canada
- Mexico
- South America
- Brazil
- Argentina
- Chile
- Rest of South America
- Europe
- Germany
- United Kingdom
- France
- Russia
- Italy
- Spain
- Rest of Europe
- Asia-Pacific
- China
- India
- Japan
- South Korea
- Australia
- Malaysia
- Singapore
- Rest of Asia-Pacific
- Middle East and Africa
- Middle East
- United Arab Emirates
- Saudi Arabia
- Turkey
- Rest of Middle East
- Africa
- South Africa
- Nigeria
- Rest of Africa
- Middle East
- North America
Geography Analysis
North America generated USD 55.05 billion, equating to 41.95% of 2025 revenue within the application outsourcing market. Enterprises adopt AI, event-driven architectures, and zero-trust security at scale. Nearshore centers across Mexico, Colombia, and Costa Rica grow close to 20% annually, easing time-zone friction for agile teams.
Asia-Pacific posts the fastest 11.85% CAGR, with India, Vietnam, and the Philippines anchoring delivery. India alone targets USD 20.81 billion in software exports by 2029. China's domestic cloud push opens fresh consulting work, while Australia and Singapore become regional hubs for regulated workloads. Wage inflation and attrition keep vendors investing in automation and second-tier cities.
Europe shows steady demand, shaped by data-sovereignty directives. Germany and the United Kingdom remain top buyers, and Poland, Romania, and Ukraine attract nearshore budgets from Western clients thanks to linguistic alignment. The Netherlands BPO market is tracking a 6.7% CAGR through 2025. Local cloud regions built by hyperscalers remove earlier latency barriers and support edge analytics deals.
Latin America, the Middle East, and Africa represent newer growth theaters. Brazil, Chile, and Argentina offer cost-competitive agile squads for North American firms. Gulf governments fund large digital services programs, creating demand for cloud and cybersecurity know-how, while South Africa and Nigeria develop fintech and telecom coding bases. Regulatory clarity and network capacity improvements will decide how much of the wider application outsourcing market these regions capture by 2030.
- Accenture Plc
- IBM Consulting (IBM Corporation)
- Tata Consultancy Services (TCS) Ltd.
- Cognizant Technology Solutions Corporation
- Wipro Limited
- Capgemini SE
- DXC Technology
- HCL Technologies
- Infosys Limited
- NTT DATA Group Corporation
- Atos SE
- CGI Inc.
- Fujitsu Limited
- Tech Mahindra Limited
- LTIMindtree Limited
- Sopra Steria Group SA
- EPAM Systems Inc.
- Endava PLC
- Globant S.A
- Persistent Systems Limited
- Softtek Ltd.
- UST Global
- Hexaware Technologies Limited
- Virtusa Corporation
- Mphasis Limited
- Unisys Corporation
Additional Benefits:
- The market estimate (ME) sheet in Excel format
- 3 months of analyst support
TABLE OF CONTENTS
1 INTRODUCTION
- 1.1 Study Assumptions and Market Definition
- 1.2 Scope of the Study
2 RESEARCH METHODOLOGY
3 EXECUTIVE SUMMARY
4 MARKET LANDSCAPE
- 4.1 Market Overview
- 4.2 Market Drivers
- 4.2.1 Surging digital-transformation programmes among SMEs
- 4.2.2 BFSI's pivot to platform banking and open-finance APIs
- 4.2.3 Cloud-native application demand for AI/ML workloads
- 4.2.4 Cost-optimisation pressure post-2022 tech-margin squeeze
- 4.2.5 Vendor-consolidation to single-pane service partners
- 4.2.6 Near-shore delivery expansion into Latin-America Tier-2 hubs
- 4.3 Market Restraints
- 4.3.1 Rising compliance costs for cross-border data transfer
- 4.3.2 Talent attrition and wage inflation in offshore hotspots
- 4.3.3 Heightened cyber-supply-chain breach incidents
- 4.3.4 AI-driven low-code platforms cannibalising traditional ADM
- 4.4 Industry Value Chain Analysis
- 4.5 Regulatory Landscape
- 4.6 Technological Outlook
- 4.7 Industry Attractiveness - Porter's Five Forces Analysis
- 4.7.1 Bargaining Power of Suppliers
- 4.7.2 Bargaining Power of Buyers
- 4.7.3 Threat of New Entrants
- 4.7.4 Threat of Substitutes
- 4.7.5 Intensity of Competitive Rivalry
- 4.8 Impact of Macroeconomic Factors on the Market
5 MARKET SIZE AND GROWTH FORECASTS (VALUES)
- 5.1 By Service Type
- 5.1.1 Application Development and Integration
- 5.1.2 Application Maintenance and Support
- 5.1.3 Application Testing and QA
- 5.1.4 Application Modernisation and Migration
- 5.1.5 Application Security Services
- 5.1.6 Others
- 5.2 By Deployment Model
- 5.2.1 On-premise
- 5.2.2 Cloud
- 5.2.3 Hybrid
- 5.3 By End-user Industry
- 5.3.1 BFSI
- 5.3.2 Healthcare and Life Sciences
- 5.3.3 Media and Entertainment
- 5.3.4 Logistics and Transportation
- 5.3.5 Retail and E-commerce
- 5.3.6 Manufacturing
- 5.3.7 Government and Public Sector
- 5.3.8 IT and Telecom
- 5.3.9 Other End-User Industries
- 5.4 By Organisation Size
- 5.4.1 Large Enterprises
- 5.4.2 Small & Medium Enterprises (SMEs)
- 5.5 By Contract Model
- 5.5.1 Fixed-price
- 5.5.2 Time and Material
- 5.5.3 Outcome-based / Managed Services
- 5.5.4 Build-Operate-Transfer (BOT)
- 5.6 By Geography
- 5.6.1 North America
- 5.6.1.1 United States
- 5.6.1.2 Canada
- 5.6.1.3 Mexico
- 5.6.2 South America
- 5.6.2.1 Brazil
- 5.6.2.2 Argentina
- 5.6.2.3 Chile
- 5.6.2.4 Rest of South America
- 5.6.3 Europe
- 5.6.3.1 Germany
- 5.6.3.2 United Kingdom
- 5.6.3.3 France
- 5.6.3.4 Russia
- 5.6.3.5 Italy
- 5.6.3.6 Spain
- 5.6.3.7 Rest of Europe
- 5.6.4 Asia-Pacific
- 5.6.4.1 China
- 5.6.4.2 India
- 5.6.4.3 Japan
- 5.6.4.4 South Korea
- 5.6.4.5 Australia
- 5.6.4.6 Malaysia
- 5.6.4.7 Singapore
- 5.6.4.8 Rest of Asia-Pacific
- 5.6.5 Middle East and Africa
- 5.6.5.1 Middle East
- 5.6.5.1.1 United Arab Emirates
- 5.6.5.1.2 Saudi Arabia
- 5.6.5.1.3 Turkey
- 5.6.5.1.4 Rest of Middle East
- 5.6.5.2 Africa
- 5.6.5.2.1 South Africa
- 5.6.5.2.2 Nigeria
- 5.6.5.2.3 Rest of Africa
- 5.6.5.1 Middle East
- 5.6.1 North America
6 COMPETITIVE LANDSCAPE
- 6.1 Market Concentration
- 6.2 Strategic Moves
- 6.3 Market Share Analysis
- 6.4 Company Profiles (includes Global level Overview, Market level overview, Core Segments, Financials as available, Strategic Information, Market Rank/Share for key companies, Products and Services, and Recent Developments)
- 6.4.1 Accenture Plc
- 6.4.2 IBM Consulting (IBM Corporation)
- 6.4.3 Tata Consultancy Services (TCS) Ltd.
- 6.4.4 Cognizant Technology Solutions Corporation
- 6.4.5 Wipro Limited
- 6.4.6 Capgemini SE
- 6.4.7 DXC Technology
- 6.4.8 HCL Technologies
- 6.4.9 Infosys Limited
- 6.4.10 NTT DATA Group Corporation
- 6.4.11 Atos SE
- 6.4.12 CGI Inc.
- 6.4.13 Fujitsu Limited
- 6.4.14 Tech Mahindra Limited
- 6.4.15 LTIMindtree Limited
- 6.4.16 Sopra Steria Group SA
- 6.4.17 EPAM Systems Inc.
- 6.4.18 Endava PLC
- 6.4.19 Globant S.A
- 6.4.20 Persistent Systems Limited
- 6.4.21 Softtek Ltd.
- 6.4.22 UST Global
- 6.4.23 Hexaware Technologies Limited
- 6.4.24 Virtusa Corporation
- 6.4.25 Mphasis Limited
- 6.4.26 Unisys Corporation
7 MARKET OPPORTUNITIES AND FUTURE TRENDS
- 7.1 White-space and Unmet-Need Assessment


