

|
시장보고서
상품코드
2125672
전력 소매업 시장 : 시장 점유율 분석, 업계 동향 및 통계, 성장 예측(2026-2031년)Electricity Retailing - Market Share Analysis, Industry Trends & Statistics, Growth Forecasts (2026 - 2031) |
||||||
 Mordor Intelligence
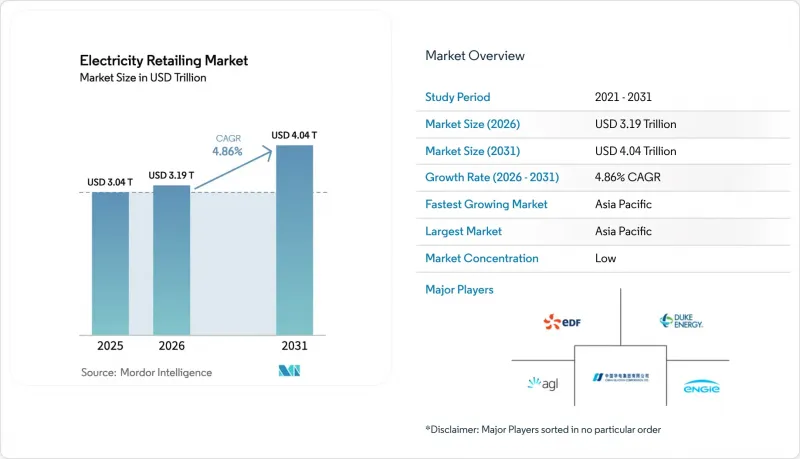
전력 소매업 시장 규모는 2025년에 3조 400억 달러로 평가되었고, 2026년 3조 1,900억 달러에서 2031년까지 4조 400억 달러에 이를 것으로 예측되며, 예측 기간(2026-2031년) CAGR은 4.86%를 나타낼 전망입니다.

본 보고서는 요금 유형별(고정 요금/정액제, 시간대별 요금, 동적/실시간 요금, 친환경/재생에너지 기반, 구독형), 최종 사용자별(주거용, 상업용, 산업용) 및 지역별(북미, 유럽, 아시아태평양, 남미, 중동 및 아프리카)로 분류되어 있습니다. 시장 규모 및 전망은 금액(달러) 기준으로 제시되어 있습니다.
세계의 전력 소매업 시장 동향 및 인사이트
도시 전력망 내 전기차(EV) 충전 부하의 급증
전기차(EV)의 보급으로 인해 도시 지역 수요 곡선이 재편되고 있습니다. 캘리포니아주에서는 2025년까지 200만 대 이상의 전기차가 운행된 것으로 평가되었으며, 2035년까지 1,250만 대에 달할 것이라는 전망도 제시되고 있습니다. 북미의 전력 회사들은 2024년 충전 인프라에 대한 설비 투자액이 전년 지출의 거의 2배에 달했다고 보고하고 있으며, 이는 전기화의 기세가 얼마나 큰지를 여실히 보여줍니다. 부하 유연성 프로그램을 통해,데이터센터 사업자는 피크 시간대에 사용량을 억제하여 계통 연계를 확보할 수 있게 되었으며, 텍사스주에서 실시된 가상 발전소(VPP) 시범 프로젝트에서는 전력 가격이 저렴한 시간대에 배터리를 충전하고, 계통 피크 시간대에 방전함으로써 고객의 전기 요금을 40% 절감할 수 있었음이 입증되었습니다. 이러한 노력은 전력 소매업 시장이 양방향으로 서비스가 충실한 모델로 진화하고 있음을 여실히 보여주고 있습니다.
디지털 기술을 활용한 전력사 변경·요금 비교 포털
소비자가 실시간 요금제에 접근할 수 있는 기회는 급속히 확대되었습니다. 2025년까지 영국 가구의 90%가 시간대별 요금제를 인지하게 되었으나, 공급사 변경을 고려하는 가구는 절반 미만에 그쳤습니다. 독일에서는 2025년까지 동적 요금제 도입을 의무화하는 법안이 심의 중이며, 최종 사용자가 재생에너지의 출력 패턴에 맞추어 소비를 조절할 수 있도록 지원하는 알고리즘 기반 어드바이저 시장이 형성되고 있습니다. 직관적이고 앱 기반의 고객 경험을 구축한 소매업체들은 해지율을 낮추는 동시에 디지털에 익숙한 고객을 유치함으로써, 전력 소매업 시장 전체에서 플랫폼 간 경쟁을 심화시켰습니다.
규제 대상인 기본 요금 및 가격 상한제에 따른 이익률 압박
2025-26 회계연도 호주의 기본 시장 제안에서는 도매 비용 전가 증가를 반영하여 주택용 요금 상한선이 최대 8.9% 인상됨에 따라, 소매업체의 이익 확대 여지가 제한되었습니다. 2024년 독일의 가정용 전기 요금은 1kWh당 평균 0.4519유로였으나, 그 절반 이상이 세금 및 부과금으로 구성되어 소매업체의 차별화 가능성이 위축되었습니다. 한국의 유사한 개입 조치는 기존 대형 전력사인 KEPCO에 부채 누적이라는 부담을 안겨주었으며, 정책 목표가 전력 소매업 시장의 위험-수익 프로파일을 얼마나 왜곡할 수 있는지를 여실히 드러냈습니다.
부문 분석
가격 변동이 심한 가운데, 가정이 청구액의 확실성을 우선시함에 따라 2025년에도 고정 요금/정액 요금 요금제의 점유율은 44.61%를 유지했습니다. 저탄소 스코프 2 배출량을 추구하는 기업공급망과 기후 변화에 대한 가치관에 기반해 라이프스타일을 선택하는 소비자들의 지지에 힘입어, 친환경/재생 에너지를 기반으로 한 요금제는 연평균 성장률(CAGR) 7.38%를 기록했습니다. 규제 대상인 동적 요금제를 이용하는 스페인 가구는 태양광 발전이 풍부한 오후 시간대로 전력 사용 시점을 조정함으로써 연간 8-11%의 절약을 실현했습니다. 동적/실시간 가격 책정은 여전히 틈새 시장이지만, 스마트 계량기가 사실상 모든 단말기를 커버하는 지역, 특히 스웨덴과 핀란드에서는 활발히 활용되고 있습니다. ABB의 초기 투자 비용이 필요 없는 배터리 번들로 대표되는 구독형 ‘에너지-어즈-어-서비스(EaaS)’ 모델은 전력 소매업 시장이 단순한 상품 판매에서 통합형 솔루션으로 전환되고 있음을 보여줍니다.
경쟁 환경에서는 디지털 참여와 행동 분석의 중요성이 점점 더 커지고 있습니다. AI를 활용한 사용량 예측과 게임화 요소를 도입한 모바일 대시보드에 투자하고 있는 소매업체들은 동종 업계 경쟁사에 비해 고객 이탈률이 40% 낮다고 보고하고 있습니다. 규제 완화가 진행된 미국 각 주에서는 앱 기반 브랜드들이 재생에너지를 통한 상쇄와 캐시백형 로열티 프로그램을 결합하여 밀레니얼 세대의 지지를 얻고 있으며, 전력 소매업 업계에서 차별화의 원동력은 요금 체계가 아니라 고객 경험에 있다는 사실이 다시 한번 입증되고 있습니다.
지역별 분석
아시아태평양은 46.02%의 점유율과 5.72%의 연평균 성장률(CAGR) 전망으로 선두를 차지했으며, 그 배경에는 광둥성의 6,500억 kWh 규모 성간 전력 거래와 70GW를 초과하는 인도의 재생에너지 건설 계획이 있습니다. 일본과 한국에서는 요금 상한에 대한 불확실성이 있음에도 불구하고, 도매 가격과 소매 가격의 격차가 확대되고 있어 핀테크를 활용한 신규 진출기업들이 주목받고 있습니다.
유럽에서는 2024년 독일 가정용 전기 요금의 54%를 차지하는 구조적으로 높은 세금과 부과금이 과제로 대두되고 있지만, 송전망의 고도화된 디지털화가 동적 가격 책정 및 수요 반응(Demand Response)을 위한 기반을 제공합니다. 북유럽의 소매업체들은 거의 100%에 달하는 스마트 계량기 보급률을 활용하여 시간 단위 그린 인증서를 판매하고 있으며, 이는 혁신이 규제로 인한 제약을 어떻게 상쇄하고 있는지를 보여주고 있습니다.
북미에서는 전례 없는 규모의 상업용 전력 수요가 발생했습니다(Xcel Energy사만 해도 6.7 GW에 달하는 데이터센터의 계통 연계 제안을 심사했습니다). 반면, 풍부한 천연가스와 재생에너지의 급속한 보급이 도매 가격의 급등을 완화시켰습니다. 주별 규제로 인해 위험-수익 프로파일은 다양해지고 있지만, 건전한 유동성과 정교한 헤지 거래가 투자자들에게 견고한 전력 소매업 시장 규모를 뒷받침하고 있습니다.
기타 혜택 :
- 엑셀 형식 시장 예측(ME) 시트
- 3개월간의 애널리스트 지원
자주 묻는 질문
목차
제1장 서론
제2장 조사 방법
제3장 주요 요약
제4장 시장 구도
제5장 시장 규모 및 성장 예측
제6장 경쟁 구도
제7장 시장 기회 및 향후 전망
AJY 26.09.15According to Mordor Intelligence, the electricity retailing market size was valued at USD 3.04 trillion in 2025 and estimated to grow from USD 3.19 trillion in 2026 to reach USD 4.04 trillion by 2031, at a CAGR of 4.86% during the forecast period (2026-2031).
This report is Segmented by Tariff Type (Fixed/Flat-Rate, Time-Of-Use, Dynamic/Real-Time, Green/Renewable-Backed, and Subscription-Based), End-User (Residential, Commercial, and Industrial), and Geography (North America, Europe, Asia-Pacific, South America, and Middle East and Africa). The Market Sizes and Forecasts are Provided in Terms of Value (USD).
Global Electricity Retailing Market Trends and Insights
Surging EV-Charging Load in Urban Grids
Electric vehicle uptake is reshaping urban demand curves, with California expected to have more than 2 million EVs on the road by 2025 and projections indicating 12.5 million units on the road by 2035. North American utilities reported capital expenditures for charging infrastructure in 2024 that nearly doubled the prior-year outlays, underscoring the scale of electrification momentum. Load flexibility programs are enabling data-center operators to curtail usage at peak times to secure interconnection, and pilot virtual power plant (VPP) projects in Texas have demonstrated 40% customer-bill savings when batteries are charged during low-price hours and then discharged during system peaks.These initiatives highlight how the electricity retailing market is evolving toward bidirectional, service-rich models.
Digitally Enabled Switching & Price-Comparison Portals
Consumer access to real-time offers expanded rapidly; by 2025, 90% of UK households were aware of time-of-use tariffs, even though fewer than half were inclined to switch. Germany is legislating mandatory dynamic tariffs by 2025, creating space for algorithmic advisers that help end-users align their consumption with renewable output patterns. Retailers that built intuitive, app-based journeys achieved reduced churn while attracting digitally savvy customers, thereby accentuating platform competition across the electricity retailing market.
Margin Squeeze from Regulated Default Tariffs & Price Caps
The Australian Default Market Offer for 2025-26 increased residential tariff ceilings by up to 8.9%, reflecting higher wholesale-cost pass-through while restricting retailer margin upside. German household prices averaged EUR 0.4519 per kWh in 2024, with more than half attributable to taxes and levies, thereby compressing the retailer differentiation potential. Similar interventions in South Korea saddled incumbent KEPCO with mounting debt, underscoring how policy objectives can distort the electricity retailing market's risk-return profile.
Other drivers and restraints analyzed in the detailed report include:
- Universal Smart-Meter Roll-Outs (EU, AUS, JP)
- Retailer Entry into Behind-the-Meter BESS Aggregation
- Credit-Risk Spike Amid Rising Household Energy Debt
For complete list of drivers and restraints, kindly check the Table Of Contents.
Segment Analysis
Fixed/Flat-Rate plans maintained a 44.61% share in 2025 as households prioritised bill certainty amid price volatility. Green/Renewable-backed offers grew at a 7.38% CAGR, propelled by corporate supply chains seeking low-carbon Scope 2 footprints and consumers aligning their lifestyle choices with climate values. Spanish households on the regulated dynamic tariff saved 8-11% annually when shifting usage to solar-rich afternoon hours. Dynamic/Real-Time pricing, still niche, flourished where smart-meters covered virtually all endpoints, notably in Sweden and Finland. Subscription-style Energy-as-a-Service models, exemplified by ABB's zero-capex battery bundle, represent the electricity retailing market's shift from commodity sales to integrated solutions.
The competitive arena increasingly prizes digital engagement and behavioural insights. Retailers investing in AI-driven usage forecasting and gamified mobile dashboards report churn rates that are 40% lower than those of their peers. In deregulated US states, app-based brands have captured millennials by combining renewable offsets with cashback loyalty, reaffirming that customer experience, rather than tariff mechanics, drives differentiation across the electricity retailing industry.
Complete Report Scope:
- By Tariff Type
- Fixed/Flat-Rate
- Time-of-Use (ToU)
- Dynamic/Real-Time
- Green/Renewable-Backed
- Subscription-Based (EaaS)
- By End-User
- Residential
- Commercial
- Industrial
- By Geography
- North America
- United States
- Canada
- Mexico
- Europe
- Germany
- United Kingdom
- France
- Italy
- NORDIC Countries
- Russia
- Rest of Europe
- Asia-Pacific
- China
- India
- Japan
- South Korea
- ASEAN Countries
- Rest of Asia-Pacific
- South America
- Brazil
- Argentina
- Rest of South America
- Middle East and Africa
- Saudi Arabia
- United Arab Emirates
- South Africa
- Egypt
- Rest of Middle East and Africa
- North America
Geography Analysis
Asia-Pacific led with 46.02% share and a 5.72% CAGR outlook, undergirded by Guangdong's 650 billion kWh provincial exchange and India's renewable buildout pipeline exceeding 70 GW. Widening wholesale-retail spreads in Japan and South Korea attract fintech-enabled entrants despite tariff-cap uncertainties.
Europe grappled with structurally high taxes and levies that comprised 54% of German household bills in 2024; however, advanced grid digitalization offers a platform for dynamic pricing and demand response. Nordic retailers leverage near-100% smart-meter coverage to market hourly green certificates, illustrating how innovation offsets regulatory drag.
North America experienced unprecedented commercial load requests-Xcel Energy alone reviewed 6.7 GW of data center interconnection proposals-while abundant gas and accelerating renewables cushioned wholesale cost spikes. State-by-state regulation produces a mosaic of risk-return profiles, but healthy liquidity and sophisticated hedging underpin a robust electricity retailing market size for investors.
- State Grid Corporation of China
- Enel S.p.A.
- Electricite de France (EDF)
- E.ON SE
- Iberdrola SA
- Engie SA
- Duke Energy Corp.
- Southern Company
- Xcel Energy
- AGL Energy Ltd.
- Origin Energy
- NRG Energy Inc.
- NextEra Energy
- KEPCO
- China Huadian Corp.
- Tata Power
- CLP Holdings
- Octopus Energy
- EnBW
- Fortum Oyj
Additional Benefits:
- The market estimate (ME) sheet in Excel format
- 3 months of analyst support
TABLE OF CONTENTS
1 Introduction
- 1.1 Study Assumptions & Market Definition
- 1.2 Scope of the Study
2 Research Methodology
3 Executive Summary
4 Market Landscape
- 4.1 Market Overview
- 4.2 Market Drivers
- 4.2.1 Surging EV-charging load in urban grids
- 4.2.2 Digitally enabled switching & price-comparison portals
- 4.2.3 Universal smart-meter roll-outs (EU, AUS, JP)
- 4.2.4 Retailer entry into behind-the-meter BESS aggregation
- 4.2.5 Blockchain-based peer-to-peer energy trading pilots
- 4.2.6 Corporate 24/7 renewable PPAs becoming retail products
- 4.3 Market Restraints
- 4.3.1 Margin squeeze from regulated default tariffs & price caps
- 4.3.2 Load erosion from prosumer self-consumption (rooftop PV)
- 4.3.3 Credit-risk spike amid rising household energy debt
- 4.3.4 Grid-usage levies on retailers in high-RES markets
- 4.4 Supply-Chain Analysis
- 4.5 Regulatory Landscape
- 4.6 Technological Outlook
- 4.7 Porter's Five Forces
- 4.7.1 Bargaining Power of Suppliers
- 4.7.2 Bargaining Power of Consumers
- 4.7.3 Threat of New Entrants
- 4.7.4 Threat of Substitute Products & Services
- 4.7.5 Intensity of Competitive Rivalry
5 Market Size & Growth Forecasts
- 5.1 By Tariff Type
- 5.1.1 Fixed/Flat-Rate
- 5.1.2 Time-of-Use (ToU)
- 5.1.3 Dynamic/Real-Time
- 5.1.4 Green/Renewable-Backed
- 5.1.5 Subscription-Based (EaaS)
- 5.2 By End-User
- 5.2.1 Residential
- 5.2.2 Commercial
- 5.2.3 Industrial
- 5.3 By Geography
- 5.3.1 North America
- 5.3.1.1 United States
- 5.3.1.2 Canada
- 5.3.1.3 Mexico
- 5.3.2 Europe
- 5.3.2.1 Germany
- 5.3.2.2 United Kingdom
- 5.3.2.3 France
- 5.3.2.4 Italy
- 5.3.2.5 NORDIC Countries
- 5.3.2.6 Russia
- 5.3.2.7 Rest of Europe
- 5.3.3 Asia-Pacific
- 5.3.3.1 China
- 5.3.3.2 India
- 5.3.3.3 Japan
- 5.3.3.4 South Korea
- 5.3.3.5 ASEAN Countries
- 5.3.3.6 Rest of Asia-Pacific
- 5.3.4 South America
- 5.3.4.1 Brazil
- 5.3.4.2 Argentina
- 5.3.4.3 Rest of South America
- 5.3.5 Middle East and Africa
- 5.3.5.1 Saudi Arabia
- 5.3.5.2 United Arab Emirates
- 5.3.5.3 South Africa
- 5.3.5.4 Egypt
- 5.3.5.5 Rest of Middle East and Africa
- 5.3.1 North America
6 Competitive Landscape
- 6.1 Market Concentration
- 6.2 Strategic Moves (M&A, Partnerships, PPAs)
- 6.3 Market Share Analysis (Market Rank/Share for key companies)
- 6.4 Company Profiles (includes Global level Overview, Market level overview, Core Segments, Financials as available, Strategic Information, Products & Services, and Recent Developments)
- 6.4.1 State Grid Corporation of China
- 6.4.2 Enel S.p.A.
- 6.4.3 Electricite de France (EDF)
- 6.4.4 E.ON SE
- 6.4.5 Iberdrola SA
- 6.4.6 Engie SA
- 6.4.7 Duke Energy Corp.
- 6.4.8 Southern Company
- 6.4.9 Xcel Energy
- 6.4.10 AGL Energy Ltd.
- 6.4.11 Origin Energy
- 6.4.12 NRG Energy Inc.
- 6.4.13 NextEra Energy
- 6.4.14 KEPCO
- 6.4.15 China Huadian Corp.
- 6.4.16 Tata Power
- 6.4.17 CLP Holdings
- 6.4.18 Octopus Energy
- 6.4.19 EnBW
- 6.4.20 Fortum Oyj
7 Market Opportunities & Future Outlook
- 7.1 White-space & Unmet-Need Assessment


