

|
시장보고서
상품코드
2125696
디지털 트러스트 시장 : 시장 점유율 분석, 업계 동향 및 통계, 성장 예측(2026-2031년)Digital Trust - Market Share Analysis, Industry Trends & Statistics, Growth Forecasts (2026 - 2031) |
||||||
 Mordor Intelligence
Mordor Intelligence에 의하면, 디지털 트러스트 시장 규모는 2025년에 4,719억 6,000만 달러로 평가되었고, 2026년에 5,505억 8,000만 달러로 추정되고, 2031년까지 1조 731억 8,000만 달러에 이를 것으로 예측되며, 2026-2031년 CAGR 14.28%로 성장할 전망입니다.
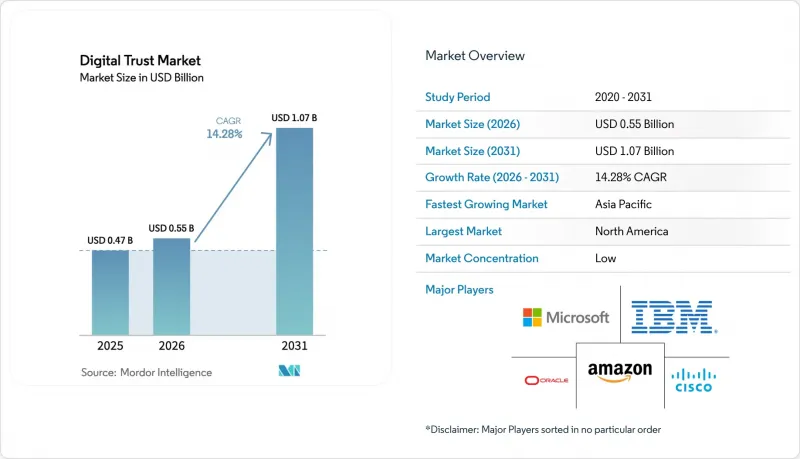
본 보고서는 구성 요소별(솔루션 및 서비스), 배포 방식별(클라우드 기반, 온프레미스), 조직 규모별(대기업 및 중소기업), 최종 사용자 산업별(은행 및 금융 서비스·보험(BFSI), 헬스케어, IT 및 통신, 정부·공공 부문, 소매 및 전자상거래, 기타), 지역별로 분류되어 있습니다. 시장 예측은 금액(달러) 기준으로 제시되어 있습니다.
세계의 디지털 트러스트 시장 동향 및 인사이트
데이터 침해 발생 빈도 및 비용 증가
2024년 데이터 침해로 인한 평균 비용은 488만 달러에 달했으며, 미국 기업의 경우 936만 달러로 급증했습니다. 이에 따라 보안 투자의 위상은 ‘선택적 지출’에서 ‘필수 지출’로 변화했습니다. 데이터 유출을 겪은 기업의 주가는 90일 이내에 7.5% 하락했고, 고객 이탈률은 3.2포인트 상승하여 비즈니스상의 위험이 더욱 커지고 있습니다. 97%의 조직에서 섀도 AI 도입에 대한 견고한 관리 체제가 부재하며, 이것이 첫 번째 공격 경로로 악용될 경우 추정 67만 달러의 추가 비용이 발생합니다. 현재 ID를 표적으로 한 침입이 주류를 이루고 있으며, 2024년 데이터 침해의 80%는 소프트웨어 결함이 아닌 인증 정보 유출에서 기인합니다. 미국 증권거래위원회(SEC)가 정한 ‘영업일 기준 4일 이내 사고 보고’와 같은 더욱 엄격한 공시 의무로 인해 피해 확산 억제 기간이 단축되면서, 완전 자동화된 대응 플랫폼에 대한 수요가 높아지고 있습니다.
전 세계 개인정보 및 전자 ID 관련 규제의 확대
유럽연합(EU)의 eIDAS 2.0에서는 회원국들에게 2026년까지 상호 운용 가능한 디지털 지갑의 보급을 의무화하고 있으며, 벤더들은 새로 공표된 인증 정보 스키마를 준수해야 합니다. 인도의 ‘디지털 개인 데이터 보호법’에서는 세밀한 동의 로그 기록이 의무화되어, 동의 오케스트레이션 엔진의 도입이 가속화되고 있습니다. 중국의 ‘개인정보 보호법’은 국경 간 전송을 제한하고 있어, 기밀성이 높은 속성을 로컬에서 토큰화하는 하이브리드 아키텍처의 도입을 촉진하고 있습니다. 싱가포르의 ‘신뢰할 수 있는 데이터 공유 프레임워크’는 OAuth 2.0과 OpenID Connect를 필수로 규정하여 업계 모범 사례를 제도화하고 있습니다. 이러한 규제 차이는 다국적 기업의 통합 비용을 증가시키는 한편, 정책을 동적으로 적용하는 컴플라이언스 엔진의 대상 시장을 확대하는 결과로 이어집니다.
초기 통합 및 라이선싱 비용
종합적인 신원 확인 및 거버넌스 프로젝트에는 50만 달러에서 500만 달러의 자본 지출이 필요하며, 연간 라이선스 비용이 그 금액의 18%-22%를 추가로 발생시키므로, 직원 수 1만 명 이상의 기업에서는 5년간의 총 소유 비용이 1,000만 달러를 초과하게 됩니다. 중소기업은 예산 부족을 가장 큰 장벽으로 꼽고 있으며, 68%는 각 제품을 비교할 수 있는 사내 전문 지식이 부족하고, 54%는 벤더 종속을 우려하고 있습니다. 통합 업체가 레거시 메인프레임이나 맞춤형 용도를 개조하기 때문에 전문 서비스 비용이 프로젝트 예산의 최대 60%를 차지하고 있습니다. 사용자 1인당월3-12달러의 SaaS 가격 정책은 도입 장벽을 낮추며, 다중 요소 인증에 대한 최대 15%의 사이버 보험 할인으로 인해 투자 회수 기간은 2년 이하로 단축됩니다. 그럼에도 불구하고, 많은 중견 기업의 구매 담당자들은 외부 감사인이나 보험사에서 의무화할 때까지 고도화된 보안 대책의 도입을 미루고 있습니다.
부문 분석
기업들이 소프트웨어 구매가 어디까지나 ‘첫걸음’에 불과하다는 것을 인식함에 따라 서비스에 대한 수요가 가속화되고 있습니다. 2025년, 디지털 트러스트 시장에서 솔루션의 점유율은 57.82%였으나, 도입, 통합, 24시간 모니터링에 대한 수요 증가를 반영하여 서비스는 연평균 성장률(CAGR) 14.99%로 솔루션을 능가하는 성장이 예상됩니다. MDR(Managed Detection and Response) 계약의 연간 평균 금액은 현재 15만-200만 달러이며, 위협 인텔리전스, 사고 대응, 규정 준수 대시보드가 패키지로 제공됩니다. 전문 서비스 계약 기간은 보통 6-12개월이며, 컨설턴트가 역할을 모델링하거나 레거시 코드를 개조하기 때문에 프로젝트 비용의 최대 60%를 차지하기도 합니다. 제로 트러스트 도입 시 이사회가 신뢰 경계의 지도를 요구하는 경우, 자문 서비스에 대한 수요가 급증하고 있습니다. 각 벤더사는 교육 사업을 수익화하고 있으며, 인증 과정 수강생 1인당 2,000-5,000달러의 수강료를 징수함으로써 고객 유지율을 높이고 있습니다. 규제가 복잡해짐에 따라 구매자는 라이선스 기능을 단계적으로 추가하는 방식이 아닌, 온디맨드 방식으로 정책을 조정할 수 있는 파트너를 찾고 있습니다.
매니지드 서비스 분야의 디지털 트러스트 시장 규모는 2031년까지 총 가치에서 차지하는 비중이 확대될 것으로 예측됩니다. 이는 지속적인 거버넌스, 리스크, 규정 준수 점검이 전문 지식 없이는 완전히 자동화될 수 없기 때문입니다. ML(머신러닝) 기반 감지 규칙을 통합하고, 익명화된 텔레메트리 데이터를 공유 모델에 피드백하는 벤더는 모든 고객의 정확도를 향상시키고, 네트워크 효과를 통한 경쟁 우위를 강화하고 있습니다. 기업들은 기능의 수가 아니라 문제 격리까지 걸리는 시간이나 감사 대응 준비 상황을 평가 기준으로 삼고 있으며, 예산을 성과 기반 서비스 수준 계약(SLA)에 할당하고 있습니다. 그 결과, 규모의 경제가 발휘되기 시작하면 서비스 제공업체의 이익률은 소프트웨어 전문 기업에 필적하는 수준이 됩니다.
클라우드 기반 플랫폼은 2025년 디지털 트러스트 시장 점유율의 71.37%를 차지했으며, 구매자들이 탄력성과 지속적인 업데이트를 요구함에 따라 연평균 성장률(CAGR) 14.76%로 성장할 전망입니다. Microsoft, Okta, Ping 각사가 제공하는 ‘IDaaS(Identity-as-a-Service)’는 사용자 단위 과금 체계를 채택하여 자본 지출(CAPEX)을 배제하는 동시에 지속적인 기능 제공을 실현하고 있습니다. 온프레미스 도입 규모는 예산 주기마다 축소되고 있지만, 주권 관련 규제의 제약을 받는 국방, 중요 인프라, 의료 분야에서는 여전히 유지되고 있습니다. 그 결과 하이브리드 구성이 주류를 이루고 있으며, 기업들은 OAuth 2.0, SAML 2.0, OpenID Connect를 활용하여 Active Directory, SaaS 포털, 멀티 클라우드 워크로드 간에 인증을 연동하고 있습니다.
기업들이 ‘리프트 앤 브레이크(lift-and-break)’로 인한 혼란을 피하기 위해 단계적인 전환을 추진함에 따라, 하이브리드 구성에 할당되는 디지털 트러스트 시장 규모는 확대되고 있습니다. NIST SP 800-207A는 데이터센터 내부와 퍼블릭 클라우드 테넌트 내부 양쪽 모두에 정책 적용 지점을 규정하여 일관된 액세스 결정을 보장합니다. 중앙 집중식 정책 엔진은 비밀번호 동기화를 제거하고 싱글 사인온(SSO)을 구현함으로써 공격 표면을 축소합니다. 하이퍼스케일 기업들이 네이티브 ID 관리 도구를 인프라 구독에 통합하는 가운데, 독립 벤더들은 위험 기반 적응형 요소의 심도, 머신 러닝(ML)을 활용한 이상 징후 점수 산정, 분산형 지갑 발행과 같은 부문에서 경쟁을 펼치고 있습니다.
지역별 분석
북미는 지역별 최대 매출을 창출하며, 2025년 디지털 트러스트 시장 점유율의 38.01%를 차지하였고, 연평균 성장률(CAGR) 13.9%로 확대되고 있습니다. 미국 증권거래위원회(SEC)의 새로운 정보 유출 공개 규정에 따라 상장 기업은 ID 로그를 자동으로 수집하는 사고 대응 워크플로우를 운영해야 할 의무가 생겨 도입 주기가 단축되고 있습니다. 캐나다의 개정된 주 개인정보 보호법은 EU의 의무를 반영하여 세분화된 동의 기록을 의무화하고 있으므로, 다국적 기업들은 여러 관할 구역을 아우르는 통합된 정책 엔진을 도입해야 하는 상황에 직면해 있습니다. 연방 및 주 정부 기관들도 제로 트러스트 시범 사업에 자금을 지원하고 있으며, 그 영향은 인접한 상업 시장으로도 파급되고 있습니다.
아시아태평양은 대규모 디지털 ID 체계가 전개됨에 따라 연평균 성장률(CAGR) 15.11%로 가장 빠르게 성장하고 있는 지역입니다. 인도 법률에서는 국내 데이터 저장 및 명시적인 허가 제시를 의무화하고 있으며, 이로 인해 국경을 넘어 기밀 속성을 복제하는 것을 방지하는 현지 데이터센터 건설 및 토큰화 엔진이 촉진되고 있습니다. 중국의 데이터 이전 규제로 인해, 개인 데이터를 국내에 보관하면서 전 세계 직원의 인증을 수행하는 하이브리드 ID 패브릭이 필수적입니다. 일본은 국경 간 데이터 전송에 관한 규제를 강화하여, 동의 관리 및 감사 자동화 도구에 대한 수요를 높이고 있습니다. 싱가포르는 OAuth 2.0과 OpenID Connect를 국가 프레임워크에 통합하여 벤더 아키텍처를 개방형 표준으로 정착시켰습니다. 아세안(ASEAN)의 신흥 경제국에서는 GDPR(EU 개인정보보호규정)을 참고한 법률 초안이 작성되고 있어, 지역 컴플라이언스 허브를 위한 잠재 시장이 확대되고 있습니다.
유럽은 2025년 매출의 24.3%를 차지했으며, 2026년까지 모든 시민이 상호 운용 가능한 전자 지갑을 보유하도록 의무화하는 eIDAS 2.0 요건을 배경으로 연평균 성장률(CAGR) 14.2%의 궤도에 올라 있습니다. 독일 연방정보보안청은 제로 트러스트 지침을 발표했으며, 현재 중요 인프라 전반의 조달에 영향을 미치고 있습니다. 영국은 GDPR(EU 개인정보보호규정)과 동등한 요건을 유지하고 있어, 규정 준수 관련 지출은 높은 수준을 유지하고 있습니다. 프랑스 데이터 보호 당국은 2023년, 쿠키 동의 관련 위반에 대해 2억 1,400만 유로(2억 2,800만 달러)의 벌금을 부과하며 법 집행의 엄격함을 보여주었습니다. 남미는 4.8%의 점유율로 아직 발전 단계에 있지만, 브라질의 LGPD가 성숙해짐에 따라 14.6%의 성장세를 보이고 있습니다. 중동 및 아프리카는 15.3%의 성장률을 기록하고 있으며, 이를 주도하는 요인은 검증 가능한 자격 정보와 지속적인 인증을 중시하는 걸프 국가들의 블록체인 프로그램과 남아프리카공화국의 POPIA입니다.
기타 혜택
- 엑셀 형식 시장 예측(ME) 시트
- 3개월간의 애널리스트 지원
자주 묻는 질문
목차
제1장 서론
제2장 조사 방법
제3장 주요 요약
제4장 시장 구도
제5장 시장 규모 및 성장 예측
제6장 경쟁 구도
제7장 시장 기회 및 향후 전망
AJY 26.09.15According to Mordor Intelligence, the digital trust market size is projected to be USD 471.96 billion in 2025, USD 550.58 billion in 2026, and reach USD 1,073.18 billion by 2031, growing at a CAGR of 14.28% from 2026 to 2031.

This report is Segmented by Component (Solutions, and Services), Deployment Mode (Cloud-Based, and On-Premises), Organization Size (Large Enterprises, and Small and Medium-Sized Enterprises), End-User Industry (BFSI, Healthcare, IT and Telecommunications, Government and Public Sector, Retail and E-Commerce, and More), and Geography. The Market Forecasts are Provided in Terms of Value (USD).
Global Digital Trust Market Trends and Insights
Rising Frequency and Cost of Data Breaches
Average breach costs hit USD 4.88 million in 2024 and escalated to USD 9.36 million for United States firms, pushing security investments from discretionary to essential. Stock prices of breached companies fell 7.5% within 90 days, while customer churn rose 3.2 percentage points, amplifying the commercial stakes. Shadow AI deployments lack robust controls at 97% of organizations, adding an estimated USD 670,000 when exploited as the first attack vector. Identity-based incursions now dominate, with 80% of 2024 breaches tied to compromised credentials rather than software flaws. Stricter disclosure mandates, such as the United States Securities and Exchange Commission rule requiring incident reports within four business days, compress containment windows and heighten demand for fully automated response platforms.
Expanding Global Privacy and e-ID Regulations
The European Union's eIDAS 2.0 obliges member states to distribute interoperable digital wallets by 2026, compelling vendors to align with newly published credential schemas. India's Digital Personal Data Protection Act enforces granular consent logs and accelerates uptake of consent-orchestration engines. China's Personal Information Protection Law restricts cross-border transfers, driving hybrid architectures that tokenize sensitive attributes locally. Singapore's Trusted Data Sharing Framework codifies OAuth 2.0 and OpenID Connect as mandatory, institutionalizing industry best practice. Such divergence raises integration costs for multinationals, yet it also enlarges the addressable market for compliance engines that adapt policies dynamically.
Up-Front Integration and Licensing Costs
Comprehensive identity-governance projects demand capital outlays between USD 500,000 and USD 5 million, while annual licenses add 18%-22% of that figure, pushing five-year ownership above USD 10 million for enterprises with more than 10,000 employees. SMEs indicate budget shortfalls as the chief barrier, with 68% lacking internal expertise to compare offerings and 54% fearing vendor lock-in. Professional-services fees swallow up to 60% of project budgets as integrators retrofit legacy mainframes and custom applications. SaaS pricing from USD 3 to USD 12 per user per month eases entry, and cyber-insurance discounts of up to 15% for multi-factor authentication shorten payback to under two years. Even so, many mid-market buyers postpone advanced controls until external auditors or insurance carriers mandate them.
Other drivers and restraints analyzed in the detailed report include:
- Rapid Cloud Adoption Triggering Zero-Trust Rollouts
- **AI and ML-Powered Fraud Detection Becoming Table-Stakes
- Fragmented Regulatory and Standards Landscape
For complete list of drivers and restraints, kindly check the Table Of Contents.
Segment Analysis
Services are accelerating as enterprises realize that buying software is only the first mile. In 2025 the digital trust market share of solutions stood at 57.82%, but services are forecast to outpace them at a 14.99% CAGR, reflecting rising demand for deployment, integration, and 24-hour monitoring. Managed detection and response contracts now average USD 150,000-USD 2 million per year, bundling threat intelligence, incident response, and compliance dashboards. Professional-services engagements typically run 6-12 months and swallow up to 60% of project spend as consultants model roles and retrofit legacy code. Advisory service demand is spiking where boards seek maps of trust boundaries for zero-trust rollouts. Vendors are monetizing education, charging USD 2,000-USD 5,000 per attendee for certification courses, deepening customer stickiness. As regulation multiplies, buyers look for partners who can tune policies on demand rather than incremental license features.
The digital trust market size for managed services is projected to command a growing slice of total value through 2031, because continuous governance, risk, and compliance checks cannot be fully automated without domain expertise. Vendors that embed ML-based detection rules and feed anonymized telemetry back into shared models improve accuracy for all customers, reinforcing a network-effects moat. Enterprises benchmark time-to-containment and audit-readiness rather than feature counts, steering budgets toward outcome-based service level agreements. Consequently, margin profiles for service providers rival software pure plays once scale efficiencies kick in.
Cloud-based platforms held 71.37% of 2025 digital trust market share and will expand at a 14.76% CAGR as buyers chase elasticity and evergreen updates. Identity-as-a-service offerings from Microsoft, Okta, and Ping supply per-user billing that eliminates capital expense and delivers continuous feature rollouts. On-premises footprints shrink each budget cycle, yet they persist in defense, critical-infrastructure, and healthcare domains constrained by sovereignty mandates. Hybrid blueprints therefore dominate enterprises federate authentication across Active Directory, SaaS portals, and multi-cloud workloads using OAuth 2.0, SAML 2.0, and OpenID Connect.
The digital trust market size allocated to hybrid configurations rises as firms migrate stepwise to avoid "lift-and-break" disruptions. NIST SP 800-207A prescribes policy-enforcement points both inside data centers and within public-cloud tenants, ensuring uniform access decisions. Centralized policy engines lower attack surfaces by removing password synchronization and enabling single sign-on. As hyperscale's bundle native identity tools into infrastructure subscriptions, standalone vendors compete on depth risk-based adaptive factors, ML-driven anomaly scoring, and decentralized-wallet issuance.
Complete Report Scope:
- By Component
- Solutions
- Services
- By Deployment Mode
- Cloud-Based
- On-Premises
- By Organization Size
- Large Enterprises
- Small and Medium-Sized Enterprises (SMEs)
- By End-User Industry
- Banking, Financial Services and Insurance (BFSI)
- Healthcare
- IT and Telecommunications
- Government and Public Sector
- Retail and E-Commerce
- Energy and Utilities
- Other Industries
- By Geography
- North America
- United States
- Canada
- Mexico
- South America
- Brazil
- Argentina
- Rest of South America
- Europe
- Germany
- United Kingdom
- France
- Italy
- Spain
- Rest of Europe
- Asia-Pacific
- China
- Japan
- India
- South Korea
- Southeast Asia
- Rest of Asia-Pacific
- Middle East and Africa
- Middle East
- Africa
- North America
Geography Analysis
North America generated the largest regional revenue, accounting for 38.01% of 2025 digital trust market share and expanding at a 13.9% CAGR. The new United States Securities and Exchange Commission breach-disclosure rule forces public firms to operationalize incident response workflows that automatically capture identity logs, compressing adoption cycles. Canada's updated provincial privacy statutes mirror EU obligations and require granular consent records, pushing multinational companies toward unified, multi-jurisdictional policy engines. Federal and state agencies also fund zero-trust pilots, which spill over into adjacent commercial markets.
Asia-Pacific is the fastest-growing territory at a 15.11% CAGR as population-scale digital-ID schemes roll out. India's law compels in-country data stores and explicit permission prompts, stimulating local datacenter builds and tokenization engines that avoid replicating sensitive attributes across borders. China's transfer restrictions necessitate hybrid identity fabrics that keep personal data onshore while still authenticating global employees. Japan tightened its cross-border transfer rules, boosting demand for consent orchestration and audit automation tools. Singapore embedded OAuth 2.0 and OpenID Connect in its national framework, anchoring vendor architectures in open standards. Emerging ASEAN economies are drafting GDPR-inspired acts, expanding the addressable market for regional compliance hubs.
Europe held 24.3% of 2025 revenue and is on a 14.2% CAGR trajectory amid eIDAS 2.0 mandates that every citizen hold an interoperable wallet by 2026. Germany's federal security agency published zero-trust guidelines that now influence procurement across critical infrastructure. The United Kingdom retained GDPR-equivalent requirements, sustaining high compliance spend. France's data-protection authority levied EUR 214 million (USD 228 million) in cookie-consent fines during 2023, proving enforcement teeth. South America remains nascent at 4.8% share but climbs 14.6% as Brazil's LGPD matures. The Middle East and Africa log 15.3% growth, led by Gulf blockchain programs and South Africa's POPIA, both of which prioritize verifiable credentials and continuous authentication.
- Microsoft Corporation
- International Business Machines Corporation (IBM)
- Cisco Systems, Inc.
- Amazon Web Services, Inc.
- Oracle Corporation
- Thales Group
- Entrust Corporation
- DigiCert, Inc.
- Broadcom Inc. (Symantec)
- Okta, Inc.
- DocuSign, Inc.
- Ping Identity Holding Corp.
- OneTrust, LLC
- Trulioo Information Services Inc.
- Jumio Corporation
- Mitek Systems, Inc.
- Onfido Ltd.
- CyberArk Software Ltd.
- Palo Alto Networks, Inc.
- Sift Science, Inc.
Additional Benefits:
- The market estimate (ME) sheet in Excel format
- 3 months of analyst support
TABLE OF CONTENTS
1 INTRODUCTION
- 1.1 Study Assumptions And Market Definition
- 1.2 Scope of the Study
2 RESEARCH METHODOLOGY
3 EXECUTIVE SUMMARY
4 MARKET LANDSCAPE
- 4.1 Market Overview
- 4.2 Market Drivers
- 4.2.1 Rising Frequency and Cost of Data Breaches
- 4.2.2 Expanding Global Privacy and e-ID Regulations
- 4.2.3 Rapid Cloud Adoption Triggering Zero-Trust Roll-Outs
- 4.2.4 AI/ML-Powered Fraud Detection Becoming Table-Stakes
- 4.2.5 Emergence of Reusable, Portable Digital Identities
- 4.2.6 Machine-to-Machine Trust Needs in Smart Factories
- 4.3 Market Restraints
- 4.3.1 Up-Front Integration and Licensing Costs
- 4.3.2 Fragmented Regulatory and Standards Landscape
- 4.3.3 Consumer Consent Fatigue Eroding Engagement
- 4.3.4 Limited High-Quality Labelled Data for Trust-and-Safety AI
- 4.4 Industry Value-Chain Analysis
- 4.5 Regulatory Landscape
- 4.6 Technological Outlook
- 4.7 Porter's Five Forces Analysis
- 4.7.1 Bargaining Power of Buyers
- 4.7.2 Bargaining Power of Suppliers
- 4.7.3 Threat of New Entrants
- 4.7.4 Threat of Substitutes
- 4.7.5 Intensity of Competitive Rivalry
- 4.8 Impact of Macroeconomic Factors on the Market
5 MARKET SIZE AND GROWTH FORECASTS (VALUE)
- 5.1 By Component
- 5.1.1 Solutions
- 5.1.2 Services
- 5.2 By Deployment Mode
- 5.2.1 Cloud-Based
- 5.2.2 On-Premises
- 5.3 By Organization Size
- 5.3.1 Large Enterprises
- 5.3.2 Small and Medium-Sized Enterprises (SMEs)
- 5.4 By End-User Industry
- 5.4.1 Banking, Financial Services and Insurance (BFSI)
- 5.4.2 Healthcare
- 5.4.3 IT and Telecommunications
- 5.4.4 Government and Public Sector
- 5.4.5 Retail and E-Commerce
- 5.4.6 Energy and Utilities
- 5.4.7 Other Industries
- 5.5 By Geography
- 5.5.1 North America
- 5.5.1.1 United States
- 5.5.1.2 Canada
- 5.5.1.3 Mexico
- 5.5.2 South America
- 5.5.2.1 Brazil
- 5.5.2.2 Argentina
- 5.5.2.3 Rest of South America
- 5.5.3 Europe
- 5.5.3.1 Germany
- 5.5.3.2 United Kingdom
- 5.5.3.3 France
- 5.5.3.4 Italy
- 5.5.3.5 Spain
- 5.5.3.6 Rest of Europe
- 5.5.4 Asia-Pacific
- 5.5.4.1 China
- 5.5.4.2 Japan
- 5.5.4.3 India
- 5.5.4.4 South Korea
- 5.5.4.5 Southeast Asia
- 5.5.4.6 Rest of Asia-Pacific
- 5.5.5 Middle East and Africa
- 5.5.5.1 Middle East
- 5.5.5.2 Africa
- 5.5.1 North America
6 COMPETITIVE LANDSCAPE
- 6.1 Market Concentration
- 6.2 Strategic Moves
- 6.3 Market Share Analysis
- 6.4 Company Profiles (includes Global Level Overview, Market Level Overview, Core Segments, Financials as available, Strategic Information, Market Rank/Share, Products and Services, Recent Developments)
- 6.4.1 Microsoft Corporation
- 6.4.2 International Business Machines Corporation (IBM)
- 6.4.3 Cisco Systems, Inc.
- 6.4.4 Amazon Web Services, Inc.
- 6.4.5 Oracle Corporation
- 6.4.6 Thales Group
- 6.4.7 Entrust Corporation
- 6.4.8 DigiCert, Inc.
- 6.4.9 Broadcom Inc. (Symantec)
- 6.4.10 Okta, Inc.
- 6.4.11 DocuSign, Inc.
- 6.4.12 Ping Identity Holding Corp.
- 6.4.13 OneTrust, LLC
- 6.4.14 Trulioo Information Services Inc.
- 6.4.15 Jumio Corporation
- 6.4.16 Mitek Systems, Inc.
- 6.4.17 Onfido Ltd.
- 6.4.18 CyberArk Software Ltd.
- 6.4.19 Palo Alto Networks, Inc.
- 6.4.20 Sift Science, Inc.
7 MARKET OPPORTUNITIES AND FUTURE OUTLOOK
- 7.1 White-Space And Unmet-Need Assessment


