

|
시장보고서
상품코드
2156969
헬스케어 상환 : 시장 점유율 분석, 업계 동향과 통계, 성장 예측(2026-2031년)Healthcare Reimbursement - Market Share Analysis, Industry Trends & Statistics, Growth Forecasts (2026 - 2031) |
||||||
 Mordor Intelligence
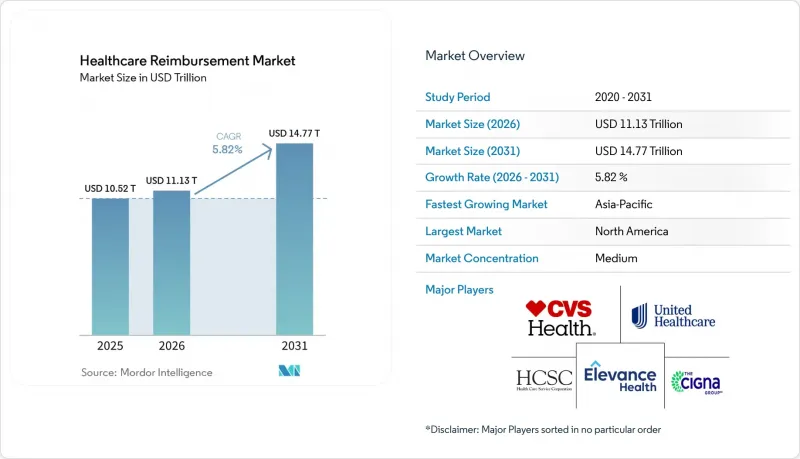
에 따르면 의료비 상환 시장 규모는 2025년 10조 5,200억 달러, 2026년 11조 1,300억 달러에서 2031년까지 14조 7,700억 달러로 확대될 것으로 예측되고 있으며, 2026-2031년까지 CAGR은 5.82%에 달할 전망입니다.
전 세계 의료비 상환 시장의 동향 및 인사이트
가치 기반 의료 모델의 확대
가치 기반 헬스케어는 의료비 상환 시장에 진출한 기업이 지불액을 측정, 청구 및 대조하는 방식을 변화시키고 있습니다. CMS(미국 의료보험 및 의료보조 서비스 센터)의 ‘공유 절감 프로그램(Shared Savings Program)’에는 2026년 1월 기준으로, 기존 메디케어 수혜자 1,260만 명을 대상으로 하는 511개의 책임의료기구(ACO)가 참여하고 있었습니다. 참여 수는 2025년 대비 12.3% 증가했으며, 공유 절감 계약 하에서 활동하는 조직의 수도 확대되었습니다. 이러한 계약에서는 일반적인 종량제 청구를 넘어 품질 보고, 귀속 관리 및 지급 대조 등이 요구됩니다. CMS는 2026년(CY2026) 적격 대체 지불 모델(APM)의 환산율을 상대 가치 단위(RVU)당 33.57달러로 설정했습니다. 이는 2025년 대비 3.77% 증가한 수치입니다. 따라서 의료 제공자들은 기존의 청구 절차와 성과 연계형 계약을 모두 지원할 수 있는 지불 시스템이 필요합니다.
급등하는 의료 서비스 및 치료비
의료비 급등으로 인해 의료 제공자들은 계약에 따라 인정된 전액을 회수해야 한다는 압박이 커지고 있습니다. 2025년에는 병원 경비가 7.5% 증가한 반면, 약품비는 13.6%, 의료 자재비는 9.9% 상승했습니다. 미국병원협회(AHA) 보고서에 따르면 병원 비용의 56%는 보상액이 의료비를 충당하지 못하는 진료 분야와 관련이 있었습니다. 이러한 격차로 인해 의료 보상 시장 전반에서 적시 청구 정보 파악, 정확한 코딩, 그리고 청구 거절에 대한 후속 조치가 더욱 중요해지고 있습니다. 의약품비나 외래 치료에 대해서도 사전 승인이나 추가 증빙 서류가 필요한 청구가 증가하고 있습니다. 이에 대응하여 의료 서비스 제공자들은 지급 적정성과 수익 회수 워크플로우에 더욱 주력하고 있습니다.
복잡한 환급 정책 및 코딩 요건
지급자별 규정과 시시각각 변화하는 코딩 편집 기준으로 인해 의료 제공자가 지급받아야 할 모든 금액을 파악하고 회수하는 것이 어려워지고 있습니다. 미국의 병원들은 2025년에 이미 제공된 의료 서비스에 대한 보험사의 지급금을 회수하기 위해 430억 달러를 지출했습니다. 미국병원협회(AHA)는 이러한 부담의 원인으로 사전 승인, 청구 기각, 반복되는 서류 제출 요청, 그리고 끊임없이 변화하는 청구 규정을 꼽고 있습니다. 의료 기관은 공공 및 민간 지불자 계약에 걸쳐 서로 다른 급여 기준과 코딩 기준을 관리해야 합니다. 이로 인해 지급이 지연되거나, 정당한 심사 결과와 구별하기 어려운 계약상 조정이 발생할 가능성이 있습니다. 그 결과 발생하는 업무 부담은 헬스케어 상환 시장의 기술에서 기대되는 효율화 효과를 제한할 우려가 있습니다.
부문 분석
2025년, 의료비 상환 시장 점유율의 80.43%를 ‘지급 부족 청구’가 차지했습니다. 이러한 상황은 여러 지급자가 존재하는 시스템에서 청구액, 계약 요금 및 수령액 사이에 뿌리 깊은 괴리가 존재함을 반영합니다. 의료 서비스 제공자는 지급이 적정했는지 여부를 판단하기 위해 지급 명세서나 계약상의 조정 내용을 면밀히 검토해야 합니다. 이를 위해서는 청구 단위 데이터, 지급자별 규정, 그리고 직원의 시간이 필요합니다. 지급 부족은 일반적인 조정 사항으로 처리될 경우, 파악하기 어려운 경우가 많습니다. 이러한 업무상의 격차가 지급 정확도 향상 툴에 대한 지속적인 수요를 지원하고 있습니다.
전액 지급된 청구는 2031년까지 연평균 성장률(CAGR) 7.43%로 확대될 것으로 예측됩니다. 이러한 성장은 청구가 지급자에게 전달되기 전에 서류나 코딩상의 미비점을 조기에 파악할 수 있기 때문입니다. 수급 자격 확인 및 사전 승인 자동화 또한 피할 수 있는 재작업량을 줄일 수 있습니다. 이러한 툴은 청구가 1차 심사 단계에서 해결되도록 돕는 데 기여합니다. 마찬가지로 지급자 측도 자동 심사를 활용하여 보험 적용 범위 및 코딩 규칙을 보다 일관되게 적용하고 있습니다. 따라서 의료비 상환 시장은 지급 부족에 따른 회수와 청구 제출 전 예방이라는 두 가지 역할을 모두 수행하고 있습니다.
지역별 분석
2025년, 북미는 헬스케어 상환 시장 점유율의 42.54%를 차지했습니다. 이 지역은 대규모 다중 지불자 제도, 높은 서비스 이용률, 그리고 상세한 지급 규정을 특징으로 합니다. 미국의 의료 제공자는 연방 프로그램, 주 정부 요건 및 민간 보험사의 정책에 대응해야 합니다. CMS는 2026년에도 의료 제공자에 대한 지급 규정 및 책임 의료(Accountable Care) 참여 체제를 지속적으로 갱신하고 있습니다. 병원의 비용 압박 또한 지급 회수 툴에 대한 수요를 부추기고 있습니다. 미국병원협회(AHA) 보고서에 따르면 2025년 보험사로부터의 대금 회수에 소요된 비용은 430억 달러에 달했습니다.
유럽은 각국의 제도에서 병원에 대한 지급 및 디지털 헬스케어 경로가 업데이트되고 있으며, 여전히 중요한 의료비 상환 시장으로 남아 있습니다. 공적 보험 제도가 지역 전체 의료 제공자에 대한 상환 규칙을 형성하고 있습니다. 상환 분류가 변화하는 가운데, 임상 문서와 지급 요건을 연계해야 할 필요성은 여전히 핵심 과제입니다. 미국의 CMS 지급 동향 또한 가치 기반 의료(Value-Based Care) 참여 자격을 갖춘 사업자에 대한 다양한 지급 방식으로의 광범위한 전환을 보여주고 있습니다. 유럽의 의료 제공자들도 정확한 청구와 보상 대상 서비스에 대한 일관된 증거 제시라는 유사한 요구에 직면해 있습니다. 이러한 요건들이 지급 관리 툴의 도입을 촉진하고 있습니다.
아시아태평양은 2031년까지 연평균 성장률(CAGR) 6.43%로 성장할 것으로 예측됩니다. 이 지역에서는 보험 가입자 증가와 청구 관리 역량에 대한 수요 증가가 맞물려 있으며, 중국과 인도는 방대한 인구와 의료 서비스 접근성 확대로 인해 중요한 대규모 시장으로 부상하고 있습니다. 새로운 고용주에 의한 보험 제도 및 공적 보험 제도의 정비로 인해 피보험자 자격 심사 및 보험금 청구 처리 수요가 증가하고 있습니다. 중동 및 아프리카 및 남미는 보험 및 의료 제공자의 인프라가 정비되고 있는 초기 단계의 시장입니다. 이 지역에서는 보험 제도가 발전함에 따라 결제 플랫폼을 구축할 여지가 있으며, 헬스케어 보상 시장에 새로운 기회가 창출되고 있습니다.
기타 혜택:
- 엑셀 형식의 시장 예측(ME) 시트
- 3개월간의 애널리스트 지원
자주 묻는 질문
목차
제1장 서론
- 조사 전제조건과 시장 정의
- 조사 범위
제2장 조사 방법
제3장 개요
제4장 시장 구도
- 시장 개요
- 시장 성장 촉진요인
- 시장 성장 억제요인
- 규제 상황
- 기술 전망
- Porter's Five Forces 분석
제5장 시장 규모와 성장 예측
- 청구별
- 지불자별
- 서비스 프로바이더별
- 지역
제6장 경쟁 구도
- 시장 집중도
- 시장 점유율 분석
- 기업 개요
- UnitedHealth Group Incorporated
- Elevance Health, Inc.
- CVS Health Corporation
- The Cigna Group
- Health Care Service Corporation
- Humana Inc.
- Kaiser Foundation Health Plan, Inc.
- Centene Corporation
- Blue Cross Blue Shield Association
- Allianz Care
- Aviva plc
- Wellcare Health Plans, Inc.
- Waystar Holding Corp.
- Optum, Inc.
- R1 RCM Inc.
- Experian Health
- FinThrive, Inc.
- Zelis Healthcare, Inc.
- Availity, LLC
- Quadax, Inc.
- Flywire Corporation
- Evolent Health, Inc.
- Agilon Health, Inc.
제7장 시장 기회와 향후 전망
KSA 26.10.29According to Mordor Intelligence, the healthcare reimbursement market size is projected to expand from USD 10.52 trillion in 2025 and USD 11.13 trillion in 2026 to USD 14.77 trillion by 2031, registering a CAGR of 5.82% between 2026 and 2031.
Global Healthcare Reimbursement Market Trends and Insights
Expansion of Value-Based Care Models
Value-based care is changing how healthcare reimbursement market participants measure, submit, and reconcile payments. The CMS Shared Savings Program included 511 Accountable Care Organizations serving 12.6 million traditional Medicare beneficiaries in January 2026. Participation increased 12.3% from 2025, which expanded the number of organizations working under shared-savings arrangements. These arrangements require quality reporting, attribution management, and payment reconciliation beyond routine fee-for-service billing. CMS set the CY2026 qualifying Alternative Payment Model conversion factor at USD 33.57 per relative value unit, a 3.77% increase from 2025. Providers, therefore, need payment systems that can support both established billing processes and outcomes-linked contracts.
Rising Healthcare Service and Treatment Costs
Higher care costs increase pressure on providers to collect the full payment allowed under their contracts. Hospital expenses increased 7.5% in 2025, while drug expenses rose 13.6% and supply expenses rose 9.9%. The American Hospital Association reported that 56% of hospital costs were connected to service lines where reimbursement did not cover the cost of care. This gap makes timely charge capture, correct coding, and denial follow-up more important across the healthcare reimbursement market. Drug spending and outpatient treatment also add claims that often need prior authorization or more supporting documentation. Providers are responding by placing greater attention on payment integrity and revenue recovery workflows.
Complex Reimbursement Policies and Coding Requirements
Payer-specific rules and changing coding edits make it harder for providers to identify and recover every payment due. U.S. hospitals spent USD 43 billion in 2025 trying to collect insurer payments for care already delivered. The American Hospital Association linked this burden to prior authorization, claim denials, repeated documentation requests, and changing billing rules. Providers must manage different coverage criteria and coding standards across public and private payer contracts. This can delay payment and create contractual adjustments that are difficult to separate from valid adjudications. The resulting workload can limit the efficiency gains expected from healthcare reimbursement market technology.
Other drivers and restraints analyzed in the detailed report include:
- Chronic Disease and Aging-Related Utilization Growth
- Public and Private Insurance Coverage Expansion
- Fiscal Pressure on Public Payers and Reimbursement Rates
For complete list of drivers and restraints, kindly check the Table Of Contents.
Segment Analysis
Underpaid claims held 80.43% of the healthcare reimbursement market share in 2025. Their position reflects the persistent difference between billed amounts, contracted rates, and payments received in multi-payer systems. Providers must review remittances and contractual adjustments to determine whether a payment was correct. This requires claim-level data, payer-specific rules, and staff time. Payment shortfalls are often difficult to identify when they are processed as routine adjustments. These operational gaps support continued demand for payment accuracy tools.
Fully paid claims are forecast to grow at a 7.43% CAGR through 2031. Their growth is linked to earlier identification of documentation and coding gaps before a claim reaches the payer. Eligibility verification and prior authorization automation can also reduce preventable rework. These tools can help claims move toward first-pass resolution. Payers are similarly using automated review to apply coverage and coding rules more consistently. The healthcare reimbursement market, therefore, serves both recovery after an underpayment and prevention before claim submission.
Complete Report Scope:
- By Claim
- Underpaid Claims
- Fully Paid Claims
- By Payer
- Private Payers
- Public Payers
- By Service Provider
- Hospitals
- Physician Offices and Clinics
- Diagnostic Laboratories
- Other Service Providers
- Geography
- North America
- United States
- Canada
- Mexico
- Europe
- Germany
- United Kingdom
- France
- Italy
- Spain
- Rest of Europe
- Asia-Pacific
- China
- Japan
- India
- Australia
- South Korea
- Rest of Asia-Pacific
- Middle East and Africa
- GCC
- South Africa
- Rest of Middle East and Africa
- South America
- Brazil
- Argentina
- Rest of South America
- North America
Geography Analysis
North America held 42.54% of the healthcare reimbursement market share in 2025. The region has a large multi-payer system, high service utilization, and detailed payment rules. U.S. providers must work with federal programs, state requirements, and commercial insurer policies. CMS continues to update provider payment rules and accountable care participation structures in 2026. Hospital cost pressures also reinforce demand for payment recovery tools. The American Hospital Association reported USD 43 billion in collection costs for insurer payments in 2025.
Europe remains an important healthcare reimbursement market because national systems are updating hospital payment and digital health pathways. Public payer systems shape provider reimbursement rules across the region. The need to connect clinical documentation with payment requirements remains central as reimbursement categories change. CMS payment developments in the United States also illustrate the wider shift toward different payment methods for qualifying value-based participants. European providers face similar needs for accurate billing and consistent evidence for reimbursable services. These requirements support the adoption of payment administration tools.
Asia-Pacific is forecast to grow at a 6.43% CAGR through 2031. The region combines expanding insurance participation with a growing need for claims administration capacity. China and India are important volume markets because of their large populations and broader access to health services. New employer and public coverage arrangements increase the need for eligibility and claims processes. The Middle East and Africa and South America are earlier-stage markets with growing insurance and provider infrastructure. The healthcare reimbursement market has an opening in these regions where payment platforms can be established as coverage programs develop.
- United Health Group
- Elevance Health, Inc.
- CVS Health
- The Cigna Group
- Health Care Service Corporation
- Humana Inc.
- Kaiser Foundation Health Plan, Inc.
- Centene Corporation
- Blue Cross Blue Shield Association
- Allianz Care
- Aviva plc
- Wellcare Health Plans, Inc.
- Waystar Holding Corp.
- Optum
- R1 RCM
- Experian Health
- FinThrive, Inc.
- Zelis Healthcare, Inc.
- Availity, LLC
- Quadax, Inc.
- Flywire Corporation
- Evolent Health, Inc.
- Agilon Health, Inc.
Additional Benefits:
- The market estimate (ME) sheet in Excel format
- 3 months of analyst support
TABLE OF CONTENTS
1 Introduction
- 1.1 Study Assumptions & Market Definition
- 1.2 Scope Of The Study
2 Research Methodology
3 Executive Summary
4 Market Landscape
- 4.1 Market Overview
- 4.2 Market Drivers
- 4.2.1 Expansion of Value-Based Care Models
- 4.2.2 Rising Healthcare Service and Treatment Costs
- 4.2.3 Chronic Disease and Aging-Related Utilization Growth
- 4.2.4 Public and Private Insurance Coverage Expansion
- 4.2.5 Embedded Reimbursement Pathways for Digital Therapeutics and Medical AI
- 4.2.6 Payer Demand for Interoperable Real-World Evidence at the Point of Payment
- 4.3 Market Restraints
- 4.3.1 Complex Reimbursement Policies and Coding Requirements
- 4.3.2 Fiscal Pressure on Public Payers and Reimbursement Rates
- 4.3.3 Fragmented Clinical Data Ownership Across Provider Networks
- 4.3.4 Provider Exposure to Dual Fee-for-Service and Downside-Risk Contracts
- 4.4 Regulatory Landscape
- 4.5 Technological Outlook
- 4.6 Porter's Five Forces Analysis
- 4.6.1 Threat Of New Entrants
- 4.6.2 Bargaining Power Of Buyers
- 4.6.3 Bargaining Power Of Suppliers
- 4.6.4 Threat Of Substitutes
- 4.6.5 Competitive Rivalry
5 Market Size & Growth Forecasts (Value, USD)
- 5.1 By Claim
- 5.1.1 Underpaid Claims
- 5.1.2 Fully Paid Claims
- 5.2 By Payer
- 5.2.1 Private Payers
- 5.2.2 Public Payers
- 5.3 By Service Provider
- 5.3.1 Hospitals
- 5.3.2 Physician Offices and Clinics
- 5.3.3 Diagnostic Laboratories
- 5.3.4 Other Service Providers
- 5.4 Geography
- 5.4.1 North America
- 5.4.1.1 United States
- 5.4.1.2 Canada
- 5.4.1.3 Mexico
- 5.4.2 Europe
- 5.4.2.1 Germany
- 5.4.2.2 United Kingdom
- 5.4.2.3 France
- 5.4.2.4 Italy
- 5.4.2.5 Spain
- 5.4.2.6 Rest of Europe
- 5.4.3 Asia-Pacific
- 5.4.3.1 China
- 5.4.3.2 Japan
- 5.4.3.3 India
- 5.4.3.4 Australia
- 5.4.3.5 South Korea
- 5.4.3.6 Rest of Asia-Pacific
- 5.4.4 Middle East and Africa
- 5.4.4.1 GCC
- 5.4.4.2 South Africa
- 5.4.4.3 Rest of Middle East and Africa
- 5.4.5 South America
- 5.4.5.1 Brazil
- 5.4.5.2 Argentina
- 5.4.5.3 Rest of South America
- 5.4.1 North America
6 Competitive Landscape
- 6.1 Market Concentration
- 6.2 Market Share Analysis
- 6.3 Company Profiles {(Includes Global Level Overview, Market Level Overview, Core Segments, Financials As Available, Strategic Information, Market Rank/Share For Key Companies, Products & Services, And Recent Developments)}
- 6.3.1 UnitedHealth Group Incorporated
- 6.3.2 Elevance Health, Inc.
- 6.3.3 CVS Health Corporation
- 6.3.4 The Cigna Group
- 6.3.5 Health Care Service Corporation
- 6.3.6 Humana Inc.
- 6.3.7 Kaiser Foundation Health Plan, Inc.
- 6.3.8 Centene Corporation
- 6.3.9 Blue Cross Blue Shield Association
- 6.3.10 Allianz Care
- 6.3.11 Aviva plc
- 6.3.12 Wellcare Health Plans, Inc.
- 6.3.13 Waystar Holding Corp.
- 6.3.14 Optum, Inc.
- 6.3.15 R1 RCM Inc.
- 6.3.16 Experian Health
- 6.3.17 FinThrive, Inc.
- 6.3.18 Zelis Healthcare, Inc.
- 6.3.19 Availity, LLC
- 6.3.20 Quadax, Inc.
- 6.3.21 Flywire Corporation
- 6.3.22 Evolent Health, Inc.
- 6.3.23 Agilon Health, Inc.
7 Market Opportunities & Future Outlook
- 7.1 White-Space & Unmet-Need Assessment


