
|
시장보고서
상품코드
1690770
태양에너지 : 시장 점유율 분석, 산업 동향 및 통계, 성장 예측(2025-2030년)Solar Energy - Market Share Analysis, Industry Trends & Statistics, Growth Forecasts (2025 - 2030) |
||||||
■ 보고서에 따라 최신 정보로 업데이트하여 보내드립니다. 배송일정은 문의해 주시기 바랍니다.
가격
※ 부가세 별도
한글목차
영문목차
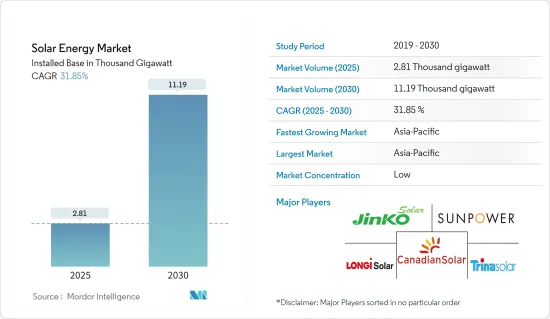
태양에너지 시장의 설치 기반 규모는 2025년 2,810기가와트에서 2030년에는 1만 1,190기가와트로 확대될 것으로 예측되며, 예측 기간 중(2025-2030년) CAGR은 31.85%를 나타낼 전망입니다.
주요 하이라이트
- 중기적으로 유리한 정부 정책과 태양광 발전 시스템의 가격 및 설치 비용 하락과 함께 태양광 패널의 가격 및 설치 비용 하락은 예측 기간 동안 글로벌 태양에너지 시장의 성장을 지원할 것으로 보입니다.
- 반면에 가스 화력 발전소 및 육상 및 해상 풍력 프로젝트와 같은 대체 청정 전력 원의 채택 증가와 같은 요인은 연구 기간 동안 시장 성장을 저해 할 가능성이 높습니다.
- 그럼에도 불구하고 태양에너지와 에너지 저장 시스템의 통합은 향후 시장에 몇 가지 기회를 창출 할 것으로 예상됩니다.
- 예측기간 중 아시아태평양은 중국, 인도 및 기타 국가의 태양에너지 설치 증가로 인해 태양에너지 시장에서 가장 크고 빠르게 성장하는 지역이 될 것으로 예상됩니다.
태양에너지 시장 동향
시장을 지배할 것으로 예상되는 태양광 발전(PV) 부문
- 태양광 발전 시스템은 반도체 소재, 일반적으로 실리콘으로 구성된 태양광 패널을 사용하여 햇빛을 직접 전기로 변환합니다.
- 태양광 발전(PV) 부문은 향후 5년 동안 수력 및 풍력을 훨씬 능가하는 연간 재생에너지 용량 증가율로 가장 큰 비중을 차지할 것으로 예상됩니다.
- 또한 인구 증가, 도시화, 교통을 포함한 다양한 부문의 전기화로 인해 전 세계 전력 수요는 지속적으로 증가하고 있습니다.
- 전 세계 태양광 발전의 연간 설치량은 2022년에 비해 2023년에 80% 이상 증가하여 그리드에 연결된 설치 용량이 417GWdc에 달했습니다.
- 국제에너지기구(IEA)에 따르면 2024년 전 세계 태양광 발전 생산 용량은 약 1,000GW에 달할 것으로 예상되며, 이는 2030년 약 650GW인 2050년까지 IEA 순배출 제로 시나리오의 연간 수요를 충족하기에 충분한 수준입니다.
- 미국, 유럽, 인도 정부는 태양광 공급망 다각화를 우선시하기 시작했으며, 인도의 생산 연계 인센티브(PLI) 제도와 미국의 인플레이션 감소법(IRA) 등의 정책을 시행하여 자국 제조업체가 중국 업체와의 경쟁력을 높일 수 있도록 직접적인 재정적 인센티브를 제공하고 있습니다. 그 결과 2022년부터 2023년까지 120% 이상의 신규 태양광 제조 프로젝트가 발표되어 각 지역에서 20GW 이상의 용량을 갖춘 국가 태양광 공급망을 구축할 수 있을 것으로 예상됩니다.
- 반면, 인도에서는 태양광 발전이 크게 발전하고 있습니다. 인도는 2023년에 2022년보다 15.4% 증가한 9.71GW의 태양광 발전 설비를 설치할 예정입니다. 연간 태양광 발전 용량을 40GW로 늘리겠다는 새로운 목표와 국내 공급망의 역동적인 발전으로 인해 조만간 태양광 발전 성장이 더욱 가속화될 것으로 예상됩니다.
- 또한, 전 세계 각국 정부는 태양광 설치를 촉진하기 위해 지원 정책과 재정적 인센티브를 도입했습니다.
- 예를 들어 호주는 2030년까지 전체 전력의 82%를 태양광 및 풍력과 같은 재생 가능한 자원을 통해 생산한다는 목표를 세웠으며, 태양광 발전은 이 목표를 달성하는 데 크게 기여할 것으로 예상됩니다.
- 따라서 위에서 언급한 요인에 따라 예측 기간 동안 유틸리티 부문이 태양에너지 시장을 지배할 것으로 예상됩니다.
아시아태평양이 시장을 독점할 전망
- 중국, 인도, 일본 등 아시아태평양 지역의 많은 국가에서는 태양광 에너지 도입을 장려하기 위해 야심찬 재생 에너지 목표와 지원 정책을 시행하고 있습니다.
- 중국 국가에너지국에 따르면 중국의 누적 설치 전력 용량은 전년 대비 13.9% 증가한 약 292만kW에 달했으며, 이 중 태양광 발전은 전년 대비 55.2% 증가한 6,094만kW를 차지했습니다. 또한, 중국은 국가발전개혁위원회(NDRC)와 국가에너지국(NEA)의 새로운 가이드라인에 따라 2025년까지 분산형 재생에너지 용량을 500GW로 확대할 계획입니다.
- 또한 아시아태평양 지역의 국가들은 인구가 빠르게 증가하고 경제가 확장되면서 전력 수요가 증가하고 있습니다.
- 또한 아시아 태평양 지역의 여러 국가에서 야심찬 대규모 태양광 에너지 프로젝트를 진행하고 있습니다.
- 2024년 4월, 베다타 그룹 산하의 세렌티카 리뉴블러스는 최대 3,000억 루피(약 35억 9,000만 달러)의 투자를 계획하고 있다고 발표했습니다. 이 회사는 2030년까지 17GW의 재생 에너지를 달성하는 것을 목표로 하고 있습니다. 또한 인도의 다국적 대기업인 아다니 그룹은 2030년까지 인도에서 가장 야심찬 재생에너지 확대와 태양광 및 풍력 제조 설비 증설에 약 23억 루피(약 275억 5,000만 달러)를 투자할 계획이라고 발표했습니다.
- 또한 아시아태평양 국가, 특히 중국도 태양광 발전 부품 및 시스템의 주요 제조 허브로 부상하고 있습니다.
- 따라서 아시아태평양 지역은 예측 기간 동안 태양에너지 시장을 지배할 것으로 예상됩니다.
태양에너지 산업 개요
태양에너지 시장은 세분화되어 있습니다. 이 시장의 주요 기업(특별한 순서 없음)에는 Canadian Solar Inc., JinkoSolar Holding, Trina Solar, SunPower Corporation, LONGi Green Energy Technology 등이 있습니다.
기타 혜택
- 엑셀 형식 시장 예측(ME) 시트
- 3개월간의 애널리스트 지원
목차
제1장 서론
- 조사 범위
- 시장의 정의
- 조사의 전제
제2장 주요 요약
제3장 조사 방법
제4장 시장 개요
- 소개
- 태양에너지 설치 용량과 예측(-2029년, 단위 : GW)
- 세계의 재생 가능 에너지 믹스(2023년)
- 최근 동향과 개발
- 정부의 규제와 시책
- 시장 역학
- 성장 촉진요인
- 정부 인센티브 및 정책
- 태양광 발전 시스템의 가격 및 설치 비용 감소
- 억제요인
- 대체 청정 전력원의 채택 증가
- 성장 촉진요인
- 공급망 분석
- 산업의 매력 - Porter's Five Forces 분석
- 공급기업의 협상력
- 소비자의 협상력
- 신규 참가업체의 위협
- 대체품의 위협
- 경쟁 기업간 경쟁 관계의 강도
제5장 시장 세분화
- 기술 부문
- 태양광 발전(PV)
- 개요
- 태양광 발전(PV) 설치 용량과 예측(-2029년)
- 태양광 발전 출하량(-2029년, 단위 : GW)
- 태양전지 PV 출하 기술별 점유율(2023년)
- 태양전지 모듈 평균 판매 가격(-2023년, 단위 : USD/W)
- 주요 프로젝트 정보
- 집광형 태양열 발전(CSP)
- 개요
- 집광형 태양열 발전(CSP) 설치 용량과 예측(-2029년)
- 태양열 발전 가동 용량(-2023년, 단위 : GW)
- 태양열 발전 설비 용량의 포수제 유형별 점유율(2023년)
- 주요 프로젝트 정보
- 태양광 발전(PV)
- 시장 분석 : 시장 규모와 수요 예측(-2028년, 지역별)
- 북미
- 미국
- 멕시코
- 캐나다
- 기타 북미
- 유럽
- 독일
- 스페인
- 이탈리아
- 영국
- 프랑스
- 노르딕
- 튀르키예
- 러시아
- 기타 유럽
- 아시아태평양
- 중국
- 인도
- 일본
- 호주
- 베트남
- 한국
- 말레이시아
- 태국
- 인도네시아
- 기타 아시아태평양
- 남미
- 브라질
- 아르헨티나
- 칠레
- 콜롬비아
- 기타 남미
- 중동 및 아프리카
- 사우디아라비아
- 아랍에미리트(UAE)
- 이집트
- 나이지리아
- 남아프리카
- 중동 및 아프리카
- 북미
제6장 경쟁 구도
- M&A, 합작사업, 제휴, 협정
- 주요 기업의 전략
- 기업 프로파일
- Canadian Solar Inc.
- JinkoSolar Holding Co. Ltd
- Trina Solar Co. Ltd
- SunPower Corporation
- LONGi Green Energy Technology Co. Ltd
- First Solar Inc.
- JA Solar Holding
- Abengoa SA
- Acciona SA
- Brightsource Energy Inc.
- Engie SA
- NextEra Energy Inc.
- ACWA Power
- Sharp Corporation
- REC Solar Holdings AS
- Hanwha Corporation
- 시장 랭킹 분석
제7장 시장 기회와 앞으로의 동향
- 에너지 저장 시스템의 통합
The Solar Energy Market size in terms of installed base is expected to grow from 2.81 thousand gigawatt in 2025 to 11.19 thousand gigawatt by 2030, at a CAGR of 31.85% during the forecast period (2025-2030).
Key Highlights
- Over the medium term, favorable government policies and declining prices and installation costs of solar PV systems, along with the declining price of solar panels and installation costs, are likely to support the global solar energy market's growth during the forecast period.
- On the other hand, factors such as the rising adoption of alternate clean power sources, such as gas-fired power plants and onshore and offshore wind projects, are likely to hinder the market growth during the study period.
- Nevertheless, the integration of solar energy with energy storage systems is expected to create several opportunities for the market in the future.
- During the forecast period, Asia-Pacific is expected to be the largest and fastest-growing region in the solar energy market due to the increasing solar installations in China, India, and other countries.
Solar Energy Market Trends
Solar Photovoltaic (PV) Segment Expected to Dominate the Market
- Solar PV systems convert sunlight directly into electricity using solar panels made up of semiconductor materials, typically silicon. When sunlight strikes the solar cells, it excites electrons, generating a flow of direct current (DC) electricity. This DC electricity is converted into alternating current (AC) using an inverter in homes, businesses, and the electrical grid.
- The solar photovoltaic (PV) segment is expected to account for the most significant yearly capacity additions for renewables, well above hydro and wind, for the next five years. According to the International Renewable Energy Agency (IRENA 2024), Solar PV installed capacity accounted for 1412.093 GW, comparatively higher than the 721.989 GW installed in 2020.
- Additionally, the global electricity demand is continuously increasing due to population growth, urbanization, and the electrification of various sectors, including transportation. Solar PV systems offer a scalable and decentralized solution to meet this growing energy demand, particularly in regions with limited or unreliable grid infrastructure.
- Global solar PV annual installations grew by over 80% in 2023 compared to 2022, reaching 417 GWdc of grid-connected installed capacity. Due to ambitious government targets, policy support, and increasing competitiveness, investments in PVs are expected to grow further in the coming years.
- According to the International Energy Agency (IEA), global solar PV manufacturing capacity is expected to reach almost 1,000 GW in 2024, adequate to meet the annual demand for IEA Net Zero Emissions by 2050 scenario of almost 650 GW in 2030.
- Governments in the United States, Europe, and India have started to prioritize solar PV supply chain diversification, implementing policies such as India's Production Linked Incentive (PLI) scheme and the US Inflation Reduction Act (IRA) to provide direct financial incentives for domestic manufacturers to increase their competitiveness with Chinese ones. As a result, over 120% more new solar PV manufacturing projects were announced from 2022 to 2023 to potentially create national PV supply chains with over 20 GW of capacity in each region.
- On the other hand, India is witnessing significant developments in solar PV deployments. The country installed 9.71 GW of solar PV in 2023, 15.4% more than in 2022. A new target to increase PV capacity auctioned to 40 GW annually, and the dynamic development of the domestic supply chain is expected to result in a further acceleration in PV growth shortly.
- Moreover, governments worldwide have introduced supportive policies and financial incentives to promote solar PV installations. These measures include feed-in tariffs, tax credits, grants, and net metering programs. Such policies encourage the adoption of solar PV systems by reducing upfront costs, improving investment returns, and facilitating grid integration.
- For instance, Australia has set a goal of generating 82% of its electricity through renewable sources like solar PV and wind by 2030, and solar PV is expected to be a significant contributor to achieving this target.
- Therefore, based on the abovementioned factors, the utility sector is expected to dominate the solar energy market during the forecast period.
Asia-Pacific Expected to Dominate the Market
- Many countries in Asia-Pacific, such as China, India, and Japan, have implemented ambitious renewable energy targets and supportive policies to encourage solar energy adoption. These policies include feed-in tariffs, renewable portfolio standards, and subsidies for solar installations. Strong government support and stable policy frameworks have created a conducive environment for the region's solar energy market growth.
- According to the China National Energy Agency, China's cumulative installed power capacity reached approximately 2.92 TW, a 13.9% increase year over year, with solar power accounting for 609.49 GW, a 55.2% jump year over year. Also, according to the new guidelines from the National Development and Reform Commission (NDRC) and the National Energy Administration (NEA), China plans to expand its distributed renewable energy capacity to 500 GW by 2025.
- Furthermore, the countries in Asia-Pacific have a rapidly growing population and expanding economies, leading to an increasing demand for electricity. Solar energy offers a scalable and sustainable solution to this growing energy demand. As a result, there is a strong market potential for solar energy deployment in the region.
- Moreover, several countries in Asia-Pacific have undertaken ambitious large-scale solar energy projects. For instance, China has been a leader in utility-scale solar installations, with extensive solar farms and solar parks. These large-scale projects have boosted the region's cumulative solar capacity and positioned it as a dominant player in the global solar market.
- In April 2024, Serentica Renewables, part of Vedanta Group, announced that it plans to invest up to INR 30,000 crore (~USD 3.59 billion). The company aims to achieve 17 GW of renewable energy by 2030. Also, Adani Group, an Indian multinational conglomerate, announced that it is planning to invest around INR 2.3 lakh crore (~USD 27.55 billion) through 2030 in India's most ambitious renewable energy expansion and solar and wind manufacturing capacity addition.
- Moreover, Asia-Pacific countries, particularly China, have also emerged as major manufacturing hubs for solar PV components and systems. The region benefits from economies of scale, efficient supply chains, and competitive production costs, significantly reducing the overall cost of solar energy systems. This cost advantage has contributed to the dominance of Asia-Pacific in the global solar energy market.
- Therefore, Asia-Pacific is expected to dominate the solar energy market during the forecast period.
Solar Energy Industry Overview
The solar energy market is fragmented. Some of the key players in the market (in no particular order) include Canadian Solar Inc., JinkoSolar Holding Co. Ltd, Trina Solar Co. Ltd, SunPower Corporation, and LONGi Green Energy Technology Co. Ltd.
Additional Benefits:
- The market estimate (ME) sheet in Excel format
- 3 months of analyst support
TABLE OF CONTENTS
1 INTRODUCTION
- 1.1 Scope of the Study
- 1.2 Market Definition
- 1.3 Study Assumptions
2 EXECUTIVE SUMMARY
3 RESEARCH METHODOLOGY
4 MARKET OVERVIEW
- 4.1 Introduction
- 4.2 Solar Energy Installed Capacity and Forecast in GW, till 2029
- 4.3 Global Renewable Energy Mix, 2023
- 4.4 Recent Trends and Developments
- 4.5 Government Policies and Regulations
- 4.6 Market Dynamics
- 4.6.1 Drivers
- 4.6.1.1 Government Incentives and Policies
- 4.6.1.2 Declining Price and Installation Cost of Solar PV Systems
- 4.6.2 Restraints
- 4.6.2.1 Rising Adoption of Alternate Clean Power Sources
- 4.6.1 Drivers
- 4.7 Supply Chain Analysis
- 4.8 Industry Attractiveness - Porter's Five Forces Analysis
- 4.8.1 Bargaining Power of Suppliers
- 4.8.2 Bargaining Power of Consumers
- 4.8.3 Threat of New Entrants
- 4.8.4 Threat of Substitute Products and Services
- 4.8.5 Intensity of Competitive Rivalry
5 MARKET SEGEMENTATION
- 5.1 Technology
- 5.1.1 Solar Photovoltaic (PV)
- 5.1.1.1 Overview
- 5.1.1.2 Solar Photovoltaic (PV) Installed Capacity and Forecast, till 2029
- 5.1.1.3 Annual Solar PV Shipments, in GW, till 2023
- 5.1.1.4 Share of Solar PV Shipments (%), by Technology, 2023
- 5.1.1.5 Average Selling Price of Solar PV Module, in USD/W, till 2023
- 5.1.1.6 Key Projects Information
- 5.1.2 Concentrated Solar Power (CSP)
- 5.1.2.1 Overview
- 5.1.2.2 Concentrated Solar Power (CSP) Installed Capacity and Forecast, till 2029
- 5.1.2.3 Solar Thermal Capacity in Operation, in GW, till 2023
- 5.1.2.4 Solar Thermal Installed Capacity Share (%), by Collector Type, 2023
- 5.1.2.5 Key Projects Information
- 5.1.1 Solar Photovoltaic (PV)
- 5.2 Geography Regional Market Analysis {Market Size and Demand Forecast till 2028 (for regions only)}
- 5.2.1 North America
- 5.2.1.1 United States
- 5.2.1.2 Mexico
- 5.2.1.3 Canada
- 5.2.1.4 Rest of North America
- 5.2.2 Europe
- 5.2.2.1 Germany
- 5.2.2.2 Spain
- 5.2.2.3 Italy
- 5.2.2.4 United Kingdom
- 5.2.2.5 France
- 5.2.2.6 NORDIC
- 5.2.2.7 Turkey
- 5.2.2.8 Russia
- 5.2.2.9 Rest of Europe
- 5.2.3 Asia-Pacific
- 5.2.3.1 China
- 5.2.3.2 India
- 5.2.3.3 Japan
- 5.2.3.4 Australia
- 5.2.3.5 Vietnam
- 5.2.3.6 South Korea
- 5.2.3.7 Malaysia
- 5.2.3.8 Thailand
- 5.2.3.9 Indonesia
- 5.2.3.10 Rest of Asia-pacific
- 5.2.4 South America
- 5.2.4.1 Brazil
- 5.2.4.2 Argentina
- 5.2.4.3 Chile
- 5.2.4.4 Colombia
- 5.2.4.5 Rest of South America
- 5.2.5 Middle East and Africa
- 5.2.5.1 Saudi Arabia
- 5.2.5.2 United Arab Emirates
- 5.2.5.3 Egypt
- 5.2.5.4 Nigeria
- 5.2.5.5 South Africa
- 5.2.5.6 Middle East and Africa
- 5.2.1 North America
6 COMPETITIVE LANDSCAPE
- 6.1 Mergers and Acquisitions, Joint Ventures, Collaborations, and Agreements
- 6.2 Strategies Adopted by Leading Players
- 6.3 Company Profiles
- 6.3.1 Canadian Solar Inc.
- 6.3.2 JinkoSolar Holding Co. Ltd
- 6.3.3 Trina Solar Co. Ltd
- 6.3.4 SunPower Corporation
- 6.3.5 LONGi Green Energy Technology Co. Ltd
- 6.3.6 First Solar Inc.
- 6.3.7 JA Solar Holding
- 6.3.8 Abengoa SA
- 6.3.9 Acciona SA
- 6.3.10 Brightsource Energy Inc.
- 6.3.11 Engie SA
- 6.3.12 NextEra Energy Inc.
- 6.3.13 ACWA Power
- 6.3.14 Sharp Corporation
- 6.3.15 REC Solar Holdings AS
- 6.3.16 Hanwha Corporation
- 6.4 Market Ranking Analysis
7 MARKET OPPORTUNITIES AND FUTURE TRENDS
- 7.1 Energy Storage Systems Integration
