|
시장보고서
상품코드
1892159
종양학 영상 AI 시장 동향(2025-2032년) : 규모, 구성 및 성장 동향Global Oncology Imaging AI Market Pulse 2025-2032 Size, Mix and Momentum |
||||||
세계 종양학 영상 AI 시장 규모는 2023년 6억 470만 달러에서 2032년까지 77억 4,000만 달러(CAGR 32.7%)로 성장할 것으로 예상됩니다. 이로써 종양학은 의료 영상 AI 분야에서 가장 빠르게 성장하고 있는 분야 중 하나가 될 것이며, 기업 구매자들이 향후 AI 예산을 어디에 할당할 것인지에 대한 선행 지표가 될 것입니다.
개요
"세계의 종양학 영상 AI 시장 동향(2025-2032년) - 규모, 구성 및 성장 동향"은 Marketstrat이 제공하는 암 영상 진단 분야 AI 세계 시장 규모와 예측 보고서입니다. 지역별, 모달리티별(CT, 유방촬영술/DBT, MRI, PET/핵의학, 초음파), 임상 응용별, 종양 부위별, 치료 경로 단계별, 최종 사용 환경별, 수익 모델별 수요 추이를 다루고 있습니다.
이 보고서는 100페이지에 달하는 종합적인 호라이즌 프로그램을 참조하지 않고도 명확하고 정량적인 세계 관점을 원하는 분들에게 적합합니다. 다음과 같은 질문에 대해 신속하고 의사결정 수준의 답변을 제공합니다:
- 현재 세계 암 영상 진단 AI 시장 규모는 어느 정도이며, 2032년까지 얼마나 성장할 것인가?
- 지출이 집중되는 곳("큰 풀")은 어디인가?
- 앞으로 어느 분야에서 수익이 확대될 것으로 예상되는가?("급성장 분야" 및 "성장 기여 분야")
- 수익화 모델은 어떻게 변화하는가?(소프트웨어 vs. 서비스 vs. 클라우드/사용량 기반)
시장 규모는 스캐너 대수의 증가보다는 주로 어태치먼트 비율의 확대와 워크플로우 도입으로 CAGR 32.7%로 6억 470만 달러(2023년)에서 77억 40,00만 달러(2032년)로 확대될 전망입니다.
주요 시장 동향(변화점)
1."단일 기능 AI"에서 진료 경로 전체에 도입하는 AI로
종양학 영상 AI는 단일 작업 CAD에서 스크리닝, 탐지, 병기 결정, 치료 계획(방사선 치료 포함), 치료 효과 평가, 경과 관찰 등 전체 경로의 워크플로우로 이동하고 있습니다. 이 분야에서는 표준화된 측정이 임상적, 경제적 요건입니다.
2. 스크리닝 프로그램은 예측 가능한 AI 처리량을 지원
유방암 검진(유방촬영술/DBT) 및 LDCT 폐암 검진은 지속적으로 확대 및 산업화되고 있으며, 선별, 품질보증(QA), 세컨드 리드, 프로그램 운영을 대규모로 지원하는 AI에 대한 수요가 증가하고 있습니다.
3. 측정 등급의 정량화가 가치의 중심이 됩니다.
MRI(전립선/간), CT(폐병변), PET/핵의학(치료진단) 분야에서 정량화, 분석, 구조화된 보고서 작성과 같은 도구에 집중하고 있습니다. 이를 통해 암 영상 진단의 재현성과 운영상의 확장성을 높일 수 있습니다.
4. MRI 및 PET/핵의학(고ARPU 영역)의 프리미엄 계층 확대
MRI는 주요 영상 진단 분야 중 가장 빠르게 성장하고 있으며, PET/핵의학은 치료 연동형 영상 진단(테라노스틱스 포함)의 확대와 함께 정량화 및 선량 측정 중심의 AI에 대한 수요가 증가하는 고부가가치 틈새시장으로 성장하고 있습니다.
5. 수익화 축이 소프트웨어 + 이용 + 라이프사이클 서비스로 전환
소프트웨어는 여전히 핵심 수익원이지만, 클라우드/사용량 기반(PPU) 모델은 대용량 워크플로우(선별진료소, 원격 방사선 진단, 기업 다중 사이트 네트워크)에서 가속화될 것입니다. 검증, 모니터링, 거버넌스 요구사항이 확대됨에 따라 서비스도 확대될 것입니다.
경쟁 환경 개요(시장 점유율이 아닌 상업적 실태)
본 보고서는 벤더별 시장 점유율이 아닌, 시장이 어떻게 확보되고 있는지에 초점을 맞추고 있습니다. 이 보고서에서는 각 부문의 승자와 가격 결정력을 형성하는 상업적 기반을 강조합니다:
- 고용량 모달리티 및 스크리닝 레인에서의 OEM 번들링과 "기본 부착"의 경제성
- IDN(통합 의료 네트워크) 및 암 네트워크의 기업 계약 및 거버넌스 요건
- 멀티 벤더 환경에서의 도입 장벽을 낮추는 마켓플레이스/플랫폼 유통
- 사용량 기반 가격 책정과 표준화된 품질 보증(QA)의 촉진 요인으로서의 원격 방사선 진단 및 집중 판독 허브
다음 회사/부서가 언급되었습니다(프로필 제외) - Aidoc, AIQ Solutions, Annalise.ai, Arterys, Bayer, Blackford, Calantic, Canon Medical, CARPL.ai, DeepHealth, Deepwise, Densitas, EXINI Diagnostics, Fujifilm, GE HealthCare, Hermes Medical Solutions, Hologic, Imbio, Incepto, Kheiron, Koios Medical, Lantheus, Lunit, Median Technologies, MIM Software, Mindray, Mirada Medical, MVision AI, Nuance, Oxipit, Perspectum, Philips, Ping An Healthcare, Quibim, Qure.ai, Rad AI, RadNet, RaySearch, Riverain, ScreenPoint, Sectra, Segami, Siemens Healthineers, Subtle Medical, Tempus, TheraPanacea, United Imaging, Vara, Varian
샘플 인사이트 및 도표(인용 가능한 내용)
이 보고서를 통해 독자들은 다음과 같은 질문에 대한 즉각적인 답을 얻을 수 있습니다:
- 특정 모달리티나 치료 경로의 단계에서 어느 지역이 세계 평균에 비해 과대평가되거나 과소평가되고 있는가?
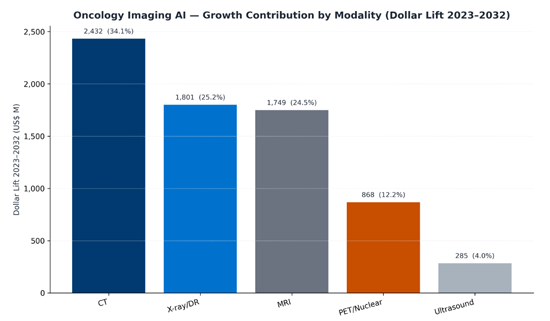
- 모달리티별, 종양 부위별, 치료 경로 단계별, 수익원별, 가장 큰 수익 증가를 가져온 곳은 어디인가?
- 어떤 종양 부위와 모달리티의 조합이 최대의 증분 수익을 창출하고 있는가?(예 : 유방암×X선/DR, 폐×CT, 전립선×MRI)
- 기존 라이선스 계약과 비교하여 클라우드/PPU 모델이 구조적으로 우위를 발휘할 수 있는 영역은 어디인가?
본 보고서는 41개의 도표와 36개의 표를 수록하고 있으며, 계획 자료, 투자 개요, 시장 진입 전략의 우선순위를 정할 때 재사용할 수 있는 구성으로 되어 있습니다.
내용
- 세계 규모, 성장, 그리고 가장 중요한 몇 가지 구성 변화에 초점을 맞춘 이그제큐티브 서머너리
- 조사 방법 개요(조사 범위 정의, 세분화 컴퍼스, 예측 아키텍처)
- 세계 시장 분석(2023-2032년)은 다음과 같은 지역별로 전개됩니다:
- 지역별 및 국가별 분석
- 모달리티 구성과 성장 기여도
- 임상 응용 구성비 및 성장 추세
- 종양 부위별 구성 및 성장 기여도
- 수익원(하드웨어, 소프트웨어, 서비스, 클라우드/PPU)
- 최종사용자 조직(IDN/AMC, 암센터, 지역 의료기관, 원격 방사선 진단)
- 진료경로 단계별 동향(스크리닝 → 치료계획/방사선치료 → 치료효과 평가/경과관찰)
- 구성비 및 모멘텀 매트릭스 및 교차 집계표(예 : 지역×치료법, 종양 부위×치료법, 치료 경로 단계×수익원)
본 보고서의 의의
"세계의 종양학 영상 AI 시장 동향(2025-2032년)"은 정확한 시장 규모 예측과 실용적인 세분화가 필요한 팀을 위해 제작되었습니다. 이는 실제 의사결정에 필요한 요소들의 조합입니다:
- 포트폴리오 및 로드맵 결정 : 어떤 치료법과 종양 부위에 지속적인 투자를 할 가치가 있는가?
- 시장 진입 및 전개 순서 : 어디서 시작해야 하는가(대규모 시장)와 어디에 선택적으로 투자해야 하는가(성장 시장)?
- 상업 전략 : 수익 모델은 어떻게 진화하는가(라이선스 vs 서비스 vs 사용량), 가격 책정은 어느 영역에서 압축되고 어느 영역에서 유지되는가?
- 투자자 및 실사 워크플로우 : 어떤 성장 스토리가 사례가 아닌 세계의 구성비/세력의 패턴별로 뒷받침되고 있는가?
목차
섹션 0 - 이 세계의 마켓 펄스 사용 방법
섹션 1 - 세계 시장 스냅샷(2023-2032년)
섹션 2 - 주요 요약
섹션 3 - 조사 방법
섹션 4 - 종양학 영상 AI의 세계 시장
- 세계 시장 개요
- 종양학 영상 AI : 틈새 앱에서 엔터프라이즈 플랫폼까지
- 도입이 가속화되는 이유
- 지역 성장 스냅샷(2023-2032년)
- 벤더의 전략적 영향
- 시장 모멘텀과 전망
- 종양학 영상 AI : 틈새 앱에서 엔터프라이즈 플랫폼까지
- 지역별 세계 시장 예측(2023-2032년)
- 국가별 세계 시장 x 최종 사용 조직
- 국가별 x 용도별 추정치(2023년,100만 달러)
- 국가별 및 용도별 예측(2032년)
- 하이라이트(2032년 국가별 패턴과 세계 조합)
- 2023년 대비 변화점(방향성)
- 최고 성장 셀(100만 달러 증가, 2023-2032년)
- 그 의미(상업적 플레이북)
- 주목할 만한 신호
- 모달리티별 세계 시장
- 주요 내용
- 세계 시장(모달리티별)(2023-2032년)
- 의미
- 시장 수학과 확산 패턴
- 2032년 믹스 및 주요 성장 렌즈
- 점유율 이동과 달러 증가(2023-2032년)
- 경쟁 상황 - 모달리티별
- 세부 모달리티 분석(종양학 관련)
- CT
- X선/DR(유방촬영술 포함)
- MRI
- PET/핵
- 초음파
- 벤더의 전략적 포인트(종양학 특화형)
- 주목할 만한 신호(2025-2027년)
- 임상 응용별 세계 시장
- 주요 내용
- 임상 적용별 세계 시장(2023-2032년)
- 변화점
- 용도별 주요 성장 렌즈
- 성장에 기여하는 사람(2023-2032년 증가)
- 그 의미
- 경쟁 상황 - 임상 응용별
- 임상 응용별 심층 분석
- 감지 및 진단
- 정량화 및 분석
- 워크플로우 및 오케스트레이션
- 보고 및 커뮤니케이션
- 이미지 재구성 및 획득
- 벤더의 전략적 포인트
- 주목할 만한 신호(2025-2027년)
- 종양 부위별 세계 시장
- 주요 내용
- 변화점(믹스 다이나믹스)
- 종양 부위별 세계 시장(2023-2032년)
- 성장 렌즈 - 종양 부위별
- 그 의미
- 2032년까지 달라질 것들
- 상업적 시사점
- 경쟁 상황 - 종양 부위별
- 종양 부위별 상세 분석
- 유방
- 폐/흉부
- 전립선
- 대장
- 간
- 신경종양학
- 부인과
- 두경부
- 기타(희귀)
- 전략적 포인트
- 주목할 만한 신호(2025-2027년)
- 수익원별 세계 시장
- 주요 내용
- 변화점
- 수익원별 세계 시장(2023-2032년)
- 성장 렌즈 - 수익원별
- 성장에 기여하는 사람(2023-2032년 달러 증가)
- 그 의미
- 수익원별 상세 분석
- 하드웨어
- 소프트웨어
- 서비스
- 클라우드/PPU
- 경쟁 상황 - 수익원별
- 주목할 만한 신호(2025-2027년)
- 최종 용도 조직 유형별 세계 시장
- 주요 내용
- 변화점
- 최종 용도별 세계 시장(2023-2032년)
- 용도별 성장 렌즈
- 성장에 기여하는 사람(2023-2032년 달러 증가)
- 그 의미
- 상세 분석
- 학술기관/IDN
- 종합암센터
- 지역병원 및 영상 진단센터
- 원격 방사선 진단 제공업체
- 경쟁 상황 - 최종 용도별
- 주목할 만한 신호(2025-2027년)
- AI 기술별 세계 시장
- 주요 내용
- 변화점
- AI 기술별 세계 시장(2023-2032년)
- 성장 렌즈 - AI 기술별
- 성장에 기여하는 사람(2023-2032년 달러 증가)
- 그 의미
- AI 기술별 심층 분석(종양학 렌즈)
- 경쟁 상황 - AI 기술
- 주목할 만한 신호(2025-2027년)
- 경로 단계별 세계 시장
- 주요 내용
- 변화점
- 경로 단계별 세계 시장(2023-2032)
- 성장 렌즈 - 경로 단계별
- 성장에 기여하는 사람(2023-2032년 달러 증가)
- 그 의미
- 경쟁 상황 - 진로 단계별
- 주목할 만한 신호(2025-2027년)
- "믹스 & 모멘텀" 매트릭스의 해석 방법
- 지역 믹스 및 모멘텀 - 세계 종양학 영상 AI
- 이그제큐티브 포인트
- 지역×모달리티별 마케팅
- 지역별, 모달리티별 세계 시장(2023년)
- 지역별, 모달리티별 세계 시장(2032년)
- 변화점(믹스, 2032년 상/하향 지수)
- 성장에 기여하는 사람(2023년부터 2032년까지 증가)
- 그 의미
- 지역×수익원별 시장
- 지역별, 수익원별 세계 시장(2023년)
- 지역별, 수익원별 세계 시장(2032년)
- 변화점(믹스, 2032년 상/하향 지수)
- 성장에 기여하는 사람
- 그 의미
- 지역별×임상 응용별 시장
- 지역별, 임상 응용별 세계 시장(2023년)
- 지역별, 임상 응용별 세계 시장(2032년)
- 변화점(믹스, 2032년 상/하향 지수)
- 성장에 기여하는 사람
- 그 의미
- 경쟁 상황 스냅샷(예시)
- 질병 주도형 수요 지도 - 세계 종양학 영상 AI
- 이그제큐티브 포인트
- 종양 부위 x 모달리티
- 종양 부위×모달리티별 세계 시장(2023년)
- 종양 부위×모달리티별 세계 시장(2032년)
- 변화점(2032년 믹스 및 세계 전체)
- 성장에 기여하는 사람(2023-2032년 달러 증가)
- 그 의미
- 종양부위×임상 응용
- 종양 부위별×임상 응용별 세계 시장(2023년)
- 변화점(2032년 믹스 및 세계 전체)
- 종양 부위별×임상 응용별 세계 시장(2032년)
- 성장에 기여하는 사람(2023-2032년 달러 증가)
- 그 의미
- 종양 부위 x 수익원
- 종양 부위별 수익원별 세계 시장(2023년)
- 종양 부위별 수익원별 세계 시장(2032년)
- 변화점(2032년과 세계 전체의 비율)
- 성장에 기여하는 것은 누구인가(2023-2032년 달러 증가)
- 그 의미
- 경쟁 상황 스냅샷(종양학에 특화된 설명)
- 주목할 만한 신호
- 워크플로우 경제학 - 세계 종양학 영상 AI
- 모달리티×수익원
- 모달리티×수익원별 세계 시장(2023년)
- 모달리티×수익원별 세계 시장(2032년)
- 주요 내용
- 변화점(믹스 및 오버/언더 인덱스)
- 성장에 기여하는 사람(2023-2032년 달러 증가)
- 그 의미(상업적 플레이북)
- 경쟁 렌즈(예시)
- 임상 응용×수익원
- 하이라이트(2032년 패턴)
- 임상 응용×수익원별 세계 시장(2023년)
- 임상 응용×수익원별 세계 시장(2032년)
- 변화점(2023-2032년)
- 성장에 기여하는 사람(2023년부터 2032년까지 달러 증가)
- 그 의미(용도별 상업적 플레이북)
- 경쟁사 렌즈(참고, 완전하지 않음)
- 승인을 통과하는 가격 설정의 원형(구매자가 '예'라고 말하는 것)
- 주목할 만한 신호
- 위험과 주의점
- 모달리티×수익원
- 경로 단계 경제학 - 세계 종양학 영상 AI
- 경로 단계×수익원
- 주요 내용
- 경로 단계×수익원별 세계 시장(2023년)
- 경로 단계×수익원별 세계 시장(2032년)
- 변화점(믹스 vs 세계)
- 성장에 기여하는 것은 누구인가(2023-2032년 달러 증가)
- 그 의미(상업적 플레이북)
- 경쟁사 렌즈(참고)
- 주목할 만한 신호
- 경로 단계×모달리티 - 각 단계별 트렌드와 그 이유
- 경로 단계×모달리티별 세계 시장(2023년)
- 경로 단계×모달리티별 세계 시장(2032년)
- 하이라이트(2032 패턴 vs 세계 믹스)
- 달러의 움직임(2023년 → 2032년)
- 단계별 리드아웃(각 단계별 2032주)
- 그 의미(상업적 관점에서의 인사이트)
- 경쟁사 렌즈(예시적이지 않고 예시적임)
- 주목할 만한 신호
- 경로 단계×임상 응용 - 워크로드가 지출을 좌우하는 방식
- 경로 단계×임상 응용별 세계 시장(2023년)
- 경로 단계×임상 응용별 세계 시장(2032년)
- 하이라이트(2032 패턴 vs 세계 믹스)
- 달러의 움직임(2023년 → 2032년)
- 그 의미(상업적 플레이북)
- 경쟁사 렌즈(참고)
- 주목할 만한 신호
- 경로 단계×최종 용도 - 누가 무엇을 구매하는지, 성장은 어디에 집중되는지
- 세계 정세(2032년 최종 용도 구성)
- 경로 단계×최종 용도별 세계 시장(2023년)
- 경로 단계×최종 용도별 세계 시장(2032년)
- 하이라이트(2032년 패턴과 세계 믹스)
- 성장에 기여하는 자(2023년부터 2032년까지 달러 증가)
- 이것이 의미하는 것(단계별 광고 플레이북)
- 경쟁사 렌즈(참고, 완전하지 않음)
- 주목할 만한 신호
- 경로 단계×AI 기술 - 암 치료 경로에서 능력 믹스의 변화
- 월드 테크 믹스
- 경로 단계×AI 기술별 세계 시장(2023년)
- 경로 단계×AI 기술별 세계 시장(2023년)
- 하이라이트(2032년 패턴과 세계 믹스)
- 달러의 움직임(2023년 → 2032년)
- 그 의미(상업적 플레이북)
- 경쟁사 렌즈(기준)
- 주목할 만한 신호
- 경로 단계×수익원
The global Oncology Imaging AI market is forecast to grow from US$604.7M in 2023 to US$7.74B by 2032 (32.7% CAGR)-making oncology one of the fastest-scaling categories inside medical imaging AI and a leading indicator for where enterprise buyers will place their next AI budgets.
Overview
Global Oncology Imaging AI Market Pulse 2025-2032: Size, Mix & Momentum is Marketstrat's world-market sizing and forecasting report for AI in cancer imaging-covering how demand is shifting across regions, modalities (CT, mammography/DBT, MRI, PET/Nuclear, ultrasound), clinical applications, tumor sites, care pathway stages, end-use settings, and revenue models.
This Pulse is built for teams who want a clean, quantitative global view-without needing to navigate a full multi-hundred-page Horizon program. It delivers a fast, decision-grade answer to:
- How big is the global oncology imaging AI market today-and where will it be by 2032?
- Where is the mix of spend concentrated (the "big pools")?
- Where will incremental dollars accrue (the "fast pools" and "growth contribution" lanes)?
- How do monetization models shift (software vs services vs cloud/usage-based)?
Market expands from US$604.7M (2023) to US$7.74B (2032) at a 32.7% CAGR, driven primarily by attach-rate expansion and workflow adoption, not scanner unit growth.
Key Market Trends (what's changing)
1. From "point AI" to pathway adoption
Oncology imaging AI is shifting from single-task CAD toward pathway-wide workflows-screening, detection, staging, treatment planning (including RT), response assessment, and surveillance-where standardized measurement becomes a clinical and economic requirement.
2. Screening programs anchor predictable AI volumes
Breast screening (mammography/DBT) and LDCT lung screening continue to expand and industrialize, increasing demand for AI that supports triage, QA, second reads, and program operations at scale.
3. Measurement-grade quantification becomes the value center
Across MRI (prostate/liver), CT (lung pathways), and PET/Nuclear (theranostics), growth increasingly concentrates in quantification, analytics, and structured reporting-tools that make cancer imaging more reproducible and operationally scalable.
4. Premium pools rise in MRI and PET/Nuclear (high ARPU lanes)
MRI is the fastest-growing major modality, and PET/Nuclear grows as a high-value niche as therapy-linked imaging (including theranostics) expands demand for quantification and dosimetry-oriented AI.
5. Monetization shifts toward software + usage + lifecycle services
Software remains the core revenue engine, while cloud/usage-based (PPU) models accelerate in high-volume workflows (screening hubs, teleradiology, and enterprise multi-site networks). Services expand alongside validation, monitoring, and governance requirements.
Competitive Snapshot (commercial reality, not market shares)
This Global Pulse focuses on how the market is captured-not vendor-by-vendor market shares. The report highlights the commercial rails that shape winners and pricing power across segments:
- OEM bundling and "default attach" economics in high-volume modalities and screening lanes
- Enterprise contracting and governance requirements in IDNs and cancer networks
- Marketplace/platform distribution that reduces deployment friction for multi-vendor portfolios
- Teleradiology and centralized reading hubs as catalysts for usage-based pricing and standardized QA
The following companies/divisions have been mentioned (not profiled): Aidoc; AIQ Solutions; Annalise.ai; Arterys; Bayer; Blackford; Calantic; Canon Medical; CARPL.ai; DeepHealth; Deepwise; Densitas; EXINI Diagnostics; Fujifilm; GE HealthCare; Hermes Medical Solutions; Hologic; Imbio; Incepto; Kheiron; Koios Medical; Lantheus; Lunit; Median Technologies; MIM Software; Mindray; Mirada Medical; MVision AI; Nuance; Oxipit; Perspectum; Philips; Ping An Healthcare; Quibim; Qure.ai; Rad AI; RadNet; RaySearch; Riverain; ScreenPoint; Sectra; Segami; Siemens Healthineers; Subtle Medical; Tempus; TheraPanacea; United Imaging; Vara; Varian
Sample Insights & Figures (what you'll be able to cite)
Inside this report, readers gain immediate answers to questions such as:
- Which regions are over- or under-indexed in specific modalities or pathway stages versus the global mix?
- Where is the largest dollar lift coming from-by modality, tumor site, pathway stage, and revenue stream?
- Which tumor-site x modality combinations create the most incremental dollars (e.g., breast x X-ray/DR, lung x CT, prostate x MRI)?
- Where are cloud/PPU models structurally advantaged versus traditional licensing?
This Pulse includes 41 figures and 36 tables, structured to be reusable in planning decks, investment briefs, and GTM prioritization.

What's Inside
- Executive Summary focused on global size, growth, and the few mix shifts that matter most
- Condensed Research Methodology (scope definition, segmentation compass, and forecast architecture)
- World Market Analysis (2023-2032) across:
- Region and selected country views
- Modality mix and growth contribution
- Clinical application mix and momentum
- Tumor-site mix and growth contribution
- Revenue streams (hardware, software, services, cloud/PPU)
- End-use organizations (IDNs/AMCs, cancer centers, community providers, teleradiology)
- Pathway stage dynamics (screening -> treatment planning/RT -> response/surveillance)
- Mix & Momentum matrices and cross-tabs (e.g., region x modality, tumor site x modality, pathway stage x revenue stream)
Why This Report
Global Oncology Imaging AI Market Pulse 2025-2032 is built for teams that need high-confidence sizing plus practical segmentation-the combination required to make real decisions:
- Portfolio and roadmap decisions: Which modalities and tumor sites are worth sustained investment?
- Market entry and sequencing: Where do you start (big pools) vs where do you place selective bets (fast pools)?
- Commercial strategy: How will revenue models evolve (license vs service vs usage), and where will pricing compress vs hold?
- Investor and diligence workflows: Which growth narratives are supported by global mix/momentum patterns rather than anecdote?
TABLE OF CONTENTS
SECTION 0 - HOW TO USE THIS GLOBAL MARKET PULSE
SECTION 1 - GOBAL MARKET SNAPSHOT (2023-2032)
SECTION 2 - EXECUTIVE SUMMARY
SECTION 3 - RESEARCH METHODOLOGY
SECTION 4 - WORLD MARKET FOR ONCOLOGY IMAGING AI
- 4.1 WORLD MARKET OVERVIEW
- Oncology Imaging AI: From Niche App to Enterprise Platform
- Why Adoption is Accelerating
- Regional Growth Snapshot (2023 -> 2032)
- Strategic Implications for Vendors
- Market Momentum & Outlook
- Oncology Imaging AI: From Niche App to Enterprise Platform
- 4.2 WORLD MARKET FORECAST BY REGION (2023-2032)
- 4.3 WORLD MARKET BY COUNTRY x END-USE ORG
- Estimate by Country x End-Use (USD Mill, 2023)
- Forecast by Country x End-Use (2032)
- Highlights (2032 Country Pattern vs World Mix)
- What's Shifting vs 2023 (Directional)
- Top Growth Cells (US$ M Lift, 2023->2032)
- What This Means (Commercial Playbook)
- Signals to Watch
- 4.4 WORLD MARKET BY MODALITY
- Highlights
- World Market by Modality (2023-32)
- Implications
- Market Math & Diffusion Pattern
- 2032 Mix and Key Growth Lenses
- Share Shift and Dollar Lift (2023 -> 2032)
- Competitive Landscape - by Modality
- Modality Deep-Dives (Oncology-specific)
- CT
- X-ray/DR (incl. Mammography)
- MRI
- PET/Nuclear
- Ultrasound
- Strategic Takeaways for Vendors (Oncology-specific)
- Signals to Watch (2025-2027)
- 4.5 WORLD MARKET BY CLINICAL APPLICATION
- Highlights
- World Market by Clinical Application (2023-32)
- What's Shifting
- Key Growth Lenses by Application
- Who Contributes the Growth (2023->2032 lift)
- What This Means
- Competitive Landscape - by Clinical Application
- Deep Dives by Clinical Application
- Detection & Diagnosis
- Quantification & Analytics
- Workflow & Orchestration
- Reporting & Communication
- Image Reconstruction & Acquisition
- Strategic Takeaways for Vendors
- Signals to Watch (2025-2027)
- 4.6 WORLD MARKET BY TUMOR SITE
- Highlights
- What's Shifting (Mix Dynamics)
- World Market by Tumor Site (2023-32)
- Growth Lenses - by Tumor Site
- What This Means
- What Shifts Through 2032
- Commercial Takeaways
- Competitive Landscape - by Tumor Site
- Deep Dives by Tumor Site
- Breast
- Lung/Chest
- Prostate
- Colorectal
- Liver
- Neuro-Oncology
- Gynecologic
- Head & Neck
- Other (Rare)
- Strategic Takeaways
- Signals to Watch (2025-2027)
- 4.7 WORLD MARKET BY REVENUE STREAM
- Highlights
- What's Shifting
- World Market by Revenue Stream (2023-32)
- Growth Lenses - by Revenue Stream
- Who Contributes the Growth (2023->2032 Dollar Lift)
- What This Means
- Deep Dives by Revenue Stream
- Hardware
- Software
- Service
- Cloud/PPU
- Competitive Landscape - by Revenue Stream
- Signals to Watch (2025-2027)
- 4.8 WORLD MARKET BY END-USE ORGANIZATION TYPE
- Highlights
- What's Shifting
- World Market by End-Use Organization (2023-32)
- Growth Lenses by End-use
- Who Contributes the Growth (2023->2032 Dollar Lift)
- What this Means
- Deep Dives
- Academic/IDNs
- Comprehensive Cancer Centers
- Community Hospitals & Imaging Centers
- Teleradiology Providers
- Competitive Landscape - by End-Use
- Signals to Watch (2025-2027)
- 4.9 WORLD MARKET BY AI TECHNOLOGY
- Highlights
- What's Shifting
- World Market by AI Technology (2023-32)
- Growth Lenses - by AI Technology
- Who Contributes the Growth (2023->2032 Dollar Lift)
- What This Means
- Deep Dives by AI Technology (Oncology Lens)
- Competitive Landscape - by AI Technology
- Signals to Watch (2025-2027)
- 4.10 WORLD MARKET BY PATHWAY STAGE
- Highlights
- What's Shifting
- World Market by Pathway Stage (2023-32)
- Growth Lenses - by Pathway Stage
- Who Contributes the Growth (2023->2032 Dollar Lift)
- What This Means
- Competitive Landscape - by Pathway Stage
- Signals to Watch (2025-2027)
- HOW TO INTERPRET "MIX & MOMENTUM" MATRICES
- 4.11 REGIONAL MIX & MOMENTUM - WORLD ONCOLOGY IMAGING AI
- Executive Takeaways
- Marke by Region x Modality
- World Market by Region x Modality - 2023
- World Market by Region x Modality - 2032
- What's Shifting (Mix, 2032 Over/Under-index)
- Who Contributes the Growth (2023->2032 Lift)
- What This Means
- Market by Region x Revenue Stream
- World Market by Region x Revenue Stream - 2023
- World Market by Region x Revenue Stream - 2032
- What's Shifting (Mix, 2032 Over/Under Index)
- Who Contributes the Growth
- What This Means
- Market by Region x Clinical Application
- World Market by Region x Clinical Application - 2023
- World Market by Region x Clinical Application - 2032
- What's Shifting (Mix, 2032 Over/Under Index)
- Who Contributes the Growth
- What this Means
- Competitive Snapshots (Illustrative)
- 4.12 DISEASE-DRIVEN DEMAND MAP - WORLD ONCOLOGY IMAGING AI
- Executive Takeaways
- Tumor Site x Modality
- World Market by Tumor Site x Modality - 2023
- World Market by Tumor Site x Modality - 2032
- What's Shifting (2032 Mix vs Global)
- Who Contributes the Growth (2023->2032 Dollar Lift)
- What This Means
- Tumor Site x Clinical Application
- World Market by Tumor Site x Clinical Application - 2023
- What's Shifting (2032 Mix vs Global)
- World Market by Tumor Site x Clinical Application - 2032
- Who Contributes the Growth (2023->2032 Dollar Lift)
- What this means
- Tumor Site x Revenue Stream
- World Market by Tumor Site x Revenue Stream - 2023
- World Market by Tumor Site x Revenue Stream - 2032
- What's Shifting (2032 mix vs global)
- Who Contributes the Growth (2023->2032 Dollar lift)
- What This Means
- Competitive Snapshot (Illustrative, Oncology-focused)
- Signals to Watch
- 4.13 WORKFLOW ECONOMICS - WORLD ONCOLOGY IMAGING AI
- Modality x Revenue Stream
- World Market by Modality x Revenue Stream - 2023
- World Market by Modality x Revenue Stream - 20232
- Highlights
- What's Shifting (Mix & Over/Under-Index)
- Who Contributes the Growth (2023->2032 Dollar Lift)
- What This Means (Commercial Playbook)
- Competitive Lens (Illustrative)
- Clinical Application x Revenue Stream
- Highlights (2032 Pattern)
- World Market by Clinical Application x Revenue Stream - 2023
- World Market by Clinical Application x Revenue Stream - 2032
- What's Shifting (2023 -> 2032)
- Who Contributes the Growth (US$ M lift, 2023->2032)
- What This Means (Commercial Playbook by Application)
- Competitive Lens (Indicative, Non-exhaustive)
- Pricing Archetypes That Clear Approvals (What Buyers Say "Yes" to)
- Signals to Watch
- Risks & Watchouts
- Modality x Revenue Stream
- 4.14 PATHWAY STAGE ECONOMICS - WORLD ONCOLOGY IMAGING AI
- Pathway Stage x Revenue Stream
- Highlights
- World Market by Pathway Stage x Revenue Stream - 2023
- World Market by Pathway Stage x Revenue Stream - 2032
- What's Shifting (Mix vs Global)
- Who Contributes the Growth (2023 -> 2032 Dollar Lift)
- What This Means (Commercial Playbook)
- Competitive Lens (Indicative)
- Signals to Watch
- Pathway Stage x Modality - Where Each Stage Leans and Why
- World Market by Pathway Stage x Modality - 2023
- World Market by Pathway Stage x Modality - 2032
- Highlights (2032 Pattern vs World Mix)
- Where the Dollars Moved (2023 -> 2032)
- Stage-specific Readouts (2032 Shares Inside Each Stage)
- What This Means (Commercial Takeaways)
- Competitive Lens (Illustrative, not Exhaustive)
- Signals to Watch
- Pathway Stage x Clinical Application - How Workloads Drive Spend
- World Market by Pathway Stage x Clinical Application - 2023
- World Market by Pathway Stage x Clinical Application - 2032
- Highlights (2032 Pattern vs World Mix)
- Where the Dollars Moved (2023 -> 2032)
- What This Means (Commercial Playbook)
- Competitive Lens (Indicative)
- Signals to Watch
- Pathway Stage x End-use - Who Buys What, and Where Growth Concentrates
- World Context (2032 End-use Mix)
- World Market by Pathway Stage x End-use - 2023
- World Market by Pathway Stage x End-use - 2032
- Highlights (2032 Pattern vs Global Mix)
- Who Contributes the Growth (US$ M lift 2023->2032)
- What This Means (Commercial Playbook by Stage)
- Competitive Lens (Indicative, Non-exhaustive)
- Signals to Watch
- Pathway Stage x AI Technology - How Capability Mix Shifts Across the Cancer Pathway
- World Tech Mix
- World Market for Pathway Stage x AI Technology - 2023
- World Market for Pathway Stage x AI Technology - 2032
- Highlights (2032 Pattern vs Global Mix)
- Where the Dollars Moved (2023 -> 2032)
- What This Means (Commercial Playbook)
- Competitive Lens (indicative)
- Signals to Watch
- Pathway Stage x Revenue Stream

