


|
시장보고서
상품코드
1889066
웹 스케일 시장 추적(2025년 3분기) : 12개월 자본 지출 4,500억 달러 돌파 - 매출 14% 증가했으나 전년 대비 63% 급증한 자본 지출로 현금 흐름 악화 및 부채 증가, 엔비디아 주도권 확보 경쟁 가속화, 빅테크 CEO들 위험 분산 전략 펼치며 여전히 성장세 유지Webscale Market Tracker 3Q25 - 12 Month Capex Hits $450 Billion: Revenues up 14%, but 63% YoY Capex Surge Depresses Cash Flow and Worsens Debt, NVIDIA Races to Secure Dominance, Big Tech CEOs Hedge Bets but Continue Riding the Wave |
||||||
웹 스케일 추적을 시작한 2011년 CAPEX 총액은 연간 285억 달러였습니다. 약 7년 후인 2018년 2분기 동 섹터의 12개월간(연환산) CAPEX 총액은 최초로 1,000억 달러를 돌파했습니다. 더욱이 2022년 3분기에는 4년 후 최초로 2,000억 달러를 돌파했고, 3,000억 달러대를 그 2년 후인 2024년 4분기에 돌파하였습니다. 그 후 2분기를 거쳐 4,000억 달러에 이르렀고, 2025년 3분기에는 상승을 지속해 4,500억 달러에 이른 후 5,000억 달러대에 급속도로 접근하고 있습니다.
비주얼
당사는 1년 반 이상에 걸쳐 이 시장을 거품으로 예상했습니다. 이러한 예상은 AI를 반대하거나 AI가 세계에 가져올 거대한 가능성을 간과하는 것도 아닙니다. 인공지능은 놀라운 성장 가능성과 동시에 흔들릴 위험도 있습니다. 본사는 지난 30년간 수많은 기술 변화를 경험해 온 입장에서 하이프 사이클이 과열될 수 있음을 이해하고 있습니다. 또한 2008-2009년 금융위기에서 알 수 있듯이 혁신이 없는 투자 버블이 발생할 가능성도 인식하고 있습니다.
현재의 웹 스케일 시장에서는 실증된 비즈니스 모델이 부족한 한편, 비정상적인 수준의 과열 상황이 만연하고 있어 조정(크래시)이 늦게 일어날 수 있는 상황입니다. AI 투자는 미국 정부의 보조금, 대중 시장의 관심(그러나 지불 의향은 매우 낮음), 구매자와 판매자의 자기 강화 루프, 그리고 "결과보다 시기를 중시하는" AI 옹호론자에 의해 지원되어 왔습니다.
웹 스케일 기업에 의한 AI 구동형 인프라의 확장은 기록을 계속 경신하고 있습니다. 2025년 3분기에 웹 스케일 추적 대상인 25개 기업의 수익은 7,490억 달러(전년 대비 14.0%), CAPEX는 1,290억 달러(동 63.0%), R&D 비용은 990억 달러(동 23.6%)에 이르렀으며 현금 잔액은 6,4%인 반면 부채는 5,720억 달러(4.0%)였습니다. 순유형 고정자산은 전년 대비 41.1% 증가한 1조 2,270억 달러로 급증하였습니다. 마지막으로 직원 수는 458만 명(1.9%)에 달했습니다.
대상 기업
- 합계 25개사: 21개사가 운영 중으로 공개 데이터를 보고하였으며, 4개사는 비운영(ChinaCache), 비공개화(Twitter), 또는 타사 산하(Altaba와LinkedIn)로 보고하였음
- 운영 중인 21개 회사: Alibaba, Alphabet, Amazon, Apple, Baidu, Cognizant, CoreWeave, eBay, Fujitsu, HPE, IBM, JD.COM, Kuuaishou, Meta(FB), Microsoft, Nebius, Oracle, SAP, Tencent, Xiaomi, Yandex
- 2025년 2분기에는 Kuaishou, Nebius, Xiaomi의 3사가 새롭게 추가되었고 CoreWeave는 2024년 4분기 에 추가됨
- 대상 벤더: AMD, Arista, Ciena, Cisco, HPE, Infinera, Intel, Juniper, Nokia, NVIDIA, Wiwynn
이 보고서는 세계의 주요 웹 스케일 기업의 동향을 추적하고 수익, 설비 투자, 고용 등 다양한 데이터를 요약 제공합니다.
목차
제1장 보고서 하이라이트
제2장 전망
제3장 분석
제4장 주요 통계
제5장 기업 상세 분석
제6장 기업 벤치마킹
제7장 지역별 분석
제8장 원시 데이터
제9장 환율
제10장 당사에 대해서
CSM 25.12.23In 2011, the year we started tracking webscale, capex totaled $28.5 billion for the year. About 7 years later, the sector's 12 month ("annualized") capex total first exceeded $100B, in 2Q18. Four years later, capex first rose above $200B, in 3Q22. The $300B mark was broken 2 years later, in 4Q24. Two quarters after that, capex hit $400B. In 3Q25, capex kept rising, to reach $450B and on the way rapidly to the $500B mark.
VISUALS

We have been calling this market a bubble for over a year-and-a-half. That's not because we dislike AI, or fail to see its massive potential to impact the planet. We see incredible upside in artificial intelligence, but we also see the downside risks. Moreover, we have lived through many technology transitions over the last 30 years, and understand that hype cycles can get out of hand. And investment bubbles can happen even without technology changes at play, as we were reminded during the financial crisis of 2008-9.
With today's webscale market, a crash is overdue, as this market is plagued by insane levels of hype but very little in the way of proven business models. AI spend has been propped up by a combination of US government subsidies, mass market consumer interest (but very little willingness to pay), a self-reinforcing loop between buyers and sellers, and AI hypemasters eager to be first - even if they have no idea what benefits this may deliver, if any.
Webscale's AI-driven infrastructure buildout keeps breaking records. In 3Q25, the 25 companies in our Webscale Tracker generated $749 billion (B) in revenue (+14.0% YoY), spent $129B on capex (+63.0%), poured $99B into R&D (+23.6%), and held $641B in cash (flat YoY) against $572B in debt (+4.0%). Net PP&E surged 41.1% YoY to $1.227 trillion. Headcount hit 4.58 million employees (+1.9% YoY).
Notes: (1) This is MTN Consulting's 32nd quarterly assessment of the webscale market, part of a series we launched in 4Q17; our data and analysis spans the 1Q11-3Q25 timeframe, i.e. 59 quarters. (2) The 25 companies in our study include several recent additions: CoreWeave (added last year), and this quarter's three new adds: Kuaishou, Nebius (Yandex spinoff), and Xiaomi.
Revenue: Topline grows at 14% YoY rate again, led by Meta, Xiaomi, and Microsoft
Webscale revenues reached $749B in 3Q25, up 14% YoY, with annualized revenues rising to $2.91T (+12.1%). The largest players remain Amazon ($180.2B), Apple ($102.5B), Alphabet ($102.3B), Microsoft ($77.7B), and Meta ($51.2B). Meta continues to deliver above 20% growth, driven by strength in the US and Canada.
The fastest growth came from Coreweave, which shifted from crypto mining to GPU rentals with early backing from NVIDIA. Its rapid rise and limited competitive defenses have raised comparisons to past cycle "tells," such as 360networks in the dot-com era. Among major players, Meta and Xiaomi both exceeded 20% growth. Xiaomi cited returns from its 2025 AI investments as well above expectations. Microsoft, Alphabet, and Tencent grew in the mid-teens. Baidu lagged, and Fujitsu declined due partly to FX and restructuring.
Advertising remains central for several firms. Meta is the most exposed, with ads still driving nearly all revenue. Alphabet's non-ad share has risen to almost 25%. Amazon is pushing into ads and is nearing 10% of revenues. Ad-dependent companies face higher risk if US consumer spending weakens in 2026. A further open question is whether scaled AI platforms will rely heavily on ads, given slow traction for paid models outside early adopters.
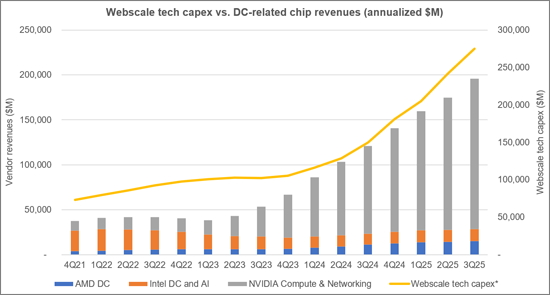
Capex: AI hype boosts capex to $450 billion over 12 months
Webscale technology spending continues to surge. R&D rose nearly 16% YoY, reaching a record share of revenues, driven heavily by Meta, whose quarterly R&D topped $15B (+35% YoY). Across the sector, R&D is increasingly concentrated in AI. Capex expanded even faster, rising 71% over the latest 12 months to roughly $450B, pushing net PP&E up 41% in 3Q25.
Capex has now grown more than 50% YoY for six consecutive quarters, lifting capital intensity to 15.5%. Tech-related capex exceeds 60% of the total, focused on data center buildouts, servers, power systems, and emerging investment in fiber and transport. NVIDIA's influence remains strong, fueling both demand and competitive fear, including its recent move into mobile RAN with Nokia. Oracle and Meta lead in tech capex intensity among major players; Apple and JD are lowest.
R&D intensity also climbed to an all-time high of 12.4% of revenues. Meta is the clear leader, followed by SAP and Oracle. At the opposite end, Fujitsu and JD have retreated from cloud and that's apparent in their R&D spend.
Net PP&E per employee averaged $268K in 3Q25 but exceeded $2M at Meta, reflecting automation and aggressive data center expansion. SAP, IBM, JD, and Cognizant remain asset-light as they shrink their owned footprints.
Webscale capex, negligible a decade ago, surpassed $400B annualized in 2Q25 and now exceeds telco capex by almost 50%. US deployments account for an outsized share-peaking at 66% of global capex in 2024-driven by AI-related buildouts such as the nearly 5.2 Gigawatts of capacity currently under construction in the US, per CBRE.
Profitability: Free cash flow margin falls to all-time low of 12.8%
Average net margin (net income/revenue) and FCF margin (FCF/revenue) for the webscale market rebounded after the 2022 crash, but FCF margin is now at an all-time low of 12.8%. FCF is cash from operations minus capital expenditures (capex) and is generally a more reliable profit metric than net income.
The low FCF margin is primarily due to an explosion in capex spending. While webscalers retain a large cash buffer, the gap between sector debt and cash reserves has significantly shrunk. For context, during the 2018 capex surge, FCF margins were a much higher 17% to 18%.
On a per-employee basis, Apple and Meta are leaders, each recording FCF well over $500,000 in the last 12 months. Apple's high figures are partly due to its cautious stance on AI-related capex. In terms of FCF margins by company, Tencent and Microsoft lead, closely followed by Apple and Meta.
Regulatory fines and civil lawsuits represent a persistent, though minor, risk to profitability. Webscalers consistently treat this as a "cost of doing business," often ignoring rulings, aggressively fighting them in court, and using public relations to minimize backlash, moving far from the earlier "don't be evil" philosophy.
Employment: Headcount steps up by 1.9% YoY to 4.58 million employees
Headcount ended 3Q25 at about 4.58 million employees, up 1.9% YoY. Total headcount is a tricky metric in webscale, as the sector's employee base is influenced heavily by logistics, fulfillment and delivery employees at companies like Amazon, Alibaba, and JD.Com. Among the more tech-centric webscalers, Microsoft's YoY 3% decline is notable. Meta and Alphabet saw slight increases, though.
Webscale surpassed telecom employment in the last few quarters, but headcount for both segments will likely fall going forward. Already, for webscalers, metrics like revenue per employee and net PP&E per employee have made sizable gains in the last 2-3 years.
Regional Trends: Europe leads regions with 18% YoY growth in 3Q25
Regionally, Europe had the best quarter in 3Q25, growing revenues by 18% YoY. Asia Pacific and MEA both grew by 14% YoY, the same as the overall market, while the Americas lagged with 12% growth. The Americas is easily the biggest region, though, accounting for about 46% of global revenues in 2024.
While Amazon is #1 in both the Americas and Europe by revenues, other regions differ: JD.Com leads in Asia (Amazon is #4), while in the MEA region Amazon is outpaced by Alphabet and Apple.
Companies covered:
- 25 in total: 21 active and reporting data publicly, 4 either inactive (ChinaCache), gone private (Twitter), or now part of other companies (Altaba and LinkedIn).
- The 21 active companies include: Alibaba, Alphabet, Amazon, Apple, Baidu, Cognizant, CoreWeave, eBay, Fujitsu, HPE, IBM, JD.COM, Kuaishou, Meta (FB), Microsoft, Nebius, Oracle, SAP, Tencent, Xiaomi, and Yandex
- Three new companies have been added in 2Q25: Kuaishou, Nebius, and Xiaomi. CoreWeave was added in 4Q24.
- Vendors addressed: AMD, Arista , Ciena, Cisco, HPE, Infinera, Intel, Juniper, Nokia, NVIDIA, and Wiwynn
Table of Contents
1. Report highlights
2. Outlook
3. Analysis
4. Key Stats
5. Company Drilldown
6. Company Benchmarking
7. Regional Breakouts
8. Raw Data
9. Exchange Rates
10. About
(주말 및 공휴일 제외)


