|
시장보고서
상품코드
1457955
의료기기 렌탈 시장 : 시장 규모, 점유율 분석, 산업 수요 예측(-2030년)Healthcare Equipment Rental Market Size and Share Analysis by Product, End User - Global Industry Demand Forecast to 2030 |
||||||
전 세계 의료기기 렌탈(Healthcare Equipment Rental) 시장 규모는 2023년에 591억 달러였으며, 2024년부터 2030년에 걸쳐 5.7%의 CAGR로 성장하여 2030년에는 868억 달러에 달할 것으로 예측되고 있습니다.
내구형 의료기기 카테고리가 큰 점유율을 차지
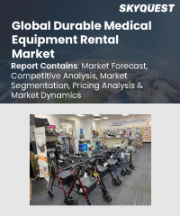
내구형 의료기기는 반복적으로 자주 사용하기에 적합하므로 35%의 큰 점유율을 차지합니다. 신체장애인과 노인 인구 증가는 이동 보조기구 및 보조기구 수요를 촉진하고, 이 카테고리의 성장을 뒷받침하고 있습니다.
모니터링 장비와 치료 장비는 특히 매일 생체 점검을 위한 무선 모니터링 장비에 대한 요구가 증가함에 따라 대폭적인 임대 소득의 성장이 예상됩니다.
병원이 가장 큰 최종 사용자
최종 사용자별로는 2023년에 병원 카테고리가 40%의 점유율을 차지하고 있습니다. 이는 의료 인프라 강화 및 환자 수 증가에 대한 정부 지침이 진행되고 있기 때문입니다. 최근 몇 년동안 병원에서는 다양한 장비를 완전히 구입하는 대신 렌탈을 시작했습니다.
북미가 시장을 석권
2023년에는 북미가 295억 달러로 업계를 지배하고 있습니다. 이는 기술적으로 강화된 아이템에 대한 높은 요구와 엄청난 수의 임대 서비스 제공업체의 존재 때문입니다.
미국 의료 산업은 CAGR 5.8%로 성장할 것으로 예상됩니다. 만성 질환의 발생률 증가, 견고한 의료 인프라, 제도 발전, 의료 수요 증가, 업계 선도적 존재 등이 이를 지원하고 있습니다.
미국에는 2022년에 6,129개의 병원이 있으며, 34,011,386명이 입원했으며, 병원의 총 경비는 1조 2,138억 8,100만 달러에 달했습니다.
세계의 의료기기 렌탈(Healthcare Equipment Rental) 시장에 대해 분석했으며, 시장의 기본 구조/최신 정세/주요 촉진·억제 요인/세계 전체 및 지역별·주요 국가별 시장 규모 동향 전망(금액 기준, 2017-2030년) 제품별 최종 사용자별 상세 동향/현재 시장 경쟁 구도/주요 기업 프로파일 등 정보를 전해드립니다.
목차
제1장 조사 범위
제2장 조사 방법
제3장 주요 요약
제4장 시장 지표
제5장 산업 전망
- 시장 역학
- 동향
- 성장 촉진 요인
- 억제 요인/과제
- 성장 촉진 요인/억제 요인의 영향 분석
- COVID-19의 영향
- Porter's Five Forces 분석
제6장 시장
- 개요
- 시장 매출 : 제품별(2017-2030년)
- 시장 매출 : 최종 사용자별(2017-2030년)
- 시장 매출 : 지역별(2017-2030년)
제7장 북미 시장
- 개요
- 시장 매출 : 제품별(2017-2030년)
- 시장 매출 : 최종 사용자별(2017-2030년)
- 시장 매출 : 국가별(2017-2030년)
제8장 유럽 시장
제9장 아시아 태평양 시장
제10장 남미 시장
제11장 중동 및 아프리카(MEA) 시장
제12장 미국 시장
- 개요
- 시장 매출 : 제품별(2017-2030년)
- 시장 매출 : 최종 사용자별(2017-2030년)
제13장 캐나다 시장
제14장 독일 시장
제15장 프랑스 시장
제16장 영국 시장
제17장 이탈리아 시장
제18장 스페인 시장
제19장 일본 시장
제20장 중국 시장
제21장 인도 시장
제22장 호주 시장
제23장 한국 시장
제24장 브라질 시장
제25장 멕시코 시장
제26장 사우디아라비아 시장
제27장 남아프리카 시장
제28장 아랍에미리트(UAE) 시장
제29장 경쟁 구도
- 시장 진출기업 및 제공 제품 및 서비스 목록
- 주요 기업의 경쟁 벤치마킹
- 주요 기업의 제품 벤치마킹
- 최근의 전략 전개 상황
제30장 기업 프로파일
- Hill-Rom Holdings Inc.
- Agiliti Inc.
- Oak Leasing Ltd.
- Koninklijke Philips NV
- Mizuho Leasing Co. Ltd.
- Siemens Limited
- Med One Group
- Westside Medical Supply
- Nunn's Home Medical Equipment
제31장 부록
LYJ 24.04.16In 2023, the healthcare equipment rental market was valued at USD 59.1 billion and is projected to grow at a CAGR of 5.7% from 2024 to 2030, reaching USD 86.8 billion by 2030.
Market Drivers
Improving healthcare infrastructure is a key driver for the healthcare equipment rental market, impacting both demand and supply aspects:
Investments in hospital infrastructure upgrades worldwide have led to a higher demand for medical instruments, especially in modernized healthcare facilities.
The establishment of new healthcare facilities, particularly in emerging economies like India and China, contributes to the growing need for healthcare equipment rental services.
Rising equipment costs prompt healthcare providers to opt for rental services as a cost-effective solution, coupled with tax benefits that encourage rental usage.
Significant investments by public organizations globally, such as in the U.S., India, and China, to upgrade healthcare infrastructure, directly impact the demand for medical instruments and equipment rental services.
The rising costs of purchasing medical equipment drive healthcare providers to opt for rental services as a cost-effective alternative. This factor, combined with the tax benefits associated with renting, encourages healthcare facilities to utilize equipment rental solutions.
Durable Medical Equipment Category Holds Significant Share
Durable medical equipment accounts for a major share of 35% due to its suitability for repetitive and frequent use.
The growing disabled and elderly population is driving the demand for mobility aids and assistive devices, boosting this category's growth.
Monitoring and therapeutic equipment are expected to experience substantial rental revenue growth, particularly due to the increasing need for wireless monitoring devices for daily vital checks.
This demand is boosted by the rising prevalence of lifestyle-related diseases.
Hospitals Are Largest End Users
In 2023, on the basis of end-user, the hospitals category is dominating, with a share of 40%, this can be credited to the advancing government guidelines about the growth of enhanced medical infrastructure and the increasing count of patients. In recent years, hospitals have started to rent a variety of devices, instead of wholly buying them.
Moreover, the growing need for dissolving frozen capital, along with the rising worries regarding inefficient capital distribution, is propelling the need for medical device leasing.
North America Is Dominating the Market
In 2023, the North American region is dominating the industry, with a value of USD 29.5 billion. This can be credited to the high need for technically enhanced items and the presence of a huge count of leasing service providers.
The increase in device prices results in less money spent on the latest therapies, which in turn drives a trend towards the use of instrument rentals as cost-friendly alternatives.
The U.S. healthcare industry is anticipated to grow at a CAGR of 5.8%, supported by increased incidence of chronic diseases, solid medical infrastructure, systemic development, expanding healthcare demand, and the existence of major industry players.
Based on the American Hospital Association, the United States had 6,129 hospitals, in 2022, which admitted 34,011,386 people, and the total expenses for hospitals reached USD 1,213,881 million.
A high healthcare demand among U.S. citizens may lead to the purchase of new sophisticated and costly medical equipment, forcing mid-size and small hospitals to opt for leasing rather than purchasing due to growing needs.
Table of Contents
Chapter 1. Research Scope
- 1.1. Research Objectives
- 1.2. Market Definition
- 1.3. Analysis Period
- 1.4. Market Size Breakdown by Segments
- 1.4.1. Market size breakdown, by product
- 1.4.2. Market size breakdown, by end user
- 1.4.3. Market size breakdown, by region
- 1.4.4. Market size breakdown, by country
- 1.5. Market Data Reporting Unit
- 1.5.1. Value
- 1.6. Key Stakeholders
Chapter 2. Research Methodology
- 2.1. Secondary Research
- 2.1.1. Paid
- 2.1.2. Unpaid
- 2.1.3. P&S Intelligence database
- 2.2. Primary Research
- 2.3. Market Size Estimation
- 2.4. Data Triangulation
- 2.5. Currency Conversion Rates
- 2.6. Assumptions for the Study
- 2.7. Notes and Caveats
Chapter 3. Executive Summary
Chapter 4. Market Indicators
Chapter 5. Industry Outlook
- 5.1. Market Dynamics
- 5.1.1. Trends
- 5.1.2. Drivers
- 5.1.3. Restraints/challenges
- 5.1.4. Impact analysis of drivers/restraints
- 5.2. Impact of COVID-19
- 5.3. Porter's Five Forces Analysis
- 5.3.1. Bargaining power of buyers
- 5.3.2. Bargaining power of suppliers
- 5.3.3. Threat of new entrants
- 5.3.4. Intensity of rivalry
- 5.3.5. Threat of substitutes
Chapter 6. Global Market
- 6.1. Overview
- 6.2. Market Revenue, by Product (2017-2030)
- 6.3. Market Revenue, by End User (2017-2030)
- 6.4. Market Revenue, by Region (2017-2030)
Chapter 7. North America Market
- 7.1. Overview
- 7.2. Market Revenue, by Product (2017-2030)
- 7.3. Market Revenue, by End User (2017-2030)
- 7.4. Market Revenue, by Country (2017-2030)
Chapter 8. Europe Market
- 8.1. Overview
- 8.2. Market Revenue, by Product (2017-2030)
- 8.3. Market Revenue, by End User (2017-2030)
- 8.4. Market Revenue, by Country (2017-2030)
Chapter 9. APAC Market
- 9.1. Overview
- 9.2. Market Revenue, by Product (2017-2030)
- 9.3. Market Revenue, by End User (2017-2030)
- 9.4. Market Revenue, by Country (2017-2030)
Chapter 10. LATAM Market
- 10.1. Overview
- 10.2. Market Revenue, by Product (2017-2030)
- 10.3. Market Revenue, by End User (2017-2030)
- 10.4. Market Revenue, by Country (2017-2030)
Chapter 11. MEA Market
- 11.1. Overview
- 11.2. Market Revenue, by Product (2017-2030)
- 11.3. Market Revenue, by End User (2017-2030)
- 11.4. Market Revenue, by Country (2017-2030)
Chapter 12. U.S. Market
- 12.1. Overview
- 12.2. Market Revenue, by Product (2017-2030)
- 12.3. Market Revenue, by End User (2017-2030)
Chapter 13. Canada Market
- 13.1. Overview
- 13.2. Market Revenue, by Product (2017-2030)
- 13.3. Market Revenue, by End User (2017-2030)
Chapter 14. Germany Market
- 14.1. Overview
- 14.2. Market Revenue, by Product (2017-2030)
- 14.3. Market Revenue, by End User (2017-2030)
Chapter 15. France Market
- 15.1. Overview
- 15.2. Market Revenue, by Product (2017-2030)
- 15.3. Market Revenue, by End User (2017-2030)
Chapter 16. U.K. Market
- 16.1. Overview
- 16.2. Market Revenue, by Product (2017-2030)
- 16.3. Market Revenue, by End User (2017-2030)
Chapter 17. Italy Market
- 17.1. Overview
- 17.2. Market Revenue, by Product (2017-2030)
- 17.3. Market Revenue, by End User (2017-2030)
Chapter 18. Spain Market
- 18.1. Overview
- 18.2. Market Revenue, by Product (2017-2030)
- 18.3. Market Revenue, by End User (2017-2030)
Chapter 19. Japan Market
- 19.1. Overview
- 19.2. Market Revenue, by Product (2017-2030)
- 19.3. Market Revenue, by End User (2017-2030)
Chapter 20. China Market
- 20.1. Overview
- 20.2. Market Revenue, by Product (2017-2030)
- 20.3. Market Revenue, by End User (2017-2030)
Chapter 21. India Market
- 21.1. Overview
- 21.2. Market Revenue, by Product (2017-2030)
- 21.3. Market Revenue, by End User (2017-2030)
Chapter 22. Australia Market
- 22.1. Overview
- 22.2. Market Revenue, by Product (2017-2030)
- 22.3. Market Revenue, by End User (2017-2030)
Chapter 23. South Korea Market
- 23.1. Overview
- 23.2. Market Revenue, by Product (2017-2030)
- 23.3. Market Revenue, by End User (2017-2030)
Chapter 24. Brazil Market
- 24.1. Overview
- 24.2. Market Revenue, by Product (2017-2030)
- 24.3. Market Revenue, by End User (2017-2030)
Chapter 25. Mexico Market
- 25.1. Overview
- 25.2. Market Revenue, by Product (2017-2030)
- 25.3. Market Revenue, by End User (2017-2030)
Chapter 26. Saudi Arabia Market
- 26.1. Overview
- 26.2. Market Revenue, by Product (2017-2030)
- 26.3. Market Revenue, by End User (2017-2030)
Chapter 27. South Africa Market
- 27.1. Overview
- 27.2. Market Revenue, by Product (2017-2030)
- 27.3. Market Revenue, by End User (2017-2030)
Chapter 28. U.A.E. Market
- 28.1. Overview
- 28.2. Market Revenue, by Product (2017-2030)
- 28.3. Market Revenue, by End User (2017-2030)
Chapter 29. Competitive Landscape
- 29.1. List of Market Players and their Offerings
- 29.2. Competitive Benchmarking of Key Players
- 29.3. Product Benchmarking of Key Players
- 29.4. Recent Strategic Developments
Chapter 30. Company Profiles
- 30.1. Hill-Rom Holdings Inc.
- 30.1.1. Business overview
- 30.1.2. Product and service offerings
- 30.1.3. Key financial summary
- 30.2. Agiliti Inc.
- 30.2.1. Business overview
- 30.2.2. Product and service offerings
- 30.2.3. Key financial summary
- 30.3. Oak Leasing Ltd.
- 30.3.1. Business overview
- 30.3.2. Product and service offerings
- 30.3.3. Key financial summary
- 30.4. Koninklijke Philips N.V.
- 30.4.1. Business overview
- 30.4.2. Product and service offerings
- 30.4.3. Key financial summary
- 30.5. Mizuho Leasing Co. Ltd.
- 30.5.1. Business overview
- 30.5.2. Product and service offerings
- 30.5.3. Key financial summary
- 30.6. Siemens Limited
- 30.6.1. Business overview
- 30.6.2. Product and service offerings
- 30.6.3. Key financial summary
- 30.7. Med One Group
- 30.7.1. Business overview
- 30.7.2. Product and service offerings
- 30.7.3. Key financial summary
- 30.8. Westside Medical Supply
- 30.8.1. Business overview
- 30.8.2. Product and service offerings
- 30.8.3. Key financial summary
- 30.9. Nunn's Home Medical Equipment
- 30.9.1. Business overview
- 30.9.2. Product and service offerings
- 30.9.3. Key financial summary
Chapter 31. Appendix
- 31.1. Abbreviations
- 31.2. Sources and References
- 31.3. Related Reports


