|
시장보고서
상품코드
1721390
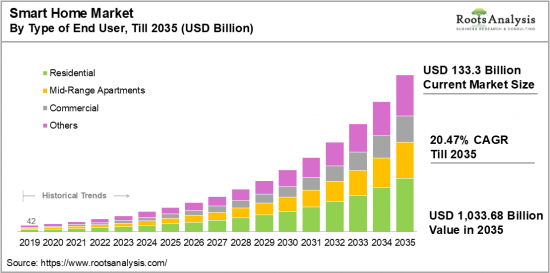
스마트홈 시장(-2035년) : 제품 유형, 프로토콜, 적용 구분, 소프트웨어 및 서비스, 최종사용자, 판매채널, 주요 지역별 산업 동향과 예측Smart Home Market, Till 2035: Distribution by Type of Products, Type of Protocol, Type of Application, Type of Software & Services, Type of End User, Type of Sales Channel, Key Geographical Regions : Industry Trends and Global Forecasts |
||||||
세계 스마트홈 시장 규모는 현재 1,333억 달러에서 예측 기간 동안 20.47%의 연평균 복합 성장률(CAGR)로 2035년까지 1조 336억 8,000만 달러로 성장할 것으로 예측됩니다.

스마트홈 시장 기회: 부문별
제품 유형별
- 엔터테인먼트 기기
- 스마트 디스플레이 및 TV
- 사운드바 및 스피커
- 스트리밍 장치
- 가전제품
- 스마트 진공청소기
- 스마트 세탁기
- 스마트 온수기
- 홈 헬스케어
- 에어컨
- 센서
- 스마트 온도 조절기
- 스마트 벤트
- 기타
- 조명 제어
- 조광기
- 재실감지 센서
- 릴레이 및 스위치
- 스마트 라이트
- 기타 제품
- 보안 및 접근제어
- 원격 모니터링 소프트웨어 & 서비스
- 보안 카메라
- 스마트락
- 비디오 도어폰
- 기타
- 스마트 주방 가전
- 쿠킹 히터
- 식기 세척기 및 건조기
- 전자레인지 및 오븐
- 냉장고
- 스마트 가구
- 기타 장비
프로토콜별
- 하이브리드
- C-BUS
- Insteon
- 무선 프로토콜
- 블루투스
- EnOcean
- Thread
- Wi-Fi
- ZigBee
- Z Wave
- 기타
- 유선 프로토콜
- BACnet
- DALI
- 이더넷
- KNX
- LONWoks
- ModBus
- UPB
- X10
적용 구분별
- 신규
- 레트로핏
소프트웨어 및 서비스 유형별
- 액티브 기반형
- 프로액티브 유형
최종 사용자별
- 주택 최종 사용자
- 중급 아파트 및 주택
- 지원주택
- 저에너지 주택
- 상업용 최종 사용자
- 스마트 병원
- 스마트 호텔
- 기타 상업용 빌딩
판매 채널별
- 직접 판매
- 간접 판매
지역별
- 북미
- 미국
- 캐나다
- 멕시코
- 기타 북미 국가
- 유럽
- 오스트리아
- 벨기에
- 덴마크
- 프랑스
- 독일
- 아일랜드
- 이탈리아
- 네덜란드
- 노르웨이
- 러시아
- 스페인
- 스웨덴
- 스위스
- 영국
- 기타 유럽 국가
- 아시아
- 중국
- 인도
- 일본
- 싱가포르
- 한국
- 기타 아시아 국가
- 라틴아메리카
- 브라질
- 칠레
- 콜롬비아
- 베네수엘라
- 기타 라틴아메리카 국가
- 중동 및 북아프리카
- 이집트
- 이란
- 이라크
- 이스라엘
- 쿠웨이트
- 사우디아라비아
- 아랍에미리트(UAE)
- 기타 중동 및 북아프리카 국가
- 세계 기타 지역
- 호주
- 뉴질랜드
- 기타 국가
스마트홈 시장 : 성장과 동향
첨단 기술의 보급과 함께 스마트 홈 기기의 인기는 계속 증가하고 있으며, AI와 IoT의 등장은 그 수요를 촉진하고 있습니다. 또한, 스마트폰 사용자 증가와 5G 인터넷 기술의 보급은 IoT 가전제품의 수용을 촉진하는 주요 요인으로 작용하고 있으며, AI와 머신러닝이 Google Google 및 Alexa와 같은 디지털 비서에 통합되어 음성 명령으로 작업을 자동화할 수 있게 됨에 따라 사용자 경험은 더욱 고도화되고 편리해졌습니다. 사용자 경험은 더욱 고도화되고 편리해졌습니다. 특히 주목할 만한 점은 2024년 8월 애플이 시리를 대체할 홈 로봇을 도입하여 보다 개인화된 경험을 제공하겠다는 의사를 밝힌 점입니다. 스마트홈 자동화 외에도 스마트 오피스 시장 또한 상업 공간에서 IoT 가전제품의 광범위한 활용으로 인해 큰 영향을 받고 있습니다.
또한, 편의성에 대한 인식이 높아짐에 따라 스마트홈의 도입이 촉진되고 있으며, 이를 통해 편안함, 효율성, 보안 및 전반적인 삶의 질이 향상되고 있습니다. 또한, 혁신적인 제품의 장점과 접근 용이성에 대한 인식 확대, IoT 기술 채택 증가, 보안에 대한 관심 증가 등의 요인이 향후 예측 기간 동안 스마트홈 시장의 성장을 견인하는 중요한 요소로 작용할 것으로 예측됩니다.
세계의 스마트홈(Smart Home) 시장을 조사했으며, 시장 개요와 배경, 시장 영향요인 분석, 시장 규모 추이 및 예측, 각종 부문별/지역별 상세 분석, 경쟁 구도, 주요 기업 개요 등의 정보를 정리하여 전해드립니다.
목차
제1장 서문
제2장 조사 방법
제3장 경제적 및 기타 프로젝트 특유의 고려사항
제4장 거시경제 지표
제5장 주요 요약
제6장 서론
제7장 경쟁 구도
제8장 기업 개요
- 본 장의 개요
- ABB*
- ADT
- Amazon
- Apple
- Crestron Electronics
- Honeywell
- Robert Bosch
- Samsung Electronics
- Schneider Electric
- Siemens
- Sony
제9장 밸류체인 분석
제10장 SWOT 분석
제11장 세계의 스마트홈 시장
제12장 제품 유형별 시장 기회
제13장 프로토콜별 시장 기회
제14장 적용 구분별 시장 기회
제15장 소프트웨어 및 서비스별 시장 기회
제16장 최종사용자별 시장 기회
제17장 판매채널별 시장 기회
제18장 북미의 스마트홈 시장 기회
제19장 유럽의 스마트홈 시장 기회
제20장 아시아의 스마트홈 시장 기회
제21장 중동 및 북아프리카의 스마트홈 시장 기회
제22장 라틴아메리카의 스마트홈 시장 기회
제23장 세계 기타 지역의 스마트홈 시장 기회
제24장 표 형식 데이터
제25장 기업 및 단체 리스트
제26장 커스터마이즈 기회
제27장 ROOTS 구독 서비스
제28장 저자 상세
LSH 25.06.02Smart Home Market Overview
As per Roots Analysis, the global smart home market size is estimated to grow from USD 133.3 billion in the current year to USD 1,033.68 billion by 2035, at a CAGR of 20.47% during the forecast period, till 2035.
The opportunity for smart home market has been distributed across the following segments:
Type of Product
- Entertainment Devices
- Smart Display / TV
- Sound Bars & Speakers
- Streaming Devices
- Home Appliances
- Smart Vacuum Cleaners
- Smart Washing Machines
- Smart Water Heater
- Home Healthcare
- HVAC
- Sensors
- Smart Thermostats
- Smart Vents
- Others
- Lighting control
- Dimmers
- Occupancy Sensors
- Relays & Switches
- Smart Lights
- Other Products
- Security & Access Controls
- Remote Monitoring Software & Services
- Security Cameras
- Smart Locks
- Video Door Phones
- Others
- Smart Kitchen Appliances
- Cooktops
- Dishwasher
- Microwave / Ovens
- Refrigerators
- Smart Furniture
- Other Devices
Type of Protocols
- Hybrid
- C-BUS
- Insteon
- Wireless Protocols
- Bluetooth
- EnOcean
- Thread
- Wi-Fi
- ZigBee
- Z Wave
- Others
- Wired Protocols
- BACnet
- DALI
- Ethernet
- KNX
- LONWoks
- ModBus
- UPB
- X10
Type of Application
- New Constructions
- Retrofit
Type of Software & Services
- Behavioral
- Proactive
Type of End User
- Residential End-User
- Mid-Range Apartments / Homes
- Assisted Homes
- Low Energy Homes
- Commercial End-Users
- Smart Hospitals
- Smart Hotels
- Other Commercial Buildings
Type of Sales Channel
- Direct
- Indirect
Geographical Regions
- North America
- US
- Canada
- Mexico
- Other North American countries
- Europe
- Austria
- Belgium
- Denmark
- France
- Germany
- Ireland
- Italy
- Netherlands
- Norway
- Russia
- Spain
- Sweden
- Switzerland
- UK
- Other European countries
- Asia
- China
- India
- Japan
- Singapore
- South Korea
- Other Asian countries
- Latin America
- Brazil
- Chile
- Colombia
- Venezuela
- Other Latin American countries
- Middle East and North Africa
- Egypt
- Iran
- Iraq
- Israel
- Kuwait
- Saudi Arabia
- UAE
- Other MENA countries
- Rest of the World
- Australia
- New Zealand
- Other countries
SMART HOME MARKET: GROWTH AND TRENDS
Smart homes are contemporary dwellings that offer convenience, security, and efficiency through the installation of internet-connected smart devices and appliances, enabling remote control via smartphones, tablets, and voice-activated interfaces. The range of smart home products includes various devices, such as smart lighting, security systems, cameras, thermostats, entertainment systems, and kitchen appliances, which are among the most favored smart home items. The aim of smart home technology is to enhance convenience, security, and overall home management from any location using connected devices, thus making a substantial contribution to the concept of smart cities.
As advanced technology becomes more prevalent, the popularity of smart home devices continues to rise, driven by the emergence of artificial intelligence and the Internet of Things (IoT), which has resulted in increased demand for smart home products. Further, the increasing number of smartphone users paired with 5G internet technology has played a key role in the acceptance of IoT household appliances. The integration of AI and machine learning with digital assistants like Google Assistant and Alexa, which facilitate task automation through voice commands, is offering an enhanced and more convenient user experience. Notably, in August 2024, Apple revealed its intention to replace Siri with a home robot to deliver a more personalized experience for users. In addition to home automation, the smart office market has been primarily influenced by the widespread use of IoT technology household appliances in commercial settings.
Moreover, the rising awareness for convenience is driving the adoption of smart homes, which provide improved comfort, efficiency, security, and overall quality of life. Moreover, the growing awareness of the benefits and accessibility of innovative products, the rise in IoT technology adoption, and heightened security concerns are some of the critical factors expected to drive the potential growth of the market during the forecast period.
SMART HOME MARKET: KEY SEGMENTS
Market Share by Type of Product
Based on the type of product, the global smart home market is segmented into entertainment devices (smart display / TV, sound bars & speakers, streaming devices), home appliances (smart vacuum cleaners, smart washing machines and smart water heater), home healthcare, HVAC (sensors, smart thermostats, vents and others) lighting control (dimmers, occupancy sensors, relays & switches, smart lights and other products) security & access controls (remote monitoring software & services, security cameras, smart locks, video door phones and others), smart furniture, smart kitchen appliances, (cooktops, dishwasher, microwave/ovens and refrigerators) and other devices.
According to our estimates, currently, entertainment device segment captured the majority share of the market. This can be attributed to the growing demand for smart displays / TVs, sound bars, and streaming devices. The rise in digitalization and the increasing integration of IoT technology have led to a surge in the adoption of smart entertainment devices. Additionally, the increase in consumer expenditure on entertainment software and devices has further bolstered the growth of this segment. However, security and access control segment is anticipated to experience the highest CAGR during the forecast period.
Market Share by Type of Protocol
Based on type of protocol, the smart home market is segmented into hybrid (C-BUS and Insteon), wireless protocol (Bluetooth, EnOcean BACnet, DALI, Ethernet, KNX, LonWorks, Modbus, UPB, and X10), and wired Protocols. According to our estimates, currently, wireless protocol captures the majority share of the market. This can be attributed to the increased demand for devices that connect wirelessly, like Wi-Fi, ZigBee, and Bluetooth for mobile connectivity.
Market Share by Type of Application
Based on type of application, the smart home market is segmented into new construction and retrofit. According to our estimates, currently, new construction segment captures the majority share of the market. This can be attributed to the simplicity of integrating smart devices in new projects and the rising number of residential buildings worldwide. Typically, new construction undertakings integrate numerous smart home products because of the straightforward logistics involved in their installation. However, retrofitting segment is anticipated to grow at a higher CAGR during the forecast period.
Market Share by Type of Software and Type of Services
Based on type of software and type of services, the smart home market is segmented into behavioral and proactive. According to our estimates, currently, proactive software segment captures the majority share of the market.
Utilizing artificial intelligence and machine learning, proactive software can anticipate user needs and preferences while assisting in scheduling and making adjustments as needed. For example, a smart lighting system is capable of automatically modifying the lighting based on the time of day and the habits of the user. Further, this software offers tailored functionality for smart home devices and enables higher data transfer rates compared to its behavioral counterpart. As a result, this segment is expected to experience substantial growth throughout the projected period.
Market Share by Type of End-User
Based on type of end-user, the smart home market is segmented into residential end-users (luxury homes, mid-range apartments / homes, assisted homes and low-energy homes), commercial end-users (smart hotels and smart hospitals), and other commercial buildings. According to our estimates, currently, commercial end users segment captures the majority share of the market. This can be attributed to the widespread use of smart home technology in establishments like smart hotels and hospitals, which often necessitate advanced features such as surveillance cameras, alarm systems, smart locks, and lighting designed for human needs to ensure convenience, security, and safety. Moreover, these smart devices can be managed remotely using connected gadgets like smartphones, tablets, and remotes, promoting energy efficiency.
However, residential user segment is anticipated to experience the highest CAGR during the forecast period.
Market Share by Type of Sale Channels
Based on type of sale channels, the smart home market is segmented into direct and indirect. According to our estimates, currently, indirect sales channel captures the majority share of the market. However, direct sales channels, or physical retail stores segment is anticipated to experience the highest CAGR during the forecast period.
Market Share by Geography
Based on geography, the smart home market is segmented into North America, Europe, Asia, Latin America, Middle East and North Africa, and Rest of the World. According to our estimates, currently, North America captures the majority share of the market. This can be attributed to the growth in the number of smart homes and the rising demand for energy-efficient smart home technologies, along with the presence of numerous tech companies in the region. However, market in Asia is anticipated to experience the highest CAGR during the forecast period
Example Players in Smart Home Market
- ABB
- ADT
- Amazon
- Apple
- ASSA ABLOY
- Control4
- Crestron Electronics
- Emerson Electric
- Ecobee
- General Electric
- Honeywell
- Johnson Controls
- LG
- Lutron
- Legrand
- Robert Bosch
- Samsung Electronics
- Schneider Electric
- Siemens
- SimpliSafe
- Sony
- Wozart Technology
SMART HOME MARKET: RESEARCH COVERAGE
The report on the smart home market features insights on various sections, including:
- Market Sizing and Opportunity Analysis: An in-depth analysis of the smart home market, focusing on key market segments, including [A] type of product, [B] type of protocol, [C] type of application, [D] type of software & service, [E] type of end user, [F] type of sales channel, and [G] geographical regions.
- Competitive Landscape: A comprehensive analysis of the companies engaged in the smart home market, based on several relevant parameters, such as [A] year of establishment, [B] company size, [C] location of headquarters, [D] ownership structure.
- Company Profiles: Elaborate profiles of prominent players engaged in the smart home market, providing details on [A] location of headquarters, [B]company size, [C] company mission, [D] company footprint, [E] management team, [F] contact details, [G] financial information, [H] operating business segments, [I] smart home portfolio, [J] moat analysis, [K] recent developments, and an informed future outlook.
- SWOT Analysis: An insightful SWOT framework, highlighting the strengths, weaknesses, opportunities and threats in the domain. Additionally, it provides Harvey ball analysis, highlighting the relative impact of each SWOT parameter.
KEY QUESTIONS ANSWERED IN THIS REPORT
- How many companies are currently engaged in smart home market?
- Which are the leading companies in this market?
- What factors are likely to influence the evolution of this market?
- What is the current and future market size?
- What is the CAGR of this market?
- How is the current and future market opportunity likely to be distributed across key market segments?
REASONS TO BUY THIS REPORT
- The report provides a comprehensive market analysis, offering detailed revenue projections of the overall market and its specific sub-segments. This information is valuable to both established market leaders and emerging entrants.
- Stakeholders can leverage the report to gain a deeper understanding of the competitive dynamics within the market. By analyzing the competitive landscape, businesses can make informed decisions to optimize their market positioning and develop effective go-to-market strategies.
- The report offers stakeholders a comprehensive overview of the market, including key drivers, barriers, opportunities, and challenges. This information empowers stakeholders to stay abreast of market trends and make data-driven decisions to capitalize on growth prospects.
ADDITIONAL BENEFITS
- Complimentary Excel Data Packs for all Analytical Modules in the Report
- 10% Free Content Customization
- Detailed Report Walkthrough Session with Research Team
- Free Updated report if the report is 6-12 months old or older
TABLE OF CONTENTS
1. PREFACE
- 1.1. Introduction
- 1.2. Market Share Insights
- 1.3. Key Market Insights
- 1.4. Report Coverage
- 1.5. Key Questions Answered
- 1.6. Chapter Outlines
2. RESEARCH METHODOLOGY
- 2.1. Chapter Overview
- 2.2. Research Assumptions
- 2.3. Database Building
- 2.3.1. Data Collection
- 2.3.2. Data Validation
- 2.3.3. Data Analysis
- 2.4. Project Methodology
- 2.4.1. Secondary Research
- 2.4.1.1. Annual Reports
- 2.4.1.2. Academic Research Papers
- 2.4.1.3. Company Websites
- 2.4.1.4. Investor Presentations
- 2.4.1.5. Regulatory Filings
- 2.4.1.6. White Papers
- 2.4.1.7. Industry Publications
- 2.4.1.8. Conferences and Seminars
- 2.4.1.9. Government Portals
- 2.4.1.10. Media and Press Releases
- 2.4.1.11. Newsletters
- 2.4.1.12. Industry Databases
- 2.4.1.13. Roots Proprietary Databases
- 2.4.1.14. Paid Databases and Sources
- 2.4.1.15. Social Media Portals
- 2.4.1.16. Other Secondary Sources
- 2.4.2. Primary Research
- 2.4.2.1. Introduction
- 2.4.2.2. Types
- 2.4.2.2.1. Qualitative
- 2.4.2.2.2. Quantitative
- 2.4.2.3. Advantages
- 2.4.2.4. Techniques
- 2.4.2.4.1. Interviews
- 2.4.2.4.2. Surveys
- 2.4.2.4.3. Focus Groups
- 2.4.2.4.4. Observational Research
- 2.4.2.4.5. Social Media Interactions
- 2.4.2.5. Stakeholders
- 2.4.2.5.1. Company Executives (CXOs)
- 2.4.2.5.2. Board of Directors
- 2.4.2.5.3. Company Presidents and Vice Presidents
- 2.4.2.5.4. Key Opinion Leaders
- 2.4.2.5.5. Research and Development Heads
- 2.4.2.5.6. Technical Experts
- 2.4.2.5.7. Subject Matter Experts
- 2.4.2.5.8. Scientists
- 2.4.2.5.9. Doctors and Other Healthcare Providers
- 2.4.2.6. Ethics and Integrity
- 2.4.2.6.1. Research Ethics
- 2.4.2.6.2. Data Integrity
- 2.4.3. Analytical Tools and Databases
- 2.4.1. Secondary Research
3. ECONOMIC AND OTHER PROJECT SPECIFIC CONSIDERATIONS
- 3.1. Forecast Methodology
- 3.1.1. Top-Down Approach
- 3.1.2. Bottom-Up Approach
- 3.1.3. Hybrid Approach
- 3.2. Market Assessment Framework
- 3.2.1. Total Addressable Market (TAM)
- 3.2.2. Serviceable Addressable Market (SAM)
- 3.2.3. Serviceable Obtainable Market (SOM)
- 3.2.4. Currently Acquired Market (CAM)
- 3.3. Forecasting Tools and Techniques
- 3.3.1. Qualitative Forecasting
- 3.3.2. Correlation
- 3.2.3. Regression
- 3.3.4. Time Series Analysis
- 3.3.5. Extrapolation
- 3.3.6. Convergence
- 3.3.7. Forecast Error Analysis
- 3.3.8. Data Visualization
- 3.3.9. Scenario Planning
- 3.3.10. Sensitivity Analysis
- 3.4. Key Considerations
- 3.4.1. Demographics
- 3.4.2. Market Access
- 3.4.3. Reimbursement Scenarios
- 3.4.4. Industry Consolidation
- 3.5. Robust Quality Control
- 3.6. Key Market Segmentations
- 3.7 Limitations
4. MACRO-ECONOMIC INDICATORS
- 4.1. Chapter Overview
- 4.2. Market Dynamics
- 4.2.1. Time Period
- 4.2.1.1. Historical Trends
- 4.2.1.2. Current and Forecasted Estimates
- 4.2.2. Currency Coverage
- 4.2.2.1. Overview of Major Currencies Affecting the Market
- 4.2.2.2. Impact of Currency Fluctuations on the Industry
- 4.2.3. Foreign Exchange Impact
- 4.2.3.1. Evaluation of Foreign Exchange Rates and Their Impact on Market
- 4.2.3.2. Strategies for Mitigating Foreign Exchange Risk
- 4.2.4. Recession
- 4.2.4.1. Historical Analysis of Past Recessions and Lessons Learnt
- 4.2.4.2. Assessment of Current Economic Conditions and Potential Impact on the Market
- 4.2.5. Inflation
- 4.2.5.1. Measurement and Analysis of Inflationary Pressures in the Economy
- 4.2.5.2. Potential Impact of Inflation on the Market Evolution
- 4.2.6. Interest Rates
- 4.2.6.1. Overview of Interest Rates and Their Impact on the Market
- 4.2.6.2. Strategies for Managing Interest Rate Risk
- 4.2.7. Commodity Flow Analysis
- 4.2.7.1. Type of Commodity
- 4.2.7.2. Origins and Destinations
- 4.2.7.3. Values and Weights
- 4.2.7.4. Modes of Transportation
- 4.2.8. Global Trade Dynamics
- 4.2.8.1. Import Scenario
- 4.2.8.2. Export Scenario
- 4.2.9. War Impact Analysis
- 4.2.9.1. Russian-Ukraine War
- 4.2.9.2. Israel-Hamas War
- 4.2.10. COVID Impact / Related Factors
- 4.2.10.1. Global Economic Impact
- 4.2.10.2. Industry-specific Impact
- 4.2.10.3. Government Response and Stimulus Measures
- 4.2.10.4. Future Outlook and Adaptation Strategies
- 4.2.11. Other Indicators
- 4.2.11.1. Fiscal Policy
- 4.2.11.2. Consumer Spending
- 4.2.11.3. Gross Domestic Product (GDP)
- 4.2.11.4. Employment
- 4.2.11.5. Taxes
- 4.2.11.6. R&D Innovation
- 4.2.11.7. Stock Market Performance
- 4.2.11.8. Supply Chain
- 4.2.11.9. Cross-Border Dynamics
- 4.2.1. Time Period
5. EXECUTIVE SUMMARY
6. INTRODUCTION
- 6.1. Chapter Overview
- 6.2. Overview of Smart Home
- 6.2.1. Type of Smart Home
- 6.2.2. Type of Protocol
- 6.2.3. Type of Application
- 6.3. Future Perspective
7. COMPETITIVE LANDSCAPE
- 7.1. Chapter Overview
- 7.2. Food Safety Testing: Overall Market Landscape
- 7.2.1. Analysis by Year of Establishment
- 7.2.2. Analysis by Company Size
- 7.2.3. Analysis by Location of Headquarters
- 7.2.4. Analysis by Ownership Structure
8. COMPANY PROFILES
- 8.1. Chapter Overview
- 8.2.1. ABB*
- 8.2.1.1. Company Overview
- 8.2.1.2. Company Mission
- 8.2.1.3. Company Footprint
- 8.2.1.4. Management Team
- 8.2.1.5. Contact Details
- 8.2.1.6. Financial Performance
- 8.2.1.7. Operating Business Segments
- 8.2.1.8. Service / Product Portfolio (project specific)
- 8.2.1.9. MOAT Analysis
- 8.2.1.10. Recent Developments and Future Outlook
- 8.2.2. ADT
- 8.2.3. Amazon
- 8.2.4. Apple
- 8.2.5. Crestron Electronics
- 8.2.6. Google
- 8.2.7. Honeywell
- 8.2.8. Robert Bosch
- 8.2.9. Samsung Electronics
- 8.2.10. Schneider Electric
- 8.2.11. Siemens
- 8.2.12. Sony
- 8.2.1. ABB*
9. VALUE CHAIN ANALYSIS
10. SWOT ANALYSIS
11. GLOBAL SMART HOME MARKET
- 11.1. Chapter Overview
- 11.2. Key Assumptions and Methodology
- 11.3. Trends Disruption Impacting Market
- 11.4. Global Smart Home Market, Historical Trends (Since 2019) and Forecasted Estimates (Till 2035)
- 11.5. Multivariate Scenario Analysis
- 11.5.1. Conservative Scenario
- 11.5.2. Optimistic Scenario
- 11.6. Key Market Segmentations
12. MARKET OPPORTUNITIES BASED ON TYPE OF PRODUCT
- 12.1. Chapter Overview
- 12.2. Key Assumptions and Methodology
- 12.3. Revenue Shift Analysis
- 12.4. Market Movement Analysis
- 12.5. Penetration-Growth (P-G) Matrix
- 12.6. Smart Home Market for Entertainment Devices: Historical Trends (Since 2019) and Forecasted Estimates (Till 2035)
- 12.6.1. Smart Home Market for Smart Display / TV: Historical Trends (Since 2019) and Forecasted Estimates (Till 2035)
- 12.6.2. Smart Home Market for Sound Bars & Speakers: Historical Trends (Since 2019) and Forecasted Estimates (Till 2035)
- 12.6.3. Smart Home Market for Streaming Devices: Historical Trends (Since 2019) and Forecasted Estimates (Till 2035)
- 12.7. Smart Home Market for Home Appliances: Historical Trends (Since 2019) and Forecasted Estimates (Till 2035)
- 12.7.1. Smart Home Market for Smart Vacuum Cleaners: Historical Trends (Since 2019) and Forecasted Estimates (Till 2035)
- 12.7.2. Smart Home Market for Smart Washing Machines: Historical Trends (Since 2019) and Forecasted Estimates (Till 2035)
- 12.7.3. Smart Home Market for Smart Water Heater: Historical Trends (Since 2019) and Forecasted Estimates (Till 2035)
- 12.8. Smart Home Market for Home Healthcare: Historical Trends (Since 2019) and Forecasted Estimates (Till 2035)
- 12.9. Smart Home Market for HVAC: Historical Trends (Since 2019) and Forecasted Estimates (Till 2035)
- 12.9.1. Smart Home Market for Sensors: Historical Trends (Since 2019) and Forecasted Estimates (Till 2035)
- 12.9.2. Smart Home Market for Smart Thermostats: Historical Trends (Since 2019) and Forecasted Estimates (Till 2035)
- 12.9.3 Smart Home Market for Smart Vents: Historical Trends (Since 2019) and Forecasted Estimates (Till 2035)
- 12.9.4. Smart Home Market for Others: Historical Trends (Since 2019) and Forecasted Estimates (Till 2035)
- 12.10. Smart Home Market for Lighting Control: Historical Trends (Since 2019) and Forecasted Estimates (Till 2035)
- 12.10.1. Smart Home Market for Dimmers: Historical Trends (Since 2019) and Forecasted Estimates (Till 2035)
- 12.10.2. Smart Home Market for Lighting Occupancy Sensors: Historical Trends (Since 2019) and Forecasted Estimates (Till 2035)
- 12.10.3. Smart Home Market for Relays & Switches: Historical Trends (Since 2019) and Forecasted Estimates (Till 2035)
- 12.10.4. Smart Home Market for Smart Lights: Historical Trends (Since 2019) and Forecasted Estimates (Till 2035)
- 12.10.5. Smart Home Market for Other Products: Historical Trends (Since 2019) and Forecasted Estimates (Till 2035)
- 12.11. Smart Home Market for Security & Access Controls: Historical Trends (Since 2019) and Forecasted Estimates (Till 2035)
- 12.11.1. Smart Home Market for Remote Monitoring Software & Services: Historical Trends (Since 2019) and Forecasted Estimates (Till 2035)
- 12.11.2. Smart Home Market for Security Cameras: Historical Trends (Since 2019) and Forecasted Estimates (Till 2035)
- 12.11.3. Smart Home Market for Smart Locks: Historical Trends (Since 2019) and Forecasted Estimates (Till 2035)
- 12.11.4. Smart Home Market for Video Door Phones: Historical Trends (Since 2019) and Forecasted Estimates (Till 2035)
- 12.11.5. Smart Home Market for Others: Historical Trends (Since 2019) and Forecasted Estimates (Till 2035)
- 12.12. Smart Home Market for Smart Furniture: Historical Trends (Since 2019) and Forecasted Estimates (Till 2035)
- 12.13. Smart Home Market for Smart Kitchen Appliances: Historical Trends (Since 2019) and Forecasted Estimates (Till 2035)
- 12.13.1. Smart Home Market for Cooktops: Historical Trends (Since 2019) and Forecasted Estimates (Till 2035)
- 12.13.2. Smart Home Market for Dishwasher: Historical Trends (Since 2019) and Forecasted Estimates (Till 2035)
- 12.13.3. Smart Home Market for Microwave/Ovens: Historical Trends (Since 2019) and Forecasted Estimates (Till 2035)
- 12.13.4. Smart Home Market for Refrigerators: Historical Trends (Since 2019) and Forecasted Estimates (Till 2035)
- 12.14. Smart Home Market for Other Devices: Historical Trends (Since 2019) and Forecasted Estimates (Till 2035)
- 12.15. Data Triangulation and Validation
13. MARKET OPPORTUNITIES BASED ON TYPE OF PROTOCOL
- 13.1. Chapter Overview
- 13.2. Key Assumptions and Methodology
- 13.3. Revenue Shift Analysis
- 13.4. Market Movement Analysis
- 13.5. Penetration-Growth (P-G) Matrix
- 13.6 Smart Home Market for Hybrid: Historical Trends (Since 2019) and Forecasted Estimates (Till 2035)
- 13.6.1 Smart Home Market for C-BUS: Historical Trends (Since 2019) and Forecasted Estimates (Till 2035)
- 13.6.2. Smart Home Market for Insteon: Historical Trends (Since 2019) and Forecasted Estimates (Till 2035)
- 13.7. Smart Home Market for Wireless Protocols: Historical Trends (Since 2019) and Forecasted Estimates (Till 2035)
- 13.7.1. Smart Home Market for Bluetooth: Historical Trends (Since 2019) and Forecasted Estimates (Till 2035)
- 13.7.2. Smart Home Market for EnOcean: Historical Trends (Since 2019) and Forecasted Estimates (Till 2035)
- 13.7.3. Smart Home Market for Thread: Historical Trends (Since 2019) and Forecasted Estimates (Till 2035)
- 13.7.4 Smart Home Market for Wi-Fi: Historical Trends (Since 2019) and Forecasted Estimates (Till 2035)
- 13.7.5. Smart Home Market for ZigBee: Historical Trends (Since 2019) and Forecasted Estimates (Till 2035)
- 13.7.6. Smart Home Market for Z Wave: Historical Trends (Since 2019) and Forecasted Estimates (Till 2035)
- 13.7.7. Smart Home Market for Others: Historical Trends (Since 2019) and Forecasted Estimates (Till 2035)
- 13.8. Smart Home Market for Wired Protocols: Historical Trends (Since 2019) and Forecasted Estimates (Till 2035)
- 13.8.1. Smart Home Market for BACnet: Historical Trends (Since 2019) and Forecasted Estimates (Till 2035)
- 13.8.2. Smart Home Market for DALI: Historical Trends (Since 2019) and Forecasted Estimates (Till 2035)
- 13.8.3. Smart Home Market for Others: Historical Trends (Since 2019) and Forecasted Estimates (Till 2035)
- 13.8.4. Smart Home Market for Ethernet: Historical Trends (Since 2019) and Forecasted Estimates (Till 2035)
- 13.8.5. Smart Home Market for KNX: Historical Trends (Since 2019) and Forecasted Estimates (Till 2035)
- 13.8.6. Smart Home Market for LONWoks: Historical Trends (Since 2019) and Forecasted Estimates (Till 2035)
- 13.8.7. Smart Home Market for ModBus: Historical Trends (Since 2019) and Forecasted Estimates (Till 2035)
- 13.8.8. Smart Home Market for UPB: Historical Trends (Since 2019) and Forecasted Estimates (Till 2035)
- 13.8.9. Smart Home Market for X10: Historical Trends (Since 2019) and Forecasted Estimates (Till 2035)
- 13.9. Data Triangulation and Validation
14. MARKET OPPORTUNITIES BASED ON TYPE OF APPLICATION
- 14.1. Chapter Overview
- 14.2. Key Assumptions and Methodology
- 14.3. Revenue Shift Analysis
- 14.4. Market Movement Analysis
- 14.5. Penetration-Growth (P-G) Matrix
- 14.6. Smart Home Market for New Constructions: Historical Trends (Since 2019) and Forecasted Estimates (Till 2035)
- 14.7. Smart Home Market for Retrofit: Historical Trends (Since 2019) and Forecasted Estimates (Till 2035)
- 14.8. Data Triangulation and Validation
15. MARKET OPPORTUNITIES BASED ON TYPE OF SOFTWARE & SERVICES
- 15.1. Chapter Overview
- 15.2. Key Assumptions and Methodology
- 15.3. Revenue Shift Analysis
- 15.4. Market Movement Analysis
- 15.5. Penetration-Growth (P-G) Matrix
- 15.6. Smart Home Market for Behavioral: Historical Trends (Since 2019) and Forecasted Estimates (Till 2035)
- 15.7. Smart Home Market for Proactive: Historical Trends (Since 2019) and Forecasted Estimates (Till 2035)
- 15.8. Data Triangulation and Validation
16. MARKET OPPORTUNITIES BASED ON END-USER
- 16.1. Chapter Overview
- 16.2. Key Assumptions and Methodology
- 16.3. Revenue Shift Analysis
- 16.4. Market Movement Analysis
- 16.5. Penetration-Growth (P-G) Matrix
- 16.6. Smart Home Market for Residential End User: Historical Trends (Since 2019) and Forecasted Estimates (Till 2035)
- 16.6.1. Smart Home Market for Assisted Homes: Historical Trends (Since 2019) and Forecasted Estimates (Till 2035)
- 16.6.2. Smart Home Market for Low Energy Homes: Historical Trends (Since 2019) and Forecasted Estimates (Till 2035)
- 16.7. Smart Home Market for Mid-Range Apartments / Homes: Historical Trends (Since 2019) and Forecasted Estimates (Till 2035)
- 16.7. Smart Home Market for Commercial End-user: Historical Trends (Since 2019) and Forecasted Estimates (Till 2035)
- 16.7.1 Smart Home Market for Smart Hospitals: Historical Trends (Since 2019) and Forecasted Estimates (Till 2035)
- 16.7.2. Smart Home Market for Smart Hotels: Historical Trends (Since 2019) and Forecasted Estimates (Till 2035)
- 16.7.3 Smart Home Market for Other Commercial Buildings: Historical Trends (Since 2019) and Forecasted Estimates (Till 2035)
- 16.8. Data Triangulation and Validation
17. MARKET OPPORTUNITIES BASED ON TYPE OF SALES CHANNEL
- 17.1. Chapter Overview
- 17.2. Key Assumptions and Methodology
- 17.3. Revenue Shift Analysis
- 17.4. Market Movement Analysis
- 17.5. Penetration-Growth (P-G) Matrix
- 17.6. Smart Home Market for Direct: Historical Trends (Since 2019) and Forecasted Estimates (Till 2035)
- 17.7. Smart Home Market for Indirect: Historical Trends (Since 2019) and Forecasted Estimates (Till 2035)
- 17.8. Data Triangulation and Validation
18. MARKET OPPORTUNITIES FOR SMART HOMES IN NORTH AMERICA
- 18.1. Chapter Overview
- 18.2. Key Assumptions and Methodology
- 18.3. Revenue Shift Analysis
- 18.4. Market Movement Analysis
- 18.5. Penetration-Growth (P-G) Matrix
- 18.6. Smart Home Market in North America: Historical Trends (Since 2019) and Forecasted Estimates (Till 2035)
- 18.6.1. Smart Home Market in the US: Historical Trends (Since 2019) and Forecasted Estimates (Till 2035)
- 18.6.2. Smart Home Market in Canada: Historical Trends (Since 2019) and Forecasted Estimates (Till 2035)
- 18.6.3. Smart Home Market in Mexico: Historical Trends (Since 2019) and Forecasted Estimates (Till 2035)
- 18.6.4. Smart Home Market in Other North American Countries: Historical Trends (Since 2019) and Forecasted Estimates (Till 2035)
- 18.7. Data Triangulation and Validation
19. MARKET OPPORTUNITIES FOR SMART HOME IN EUROPE
- 19.1. Chapter Overview
- 19.2. Key Assumptions and Methodology
- 19.3. Revenue Shift Analysis
- 19.4. Market Movement Analysis
- 19.5. Penetration-Growth (P-G) Matrix
- 19.6. Smart Home Market in Europe: Historical Trends (Since 2019) and Forecasted Estimates (Till 2035)
- 19.6.1. Smart Home Market in Austria: Historical Trends (Since 2019) and Forecasted Estimates (Till 2035)
- 19.6.2. Smart Home Market in Belgium: Historical Trends (Since 2019) and Forecasted Estimates (Till 2035)
- 19.6.3. Smart Home Market in Denmark: Historical Trends (Since 2019) and Forecasted Estimates (Till 2035)
- 19.6.4. Smart Home Market in France: Historical Trends (Since 2019) and Forecasted Estimates (Till 2035)
- 19.6.5. Smart Home Market in Germany: Historical Trends (Since 2019) and Forecasted Estimates (Till 2035)
- 19.6.6. Smart Home Market in Ireland: Historical Trends (Since 2019) and Forecasted Estimates (Till 2035)
- 19.6.7. Smart Home Market in Italy: Historical Trends (Since 2019) and Forecasted Estimates (Till 2035)
- 19.6.8. Smart Home Market in Netherlands: Historical Trends (Since 2019) and Forecasted Estimates (Till 2035)
- 19.6.9. Smart Home Market in Norway: Historical Trends (Since 2019) and Forecasted Estimates (Till 2035)
- 19.6.10. Smart Home Market in Russia: Historical Trends (Since 2019) and Forecasted Estimates (Till 2035)
- 19.6.11. Smart Home Market in Spain: Historical Trends (Since 2019) and Forecasted Estimates (Till 2035)
- 19.6.12. Smart Home Market in Sweden: Historical Trends (Since 2019) and Forecasted Estimates (Till 2035)
- 19.6.13. Smart Home Market in Sweden: Historical Trends (Since 2019) and Forecasted Estimates (Till 2035)
- 19.6.14. Smart Home Market in Switzerland: Historical Trends (Since 2019) and Forecasted Estimates (Till 2035)
- 19.6.15. Smart Home Market in the UK: Historical Trends (Since 2019) and Forecasted Estimates (Till 2035)
- 19.6.16. Smart Home Market in Other European Countries: Historical Trends (Since 2019) and Forecasted Estimates (Till 2035)
- 19.7. Data Triangulation and Validation
20. MARKET OPPORTUNITIES FOR SMART HOME IN ASIA
- 20.1. Chapter Overview
- 20.2. Key Assumptions and Methodology
- 20.3. Revenue Shift Analysis
- 20.4. Market Movement Analysis
- 20.5. Penetration-Growth (P-G) Matrix
- 20.6. Smart Home Market in Asia: Historical Trends (Since 2019) and Forecasted Estimates (Till 2035)
- 20.6.1. Smart Home Market in China: Historical Trends (Since 2019) and Forecasted Estimates (Till 2035)
- 20.6.2. Smart Home Market in India: Historical Trends (Since 2019) and Forecasted Estimates (Till 2035)
- 20.6.3. Smart Home Market in Japan: Historical Trends (Since 2019) and Forecasted Estimates (Till 2035)
- 20.6.4. Smart Home Market in Singapore: Historical Trends (Since 2019) and Forecasted Estimates (Till 2035)
- 20.6.5. Smart Home Market in South Korea: Historical Trends (Since 2019) and Forecasted Estimates (Till 2035)
- 20.6.6. Smart Home Market in Other Asian Countries: Historical Trends (Since 2019) and Forecasted Estimates (Till 2035)
- 20.7. Data Triangulation and Validation
21. MARKET OPPORTUNITIES FOR SMART HOME IN MIDDLE EAST AND NORTH AFRICA (MENA)
- 21.1. Chapter Overview
- 21.2. Key Assumptions and Methodology
- 21.3. Revenue Shift Analysis
- 21.4. Market Movement Analysis
- 21.5. Penetration-Growth (P-G) Matrix
- 21.6. Smart Home Market in Middle East and North Africa (MENA): Historical Trends (Since 2019) and Forecasted Estimates (Till 2035)
- 21.6.1. Smart Home Market in Egypt: Historical Trends (Since 2019) and Forecasted Estimates (Till 205)
- 21.6.2. Smart Home Market in Iran: Historical Trends (Since 2019) and Forecasted Estimates (Till 2035)
- 21.6.3. Smart Home Market in Iraq: Historical Trends (Since 2019) and Forecasted Estimates (Till 2035)
- 21.6.4. Smart Home Market in Israel: Historical Trends (Since 2019) and Forecasted Estimates (Till 2035)
- 21.6.5. Smart Home Market in Kuwait: Historical Trends (Since 2019) and Forecasted Estimates (Till 2035)
- 21.6.6. Smart Home Market in Saudi Arabia: Historical Trends (Since 2019) and Forecasted Estimates (Till 2035)
- 21.6.7. Smart Home Market in United Arab Emirates (UAE): Historical Trends (Since 2019) and Forecasted Estimates (Till 2035)
- 21.6.8. Smart Home Market in Other MENA Countries: Historical Trends (Since 2019) and Forecasted Estimates (Till 2035)
- 21.7. Data Triangulation and Validation
22. MARKET OPPORTUNITIES FOR SMART HOME IN LATIN AMERICA
- 22.2. Chapter Overview
- 22.2. Key Assumptions and Methodology
- 22.3. Revenue Shift Analysis
- 22.4. Market Movement Analysis
- 22.5. Penetration-Growth (P-G) Matrix
- 22.6. Smart Home Market in Latin America: Historical Trends (Since 2019) and Forecasted Estimates (Till 2035)
- 22.6.1. Smart Home Market in Argentina: Historical Trends (Since 2019) and Forecasted Estimates (Till 2035)
- 22.6.2. Smart Home Market in Brazil: Historical Trends (Since 2019) and Forecasted Estimates (Till 2035)
- 22.6.3. Smart Home Market in Chile: Historical Trends (Since 2019) and Forecasted Estimates (Till 2035)
- 22.6.4. Smart Home Market in Colombia Historical Trends (Since 2019) and Forecasted Estimates (Till 2035)
- 22.6.5. Smart Home Market in Venezuela: Historical Trends (Since 2019) and Forecasted Estimates (Till 2035)
- 22.6.6. Smart Home Market in Other Latin American Countries: Historical Trends (Since 2019) and Forecasted Estimates (Till 2035)
- 22.7. Data Triangulation and Validation
23. MARKET OPPORTUNITIES FOR SMART HOME IN REST OF THE WORLD
- 23.1. Chapter Overview
- 23.2. Key Assumptions and Methodology
- 23.3. Revenue Shift Analysis
- 23.4. Market Movement Analysis
- 23.5. Penetration-Growth (P-G) Matrix
- 23.6. Smart Home Market in Rest of the World: Historical Trends (Since 2019) and Forecasted Estimates (Till 2035)
- 23.6.1. Smart Home Market in Australia: Historical Trends (Since 2019) and Forecasted Estimates (Till 2035)
- 23.6.2. Smart Home Market in New Zealand: Historical Trends (Since 2019) and Forecasted Estimates (Till 2035)
- 23.6.3. Smart Home Market in Other Countries
- 23.7. Data Triangulation and Validation