


|
시장보고서
상품코드
1787840
분산형 금융 시장 : 산업 동향 및 예측(-2035년) : 컴포넌트 유형, 용도, 산업, 기업 유형 및 지역별Decentralized Finance Market, Till 2035: Distribution by Type of Component, Type of Application, Type of Industry Served, Type of Enterprise, and Geographical Regions: Industry Trends and Global Forecasts |
||||||
분산형 금융 시장 : 개요
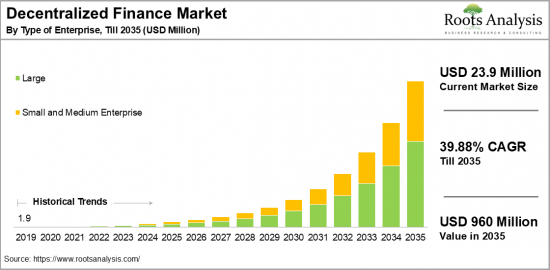
세계의 분산형 금융 시장 규모는 현재 2,392만 달러에서 예측 기간 동안 39.88%의 연평균 성장률(CAGR)로 성장을 지속하여 2035년에는 9억 6,000만 달러로 성장할 것으로 예측되고 있습니다.
분산형 금융시장 기회 : 분류
컴포넌트 유형
- 블록체인 기술
- 분산형 용도
- 스마트 계약
용도
- 자산 관리
- 컴플라이언스와 정체성
- 데이터 분석
- 게임
- 페이먼트
산업
- BFSI
- 자동차
- 미디어 및 엔터테인먼트
- 소매 및 전자상거래
- 기타
기업 유형
- 대기업
- 중소기업
지역
- 북미
- 미국
- 캐나다
- 멕시코
- 기타 북미 국가
- 유럽
- 오스트리아
- 벨기에
- 덴마크
- 프랑스
- 독일
- 아일랜드
- 이탈리아
- 네덜란드
- 노르웨이
- 러시아
- 스페인
- 스웨덴
- 스위스
- 영국
- 기타 유럽 국가
- 아시아
- 중국
- 인도
- 일본
- 싱가포르
- 한국
- 기타 아시아 국가
- 라틴아메리카
- 브라질
- 칠레
- 콜롬비아
- 베네수엘라
- 기타 라틴아메리카 국가
- 중동 및 북아프리카
- 이집트
- 이란
- 이라크
- 이스라엘
- 쿠웨이트
- 사우디아라비아
- 아랍에미리트(UAE)
- 기타 중동 및 북아프리카 국가
- 세계 기타 지역
- 호주
- 뉴질랜드
- 기타 국가
분산형 금융시장 : 성장과 동향
현재 전 세계적으로 약 17억 명의 사람들이 금융 서비스를 이용할 수 없는 상태이며, 이 중 11억 명은 휴대폰을 보유하고 있습니다. 이는 금융과 블록체인 기술의 혁신적인 결합을 강조합니다. 분산형 금융은 접근성을 향상시켜 금융 부문에 혁명을 일으킬 것으로 예상된다는 점을 주목해야 합니다. 분산형 금융의 주요 이점으로는 중개자 제거를 통한 거래 비용 절감, 사용자의 자산에 대한 완전한 통제권 부여, 금융 서비스에 대한 24시간 연중무휴 접근 등이 있습니다. 또한, 분산형 금융은 투자 은행, 보험, 부동산, 공급망 관리 등 다양한 부문의 중요한 과제에 대해 더 깊은 인사이트와 더 효과적인 솔루션을 제공함으로써 운영을 개선했습니다.
분산형 금융 시장은 금융 서비스에 대한 접근을 민주화하기 위한 혁신과 디지털 전환을 향한 전 세계적 움직임에서 필수적인 요소가 되고 있습니다. 자연어 처리 및 블록체인 기술은 분산형 금융의 잠재력을 최대한 실현하는 데 매우 중요합니다. DeFi는 시스템 내에서 P2P 결제를 촉진하여 사용자가 은행과 같은 기존의 금융 주체에 의존하지 않고도 대출, 차입, 거래 및 이자 수익을 얻을 수 있도록 합니다. 또한, 분산형 자율 조직(DAO)과 같은 혁신은 다양한 DeFi 플랫폼 내에서 거버넌스 모델을 변화시키고 있으며, 커뮤니티에 의해 촉진되는 의사 결정을 장려하고 있습니다. 그 결과, 지속적인 기술 발전과 투자자 증가에 따라 분산형 금융 시장은 예측 기간 동안 상당한 성장을 보일 것으로 예상됩니다.
본 보고서에서는 세계의 분산형 금융 시장을 조사했으며, 시장 개요, 배경, 시장영향인자 분석, 시장 규모 추이와 예측, 각종 구분, 지역별 상세 분석, 경쟁 구도, 주요기업 프로파일 등을 정리했습니다.
목차
섹션 I : 보고서 개요
제1장 서문
제2장 조사 방법
제3장 시장 역학
제4장 거시경제지표
섹션 II : 정성적 인사이트
제5장 주요 요약
제6장 소개
제7장 규제 시나리오
섹션 III : 시장 개요
제8장 주요 기업의 종합적 데이터베이스
제9장 경쟁 구도
제10장 화이트 스페이스 분석
제11장 기업의 경쟁력 분석
제12장 분산형 금융시장의 스타트업 에코시스템
섹션 IV : 기업 프로파일
제13장 기업 프로파일
- 개요
- Aave
- Accenture
- Badger DAO
- Balancer
- Compound Labs
- Curve Finance
- Deloitte
- Hashflow
- IBM
- MakerDAO
- MetaMask
- RisingMax
- Suffescom Solutions
- SushiSwap
- Synthetix
- Uniswap
섹션 V : 시장 동향
제14장 메가트렌드 분석
제15장 미충족 요구 분석
제16장 특허 분석
제17장 최근 동향
섹션 VI : 시장 기회 분석
제18장 세계의 분산형 금융시장
제19장 분산형 금융시장의 기회 : 컴포넌트 유형별
제20장 분산형 금융시장의 기회 : 용도별
제21장 분산형 금융시장의 기회 : 산업별
제22장 분산형 금융시장의 기회 : 기업 유형별
제23장 분산형 금융 시장 기회 : 북미
제24장 분산형 금융 시장 기회 : 유럽
제25장 분산형 금융 시장 기회 : 아시아
제26장 분산형 금융 시장 기회 : 중동 및 북아프리카
제27장 분산형 금융 시장 기회 : 라틴아메리카
제28장 분산형 금융 시장 기회 : 세계 기타 지역
제29장 시장 집중 분석 : 주요 기업의 분포
제30장 인접 시장 분석
섹션 VII : 전략 도구
제31장 승리의 열쇠가 되는 전략
제32장 Porter's Five Forces 분석
제33장 SWOT 분석
제34장 밸류체인 분석
제35장 ROOTS의 전략 제안
섹션 VIII : 기타 독점적 인사이트
제36장 1차 조사로부터의 인사이트
제37장 보고서의 결론
섹션 IX : 부록
제38장 표 형식 데이터
제39장 기업 및 단체 일람
제40장 맞춤형 서비스 기회
제41장 ROOTS 구독 서비스
제42장 저자 상세 정보
HBR 25.08.20Decentralized Finance Market Overview
As per Roots Analysis, the global decentralized finance market size is estimated to grow from USD 23.92 million in the current year to USD 960 million by 2035, at a CAGR of 39.88% during the forecast period, till 2035.

The opportunity for decentralized finance market has been distributed across the following segments:
Type of Component
- Blockchain Technology
- Decentralized Applications
- Smart Contracts
Type of Application
- Asset Management
- Compliance and Identity
- Data Analytics
- Gaming
- Payments
Type of Industry Served
- BFSI
- Automotive
- Media & Entertainment
- Retail & E-commerce
- Others
Type of Enterprise
- Large
- Small and Medium Enterprise
Geographical Regions
- North America
- US
- Canada
- Mexico
- Other North American countries
- Europe
- Austria
- Belgium
- Denmark
- France
- Germany
- Ireland
- Italy
- Netherlands
- Norway
- Russia
- Spain
- Sweden
- Switzerland
- UK
- Other European countries
- Asia
- China
- India
- Japan
- Singapore
- South Korea
- Other Asian countries
- Latin America
- Brazil
- Chile
- Colombia
- Venezuela
- Other Latin American countries
- Middle East and North Africa
- Egypt
- Iran
- Iraq
- Israel
- Kuwait
- Saudi Arabia
- UAE
- Other MENA countries
- Rest of the World
- Australia
- New Zealand
- Other countries
DECENTRALIZED FINANCE MARKET: GROWTH AND TRENDS
At present, approximately 1.7 billion individuals around the globe lack access to financial services, with 1.1 billion of these individuals having mobile phone access. This highlights the transformative combination of finance and blockchain technology. It's important to note that decentralized finance is set to revolutionize the financial sector by enhancing accessibility. Some key benefits of decentralized finance include reduced transaction costs by removing intermediaries, giving users complete control over their assets, and providing 24/7 access to financial services. Moreover, decentralized finance has improved operations by offering deeper insights and more effective solutions to critical challenges in various sectors such as investment banking, insurance, real estate, and supply chain management.
The decentralized finance market is becoming an essential element in the global movement toward innovation and digital transformation aimed at democratizing access to financial services. Natural language processing and blockchain technology are crucial in realizing the full potential of decentralized finance. DeFi facilitates peer-to-peer payments within its systems, enabling users to lend, borrow, trade, and earn interest without relying on conventional financial entities like banks. Furthermore, innovations such as decentralized autonomous organizations (DAOs) are transforming governance models within various DeFi platforms, encouraging decisions driven by the community. As a result, with ongoing technological progress and an increase in investors, the decentralized finance market is expected to experience significant growth during the forecast period.
DECENTRALIZED FINANCE MARKET: KEY SEGMENTS
Market Share by Type of Component
Based on type of component, the global decentralized finance market is segmented into blockchain technology, decentralized applications and smart contracts in decentralized finance. According to our estimates, currently, the decentralized applications segment captures the majority share of the market.
Additionally, this segment is anticipated to grow at a comparatively higher CAGR during the forecast period. Key factors contributing to this leading position include their practical applications and user engagement across different sectors, especially in finance, gaming, and social media.
Market Share by Type of Application
Based on type of application, the decentralized finance market is segmented into asset management, compliance and identity, data analytics, gaming and payments. According to our estimates, currently, the gaming segment captures the majority of the market. Additionally, this segment is anticipated to grow at a comparatively higher CAGR during the forecast period.
This can be attributed to various factors including the emergence of play-to-earn models, which enable players to generate real-world value through in-game activities and assets like NFTs.
Market Share by Type of Industry Served
Based on type of industry served, the decentralized finance market is segmented into BFSI, automotive, media & entertainment, retail & E-commerce and others. According to our estimates, currently, BFSI market segment captures the majority share of the market. Additionally, this segment is anticipated to grow at a comparatively higher CAGR during the forecast period.
This can be attributed to the essential demand for transparency, efficiency, and accessibility within the sector. DeFi technologies remove intermediaries, which greatly lowers transaction costs and processing times, making it particularly attractive in financial services.
Market Share by Type of Enterprise
Based on type of enterprise, the decentralized finance market is segmented into large and small and medium enterprise. According to our estimates, currently, large enterprise segment captures the majority share of the market. Additionally, this segment is anticipated to grow at a comparatively higher CAGR during the forecast period.
This growth can be attributed to their ability to invest in cutting-edge decentralized finance technologies, leverage considerable resources, enhance economies of scale, and stimulate business expansion.
Market Share by Geographical Regions
Based on geographical regions, the decentralized finance market is segmented into North America, Europe, Asia, Latin America, Middle East and North Africa, and the rest of the world. According to our estimates, currently, North America captures the majority share of the market. However, the market in Asia is expected to grow at a higher CAGR during the forecast period.
This growth can be linked to swift technological developments, governmental initiatives aimed at enhancing financial inclusion, and a significant unbanked population in search of accessible financial services. Moreover, countries such as Singapore, Japan, and South Korea are emerging as prominent centers for blockchain innovation, creating a favorable environment for the adoption of cryptocurrencies in the DeFi space.
Example Players in Decentralized Finance Market
- Aave
- Accenture
- Badger DAO
- Balancer
- Compound Labs
- Curve Finance
- Deloitte
- Hashflow
- IBM
- MakerDAO
- MetaMask
- RisingMax
- Suffescom Solutions
- SushiSwap
- Synthetix
- Uniswap
DECENTRALIZED FINANCE MARKET: RESEARCH COVERAGE
The report on the decentralized finance market features insights on various sections, including:
- Market Sizing and Opportunity Analysis: An in-depth analysis of the decentralized finance market, focusing on key market segments, including [A] type of component, [B] type of application, [C] type of industry served, [D] type of enterprise, and [E] geographical regions
- Competitive Landscape: A comprehensive analysis of the companies engaged in the decentralized finance market, based on several relevant parameters, such as [A] year of establishment, [B] company size, [C] location of headquarters and [D] ownership structure.
- Company Profiles: Elaborate profiles of prominent players engaged in the Decentralized finance market, providing details on [A] location of headquarters, [B] company size, [C] company mission, [D] company footprint, [E] management team, [F] contact details, [G] financial information, [H] operating business segments, [I] decentralized finance portfolio, [J] moat analysis, [K] recent developments, and an informed future outlook.
- Megatrends: An evaluation of ongoing megatrends in Decentralized finance industry.
- Patent Analysis: An insightful analysis of patents filed / granted in the decentralized finance domain, based on relevant parameters, including [A] type of patent, [B] patent publication year, [C] patent age and [D] leading players.
- Recent Developments: An overview of the recent developments made in the decentralized finance market, along with analysis based on relevant parameters, including [A] year of initiative, [B] type of initiative, [C] geographical distribution and [D] most active players.
- Porter's Five Forces Analysis: An analysis of five competitive forces prevailing in the decentralized finance market, including threats of new entrants, bargaining power of buyers, bargaining power of suppliers, threats of substitute products and rivalry among existing competitors.
- SWOT Analysis: An insightful SWOT framework, highlighting the strengths, weaknesses, opportunities and threats in the domain. Additionally, it provides Harvey ball analysis, highlighting the relative impact of each SWOT parameter.
- Value Chain Analysis: A comprehensive analysis of the value chain, providing information on the different phases and stakeholders involved in the decentralized finance market.
KEY QUESTIONS ANSWERED IN THIS REPORT
- How many companies are currently engaged in decentralized finance market?
- Which are the leading companies in this market?
- What factors are likely to influence the evolution of this market?
- What is the current and future market size?
- What is the CAGR of this market?
- How is the current and future market opportunity likely to be distributed across key market segments?
REASONS TO BUY THIS REPORT
- The report provides a comprehensive market analysis, offering detailed revenue projections of the overall market and its specific sub-segments. This information is valuable to both established market leaders and emerging entrants.
- Stakeholders can leverage the report to gain a deeper understanding of the competitive dynamics within the market. By analyzing the competitive landscape, businesses can make informed decisions to optimize their market positioning and develop effective go-to-market strategies.
- The report offers stakeholders a comprehensive overview of the market, including key drivers, barriers, opportunities, and challenges. This information empowers stakeholders to stay abreast of market trends and make data-driven decisions to capitalize on growth prospects.
ADDITIONAL BENEFITS
- Complimentary Excel Data Packs for all Analytical Modules in the Report
- 15% Free Content Customization
- Detailed Report Walkthrough Session with Research Team
- Free Updated report if the report is 6-12 months old or older
TABLE OF CONTENTS
SECTION I: REPORT OVERVIEW
1. PREFACE
- 1.1. Introduction
- 1.2. Market Share Insights
- 1.3. Key Market Insights
- 1.4. Report Coverage
- 1.5. Key Questions Answered
- 1.6. Chapter Outlines
2. RESEARCH METHODOLOGY
- 2.1. Chapter Overview
- 2.2. Research Assumptions
- 2.3. Database Building
- 2.3.1. Data Collection
- 2.3.2. Data Validation
- 2.3.3. Data Analysis
- 2.4. Project Methodology
- 2.4.1. Secondary Research
- 2.4.1.1. Annual Reports
- 2.4.1.2. Academic Research Papers
- 2.4.1.3. Company Websites
- 2.4.1.4. Investor Presentations
- 2.4.1.5. Regulatory Filings
- 2.4.1.6. White Papers
- 2.4.1.7. Industry Publications
- 2.4.1.8. Conferences and Seminars
- 2.4.1.9. Government Portals
- 2.4.1.10. Media and Press Releases
- 2.4.1.11. Newsletters
- 2.4.1.12. Industry Databases
- 2.4.1.13. Roots Proprietary Databases
- 2.4.1.14. Paid Databases and Sources
- 2.4.1.15. Social Media Portals
- 2.4.1.16. Other Secondary Sources
- 2.4.2. Primary Research
- 2.4.2.1. Introduction
- 2.4.2.2. Types
- 2.4.2.2.1. Qualitative
- 2.4.2.2.2. Quantitative
- 2.4.2.3. Advantages
- 2.4.2.4. Techniques
- 2.4.2.4.1. Interviews
- 2.4.2.4.2. Surveys
- 2.4.2.4.3. Focus Groups
- 2.4.2.4.4. Observational Research
- 2.4.2.4.5. Social Media Interactions
- 2.4.2.5. Stakeholders
- 2.4.2.5.1. Company Executives (CXOs)
- 2.4.2.5.2. Board of Directors
- 2.4.2.5.3. Company Presidents and Vice Presidents
- 2.4.2.5.4. Key Opinion Leaders
- 2.4.2.5.5. Research and Development Heads
- 2.4.2.5.6. Technical Experts
- 2.4.2.5.7. Subject Matter Experts
- 2.4.2.5.8. Scientists
- 2.4.2.5.9. Doctors and Other Healthcare Providers
- 2.4.2.6. Ethics and Integrity
- 2.4.2.6.1. Research Ethics
- 2.4.2.6.2. Data Integrity
- 2.4.3. Analytical Tools and Databases
- 2.4.1. Secondary Research
3. MARKET DYNAMICS
- 3.1. Forecast Methodology
- 3.1.1. Top-Down Approach
- 3.1.2. Bottom-Up Approach
- 3.1.3. Hybrid Approach
- 3.2. Market Assessment Framework
- 3.2.1. Total Addressable Market (TAM)
- 3.2.2. Serviceable Addressable Market (SAM)
- 3.2.3. Serviceable Obtainable Market (SOM)
- 3.2.4. Currently Acquired Market (CAM)
- 3.3. Forecasting Tools and Techniques
- 3.3.1. Qualitative Forecasting
- 3.3.2. Correlation
- 3.3.3. Regression
- 3.3.4. Time Series Analysis
- 3.3.5. Extrapolation
- 3.3.6. Convergence
- 3.3.7. Forecast Error Analysis
- 3.3.8. Data Visualization
- 3.3.9. Scenario Planning
- 3.3.10. Sensitivity Analysis
- 3.4. Key Considerations
- 3.4.1. Demographics
- 3.4.2. Market Access
- 3.4.3. Reimbursement Scenarios
- 3.4.4. Industry Consolidation
- 3.5. Robust Quality Control
- 3.6. Key Market Segmentations
- 3.7. Limitations
4. MACRO-ECONOMIC INDICATORS
- 4.1. Chapter Overview
- 4.2. Market Dynamics
- 4.2.1. Time Period
- 4.2.1.1. Historical Trends
- 4.2.1.2. Current and Forecasted Estimates
- 4.2.2. Currency Coverage
- 4.2.2.1. Overview of Major Currencies Affecting the Market
- 4.2.2.2. Impact of Currency Fluctuations on the Industry
- 4.2.3. Foreign Exchange Impact
- 4.2.3.1. Evaluation of Foreign Exchange Rates and Their Impact on Market
- 4.2.3.2. Strategies for Mitigating Foreign Exchange Risk
- 4.2.4. Recession
- 4.2.4.1. Historical Analysis of Past Recessions and Lessons Learnt
- 4.2.4.2. Assessment of Current Economic Conditions and Potential Impact on the Market
- 4.2.5. Inflation
- 4.2.5.1. Measurement and Analysis of Inflationary Pressures in the Economy
- 4.2.5.2. Potential Impact of Inflation on the Market Evolution
- 4.2.6. Interest Rates
- 4.2.6.1. Overview of Interest Rates and Their Impact on the Market
- 4.2.6.2. Strategies for Managing Interest Rate Risk
- 4.2.7. Commodity Flow Analysis
- 4.2.7.1. Type of Commodity
- 4.2.7.2. Origins and Destinations
- 4.2.7.3. Values and Weights
- 4.2.7.4. Modes of Transportation
- 4.2.8. Global Trade Dynamics
- 4.2.8.1. Import Scenario
- 4.2.8.2. Export Scenario
- 4.2.9. War Impact Analysis
- 4.2.9.1. Russian-Ukraine War
- 4.2.9.2. Israel-Hamas War
- 4.2.10. COVID Impact / Related Factors
- 4.2.10.1. Global Economic Impact
- 4.2.10.2. Industry-specific Impact
- 4.2.10.3. Government Response and Stimulus Measures
- 4.2.10.4. Future Outlook and Adaptation Strategies
- 4.2.11. Other Indicators
- 4.2.11.1. Fiscal Policy
- 4.2.11.2. Consumer Spending
- 4.2.11.3. Gross Domestic Product (GDP)
- 4.2.11.4. Employment
- 4.2.11.5. Taxes
- 4.2.11.6. R&D Innovation
- 4.2.11.7. Stock Market Performance
- 4.2.11.8. Supply Chain
- 4.2.11.9. Cross-Border Dynamics
- 4.2.1. Time Period
SECTION II: QUALITATIVE INSIGHTS
5. EXECUTIVE SUMMARY
6. INTRODUCTION
- 6.1. Chapter Overview
- 6.2. Overview of Decentralized Finance Market
- 6.2.1. Type of Component
- 6.2.2. Type of Application
- 6.2.3. Type of Industry Served
- 6.2.4. Type of Enterprise
- 6.3. Future Perspective
7. REGULATORY SCENARIO
SECTION III: MARKET OVERVIEW
8. COMPREHENSIVE DATABASE OF LEADING PLAYERS
9. COMPETITIVE LANDSCAPE
- 9.1. Chapter Overview
- 9.2. Decentralized Finance: Overall Market Landscape
- 9.2.1. Analysis by Year of Establishment
- 9.2.2. Analysis by Company Size
- 9.2.3. Analysis by Location of Headquarters
- 9.2.4. Analysis by Ownership Structure
10. WHITE SPACE ANALYSIS
11. COMPANY COMPETITIVENESS ANALYSIS
12. STARTUP ECOSYSTEM IN THE DECENTRALIZED FINANCE MARKET
- 12.1. Decentralized Finance Market: Market Landscape of Startups
- 12.1.1. Analysis by Year of Establishment
- 12.1.2. Analysis by Company Size
- 12.1.3. Analysis by Company Size and Year of Establishment
- 12.1.4. Analysis by Location of Headquarters
- 12.1.5. Analysis by Company Size and Location of Headquarters
- 12.1.6. Analysis by Ownership Structure
- 12.2. Key Findings
SECTION IV: COMPANY PROFILES
13. COMPANY PROFILES
- 13.1. Chapter Overview
- 13.2. Aave*
- 13.2.1. Company Overview
- 13.2.2. Company Mission
- 13.2.3. Company Footprint
- 13.2.4. Management Team
- 13.2.5. Contact Details
- 13.2.6. Financial Performance
- 13.2.7. Operating Business Segments
- 13.2.8. Service / Product Portfolio (project specific)
- 13.2.9. MOAT Analysis
- 13.2.10. Recent Developments and Future Outlook
- 13.3. Accenture
- 13.4. Badger DAO
- 13.5. Balancer
- 13.6. Compound Labs
- 13.7. Curve Finance
- 13.8. Deloitte
- 13.9. Hashflow
- 13.10. IBM
- 13.11. MakerDAO
- 13.12. MetaMask
- 13.13. RisingMax
- 13.14. Suffescom Solutions
- 13.15. SushiSwap
- 13.16. Synthetix
- 13.17. Uniswap
SECTION V: MARKET TRENDS
14. MEGA TRENDS ANALYSIS
15. UNMET NEED ANALYSIS
16. PATENT ANALYSIS
17. RECENT DEVELOPMENTS
- 17.1. Chapter Overview
- 17.2. Recent Funding
- 17.3. Recent Partnerships
- 17.4. Other Recent Initiatives
SECTION VI: MARKET OPPORTUNITY ANALYSIS
18. GLOBAL DECENTRALIZED FINANCE MARKET
- 18.1. Chapter Overview
- 18.2. Key Assumptions and Methodology
- 18.3. Trends Disruption Impacting Market
- 18.4. Demand Side Trends
- 18.5. Supply Side Trends
- 18.6. Global Decentralized Finance Market, Historical Trends (Since 2019) and Forecasted Estimates (Till 2035)
- 18.7. Multivariate Scenario Analysis
- 18.7.1. Conservative Scenario
- 18.7.2. Optimistic Scenario
- 18.8. Investment Feasibility Index
- 18.9. Key Market Segmentations
19. DECENTRALIZED FINANCE MARKET OPPORTUNITY BASED ON TYPE OF COMPONENT
- 19.1. Chapter Overview
- 19.2. Key Assumptions and Methodology
- 19.3. Revenue Shift Analysis
- 19.4. Market Movement Analysis
- 19.5. Penetration-Growth (P-G) Matrix
- 19.6. Decentralized Finance Market for Blockchain Technology: Historical Trends (Since 2019) and Forecasted Estimates (Till 2035)
- 19.7. Decentralized Finance Market for Decentralized Applications: Historical Trends (Since 2019) and Forecasted Estimates (Till 2035)
- 19.8. Decentralized Finance Market for Smart Contracts: Historical Trends (Since 2019) and Forecasted Estimates (Till 2035)
- 19.9. Data Triangulation and Validation
- 19.9.1. Secondary Sources
- 19.9.2. Primary Sources
- 19.9.3. Statistical Modeling
20. MARKET OPPORTUNITIES BASED ON TYPE OF APPLICATION
- 20.1. Chapter Overview
- 20.2. Key Assumptions and Methodology
- 20.3. Revenue Shift Analysis
- 20.4. Market Movement Analysis
- 20.5. Penetration-Growth (P-G) Matrix
- 20.6. Decentralized Finance Market for Asset Management: Historical Trends (Since 2019) and Forecasted Estimates (Till 2035)
- 20.7. Decentralized Finance Market for Compliance and Identity: Historical Trends (Since 2019) and Forecasted Estimates (Till 2035)
- 20.8. Decentralized Finance Market for Data Analytics: Historical Trends (Since 2019) and Forecasted Estimates (Till 2035)
- 20.9. Decentralized Finance Market for Gaming: Historical Trends (Since 2019) and Forecasted Estimates (Till 2035)
- 20.10. Decentralized Finance Market for Payments: Historical Trends (Since 2019) and Forecasted Estimates (Till 2035)
- 20.11. Data Triangulation and Validation
- 20.11.1. Secondary Sources
- 20.11.2. Primary Sources
- 20.11.3. Statistical Modeling
21. MARKET OPPORTUNITIES BASED ON TYPE OF INDUSTRY SERVED
- 21.1. Chapter Overview
- 21.2. Key Assumptions and Methodology
- 21.3. Revenue Shift Analysis
- 21.4. Market Movement Analysis
- 21.5. Penetration-Growth (P-G) Matrix
- 21.6. Decentralized Finance Market for BFSI: Historical Trends (Since 2019) and Forecasted Estimates (Till 2035)
- 21.7. Decentralized Finance Market for Automotive: Historical Trends (Since 2019) and Forecasted Estimates (Till 2035)
- 21.8. Decentralized Finance Market for Media & Entertainment: Historical Trends (Since 2019) and Forecasted Estimates (Till 2035)
- 21.9. Decentralized Finance Market for Retail & E-commerce: Historical Trends (Since 2019) and Forecasted Estimates (Till 2035)
- 21.10. Decentralized Finance Market for Others: Historical Trends (Since 2019) and Forecasted Estimates (Till 2035)
- 21.11. Data Triangulation and Validation
- 21.11.1. Secondary Sources
- 21.11.2. Primary Sources
- 21.11.3. Statistical Modeling
22. MARKET OPPORTUNITIES BASED ON TYPE OF ENTERPRISE
- 22.1. Chapter Overview
- 22.2. Key Assumptions and Methodology
- 22.3. Revenue Shift Analysis
- 22.4. Market Movement Analysis
- 22.5. Penetration-Growth (P-G) Matrix
- 22.6. Decentralized Finance Market for Large: Historical Trends (Since 2019) and Forecasted Estimates (Till 2035)
- 22.7. Decentralized Finance Market for Small and Medium Enterprise: Historical Trends (Since 2019) and Forecasted Estimates (Till 2035)
- 22.8. Data Triangulation and Validation
- 22.8.1. Secondary Sources
- 22.8.2. Primary Sources
- 22.8.3. Statistical Modeling
23. MARKET OPPORTUNITIES FOR DECENTRALIZED FINANCE IN NORTH AMERICA
- 23.1. Chapter Overview
- 23.2. Key Assumptions and Methodology
- 23.3. Revenue Shift Analysis
- 23.4. Market Movement Analysis
- 23.5. Penetration-Growth (P-G) Matrix
- 23.6. Decentralized Finance Market in North America: Historical Trends (Since 2019) and Forecasted Estimates (Till 2035)
- 23.6.1. Decentralized Finance Market in the US: Historical Trends (Since 2019) and Forecasted Estimates (Till 2035)
- 23.6.2. Decentralized Finance Market in Canada: Historical Trends (Since 2019) and Forecasted Estimates (Till 2035)
- 23.6.3. Decentralized Finance Market in Mexico: Historical Trends (Since 2019) and Forecasted Estimates (Till 2035)
- 23.6.4. Decentralized Finance Market in Other North American Countries: Historical Trends (Since 2019) and Forecasted Estimates (Till 2035)
- 23.7. Data Triangulation and Validation
24. MARKET OPPORTUNITIES FOR DECENTRALIZED FINANCE IN EUROPE
- 24.1. Chapter Overview
- 24.2. Key Assumptions and Methodology
- 24.3. Revenue Shift Analysis
- 24.4. Market Movement Analysis
- 24.5. Penetration-Growth (P-G) Matrix
- 24.6. Decentralized Finance Market in Europe: Historical Trends (Since 2019) and Forecasted Estimates (Till 2035)
- 24.6.1. Decentralized Finance Market in Austria: Historical Trends (Since 2019) and Forecasted Estimates (Till 2035)
- 24.6.2. Decentralized Finance Market in Belgium: Historical Trends (Since 2019) and Forecasted Estimates (Till 2035)
- 24.6.3. Decentralized Finance Market in Denmark: Historical Trends (Since 2019) and Forecasted Estimates (Till 2035)
- 24.6.4. Decentralized Finance Market in France: Historical Trends (Since 2019) and Forecasted Estimates (Till 2035)
- 24.6.5. Decentralized Finance Market in Germany: Historical Trends (Since 2019) and Forecasted Estimates (Till 2035)
- 24.6.6. Decentralized Finance Market in Ireland: Historical Trends (Since 2019) and Forecasted Estimates (Till 2035)
- 24.6.7. Decentralized Finance Market in Italy: Historical Trends (Since 2019) and Forecasted Estimates (Till 2035)
- 24.6.8. Decentralized Finance Market in Netherlands: Historical Trends (Since 2019) and Forecasted Estimates (Till 2035)
- 24.6.9. Decentralized Finance Market in Norway: Historical Trends (Since 2019) and Forecasted Estimates (Till 2035)
- 24.6.10. Decentralized Finance Market in Russia: Historical Trends (Since 2019) and Forecasted Estimates (Till 2035)
- 24.6.11. Decentralized Finance Market in Spain: Historical Trends (Since 2019) and Forecasted Estimates (Till 2035)
- 24.6.12. Decentralized Finance Market in Sweden: Historical Trends (Since 2019) and Forecasted Estimates (Till 2035)
- 24.6.13. Decentralized Finance Market in Sweden: Historical Trends (Since 2019) and Forecasted Estimates (Till 2035)
- 24.6.14. Decentralized Finance Market in Switzerland: Historical Trends (Since 2019) and Forecasted Estimates (Till 2035)
- 24.6.15. Decentralized Finance Market in the UK: Historical Trends (Since 2019) and Forecasted Estimates (Till 2035)
- 24.6.16. Decentralized Finance Market in Other European Countries: Historical Trends (Since 2019) and Forecasted Estimates (Till 2035)
- 24.7. Data Triangulation and Validation
25. MARKET OPPORTUNITIES FOR DECENTRALIZED FINANCE IN ASIA
- 25.1. Chapter Overview
- 25.2. Key Assumptions and Methodology
- 25.3. Revenue Shift Analysis
- 25.4. Market Movement Analysis
- 25.5. Penetration-Growth (P-G) Matrix
- 25.6. Decentralized Finance Market in Asia: Historical Trends (Since 2019) and Forecasted Estimates (Till 2035)
- 25.6.1. Decentralized Finance Market in China: Historical Trends (Since 2019) and Forecasted Estimates (Till 2035)
- 25.6.2. Decentralized Finance Market in India: Historical Trends (Since 2019) and Forecasted Estimates (Till 2035)
- 25.6.3. Decentralized Finance Market in Japan: Historical Trends (Since 2019) and Forecasted Estimates (Till 2035)
- 25.6.4. Decentralized Finance Market in Singapore: Historical Trends (Since 2019) and Forecasted Estimates (Till 2035)
- 25.6.5. Decentralized Finance Market in South Korea: Historical Trends (Since 2019) and Forecasted Estimates (Till 2035)
- 25.6.6. Decentralized Finance Market in Other Asian Countries: Historical Trends (Since 2019) and Forecasted Estimates (Till 2035)
- 25.7. Data Triangulation and Validation
26. MARKET OPPORTUNITIES FOR DECENTRALIZED FINANCE IN MIDDLE EAST AND NORTH AFRICA (MENA)
- 26.1. Chapter Overview
- 26.2. Key Assumptions and Methodology
- 26.3. Revenue Shift Analysis
- 26.4. Market Movement Analysis
- 26.5. Penetration-Growth (P-G) Matrix
- 26.6. Decentralized Finance Market in Middle East and North Africa (MENA): Historical Trends (Since 2019) and Forecasted Estimates (Till 2035)
- 26.6.1. Decentralized Finance Market in Egypt: Historical Trends (Since 2019) and Forecasted Estimates (Till 205)
- 26.6.2. Decentralized Finance Market in Iran: Historical Trends (Since 2019) and Forecasted Estimates (Till 2035)
- 26.6.3. Decentralized Finance Market in Iraq: Historical Trends (Since 2019) and Forecasted Estimates (Till 2035)
- 26.6.4. Decentralized Finance Market in Israel: Historical Trends (Since 2019) and Forecasted Estimates (Till 2035)
- 26.6.5. Decentralized Finance Market in Kuwait: Historical Trends (Since 2019) and Forecasted Estimates (Till 2035)
- 26.6.6. Decentralized Finance Market in Saudi Arabia: Historical Trends (Since 2019) and Forecasted Estimates (Till 2035)
- 26.6.7. Decentralized Finance Market in United Arab Emirates (UAE): Historical Trends (Since 2019) and Forecasted Estimates (Till 2035)
- 26.6.8. Decentralized Finance Market in Other MENA Countries: Historical Trends (Since 2019) and Forecasted Estimates (Till 2035)
- 26.7. Data Triangulation and Validation
27. MARKET OPPORTUNITIES FOR DECENTRALIZED FINANCE IN LATIN AMERICA
- 27.1. Chapter Overview
- 27.2. Key Assumptions and Methodology
- 27.3. Revenue Shift Analysis
- 27.4. Market Movement Analysis
- 27.5. Penetration-Growth (P-G) Matrix
- 27.6. Decentralized Finance Market in Latin America: Historical Trends (Since 2019) and Forecasted Estimates (Till 2035)
- 27.6.1. Decentralized Finance Market in Argentina: Historical Trends (Since 2019) and Forecasted Estimates (Till 2035)
- 27.6.2. Decentralized Finance Market in Brazil: Historical Trends (Since 2019) and Forecasted Estimates (Till 2035)
- 27.6.3. Decentralized Finance Market in Chile: Historical Trends (Since 2019) and Forecasted Estimates (Till 2035)
- 27.6.4. Decentralized Finance Market in Colombia Historical Trends (Since 2019) and Forecasted Estimates (Till 2035)
- 27.6.5. Decentralized Finance Market in Venezuela: Historical Trends (Since 2019) and Forecasted Estimates (Till 2035)
- 27.6.6. Decentralized Finance Market in Other Latin American Countries: Historical Trends (Since 2019) and Forecasted Estimates (Till 2035)
- 27.7. Data Triangulation and Validation
28. MARKET OPPORTUNITIES FOR DECENTRALIZED FINANCE IN REST OF THE WORLD
- 28.1. Chapter Overview
- 28.2. Key Assumptions and Methodology
- 28.3. Revenue Shift Analysis
- 28.4. Market Movement Analysis
- 28.5. Penetration-Growth (P-G) Matrix
- 28.6. Decentralized Finance Market in Rest of the World: Historical Trends (Since 2019) and Forecasted Estimates (Till 2035)
- 28.6.1. Decentralized Finance Market in Australia: Historical Trends (Since 2019) and Forecasted Estimates (Till 2035)
- 28.6.2. Decentralized Finance Market in New Zealand: Historical Trends (Since 2019) and Forecasted Estimates (Till 2035)
- 28.6.3. Decentralized Finance Market in Other Countries
- 28.7. Data Triangulation and Validation
29. MARKET CONCENTRATION ANALYSIS: DISTRIBUTION BY LEADING PLAYERS
- 29.1. Leading Player 1
- 29.2. Leading Player 2
- 29.3. Leading Player 3
- 29.4. Leading Player 4
- 29.5. Leading Player 5
- 29.6. Leading Player 6
- 29.7. Leading Player 7
- 29.8. Leading Player 8
30. ADJACENT MARKET ANALYSIS
SECTION VII: STRATEGIC TOOLS
31. KEY WINNING STRATEGIES
32. PORTER'S FIVE FORCES ANALYSIS
33. SWOT ANALYSIS
34. VALUE CHAIN ANALYSIS
35. ROOTS STRATEGIC RECOMMENDATIONS
- 35.1. Chapter Overview
- 35.2. Key Business-related Strategies
- 35.2.1. Research & Development
- 35.2.2. Product Manufacturing
- 35.2.3. Commercialization / Go-to-Market
- 35.2.4. Sales and Marketing
- 35.3. Key Operations-related Strategies
- 35.3.1. Risk Management
- 35.3.2. Workforce
- 35.3.3. Finance
- 35.3.4. Others
