|
시장보고서
상품코드
1849795
스마트 재료 시장(-2035년) : 재료 유형별, 용도 유형별, 최종사용자 유형별, 지역별, 산업 동향, 예측Smart Materials Market, Till 2035: Distribution by Type of Material, Type of Application, Type of End User, Geographical Regions: Industry Trends and Global Forecasts |
||||||
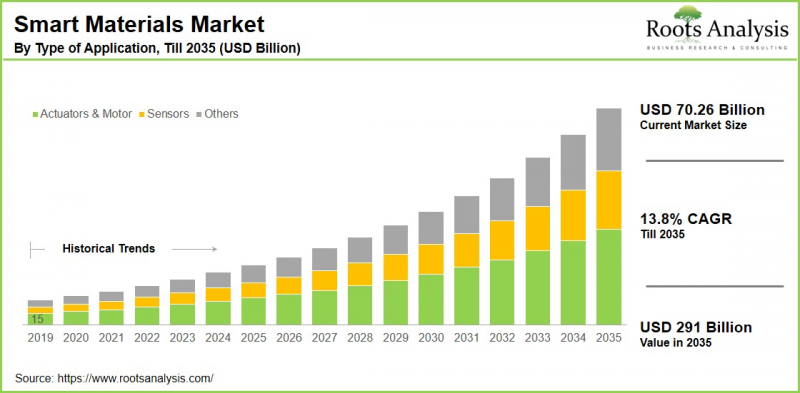
세계 스마트 재료 시장 규모는 현재 702억 6,000만 달러에서 2035년까지 2,910억 달러에 달할 것으로 예상되며, 2035년까지 예측 기간 동안 CAGR 13.8%로 성장할 것으로 예상됩니다.
스마트 재료 시장 : 성장과 동향
반응성 재료 또는 지능형 재료라고 불리는 스마트 재료는 압력, 온도, 전기장 또는 자기장과 같은 외부 자극에 반응하여 특성을 변화시킬 수 있는 독특한 능력을 가진 첨단 재료의 범주입니다. 스마트 재료는 그 특징적인 특성으로 인해 다양한 산업 분야에서 채택되고 있으며, 항공에서 에너지에 이르기까지 다양한 분야에서 필수적인 구성요소로 작용하고 있습니다.
환경적 요인에 따라 특성을 변화시키는 능력, 적응성, 다기능성, 향상된 감각 능력으로 인해 스마트 재료는 매우 다재다능하고 다양한 용도로 활용가치가 높습니다. 예를 들어, 압전 재료는 기계 에너지를 전기 에너지로 변환하는 센서, 액추에이터, 초음파 트랜스듀서 등에 활용되고 있습니다. 마찬가지로 자기유변학 유체와 같은 스마트 유체는 적응형 쇼크 업소버, 클러치, 댐퍼에 적용되고 있습니다.
또한, 자가 치유 능력, 내구성 향상, 에너지 효율성 등 스마트 재료의 장점은 기업과 산업계가 첨단 기술과 소재를 채택하도록 유도하고 있습니다. 또한, 기술의 급속한 발전은 보다 스마트하고 효율적인 소재의 창출을 가능하게 하여 스마트 재료 시장의 성장에 새로운 길을 열어줄 것입니다. 그 결과, 의료, 건설 등의 분야에서 첨단 기술을 활용한 맞춤형 솔루션에 대한 수요 증가에 대응하기 위해 연구개발에 자원을 투입하는 시장 기업들이 늘어나고 있습니다. 이러한 요인들을 고려할 때, 스마트 재료 시장은 예측 기간 동안 크게 성장할 것으로 예상됩니다.
세계의 스마트 재료 시장에 대해 조사했으며, 시장 규모 추정과 기회 분석, 경쟁 상황, 기업 프로파일 등의 정보를 전해드립니다.
목차
제1장 서문
제2장 조사 방법
제3장 경제적 고려사항, 기타 프로젝트 특유의 고려사항
제4장 거시경제 지표
제5장 주요 요약
제6장 소개
제7장 경쟁 구도
제8장 기업 개요
- 분석 개요
- AMETEK
- APC International
- Arkema
- Cerametric
- CeramTech
- Channel Technologies
- Confluent Medical Technologies
- CTS
- Gentex
- Harris
- Huntsman
- Johnson Matthey
- Kyocera
- LORD
- Noliac A/S
- Piezo Kinetics
- QorTek
- SAGE Electrochromics
- Solvay
- TDK
- The Lubrizol
- Wright Medical Group
제9장 밸류체인 분석
제10장 SWOT 분석
제11장 세계의 스마트 재료 시장
제12장 시장 기회 : 재료 유형별
제13장 시장 기회 : 용도 유형별
제14장 시장 기회 : 최종사용자 유형별
제15장 북미의 스마트 재료 시장 기회
제16장 유럽의 스마트 재료 시장 기회
제17장 아시아의 스마트 재료 시장 기회
제18장 중동 및 북아프리카(MENA)의 스마트 재료 시장 기회
제19장 라틴아메리카의 스마트 재료 시장 기회
제20장 기타 지역의 스마트 재료 시장 기회
제21장 표형식 데이터
제22장 기업·단체 리스트
제23장 맞춤화의 기회
제24장 Roots의 구독 서비스
제25장 저자 상세
KSM 25.10.31Smart Materials Market Overview
As per Roots Analysis, the global smart materials market size is estimated to grow from USD 70.26 billion in the current year USD 291 billion by 2035, at a CAGR of 13.8% during the forecast period, till 2035.

The opportunity for smart materials market has been distributed across the following segments:
Type of Material
- Electrochromic
- Electrostrictive
- Magnetostrictive
- Phase Change Material
- Piezoelectric
- Shape Memory Alloys
- Smart Fluids
Type of Application
- Actuators & Motor
- Sensors
- Structural Materials
- Transducers
- Others
Type of End User
- Aerospace & Defense
- Automotive
- Construction
- Consumer Electronics
- Healthcare
- Others
Geographical Regions
- North America
- US
- Canada
- Mexico
- Other North American countries
- Europe
- Austria
- Belgium
- Denmark
- France
- Germany
- Ireland
- Italy
- Netherlands
- Norway
- Russia
- Spain
- Sweden
- Switzerland
- UK
- Other European countries
- Asia
- China
- India
- Japan
- Singapore
- South Korea
- Other Asian countries
- Latin America
- Brazil
- Chile
- Colombia
- Venezuela
- Other Latin American countries
- Middle East and North Africa
- Egypt
- Iran
- Iraq
- Israel
- Kuwait
- Saudi Arabia
- UAE
- Other MENA countries
- Rest of the World
- Australia
- New Zealand
- Other countries
Smart Materials Market: Growth and Trends
Smart materials, referred to as responsive or intelligent materials, are a category of advanced materials that possess the unique ability to change their properties in reaction to external stimuli such as pressure, temperature, and electric or magnetic fields. Due to their distinctive characteristics, smart materials are increasingly being adopted in various industries, serving as essential components in sectors ranging from aviation to energy.
Their ability to alter their properties based on environmental factors, along with their adaptive multifunctionality and heightened sensory capabilities, render them highly versatile and valuable for multiple applications. For example, piezoelectric materials are in high demand and utilized in sensors, actuators, and ultrasonic transducers to transform mechanical energy into electrical energy. Similarly, smart fluids like magnetorheological fluids are employed in adaptive shock absorbers, clutches, and dampers.
Moreover, the benefits of smart materials, such as self-healing capabilities, improved durability, and energy efficiency, attract businesses and industries to adopt advanced technologies and materials. Additionally, rapid advancements in technology enables the creation of smarter, more efficient materials open up new avenues for the growth of the smart material market. Consequently, an increasing number of market players are dedicating resources to research and development in order to harness cutting-edge technologies and meet the rising demand for customized solutions in fields like healthcare, construction, and more. Considering these factors, the smart materials market is expected to grow significantly during the forecast period.
Smart Materials Market: Key Segments
Market Share by Type of Material
Based on type of material, the global smart materials market is segmented into electrochromic, electrostrictive, magnetostrictive, phase change material, piezoelectric, shape memory alloys, and smart fluids. According to our estimates, currently, the piezoelectric material segment captures the majority of the market share. This growth is primarily driven by its essential role as they are frequently utilized in sensors and actuators because of their responsiveness to mechanical stress.
Conversely, the shape memory alloys segment is expected to grow at a higher compound annual growth rate (CAGR) during the forecast period, fueled by the rising demand from the healthcare industry, where they are extensively employed in medical devices such as stents, guidewires, and orthodontic wires.
Market Share by Type of Application
Based on type of application, the global smart materials market is segmented into actuators & motors, sensors, structural materials, transducers, and others. According to our estimates, currently, the actuator application segment captures the majority of the market share. This is due to the extensive use of smart materials in actuators, which are crucial for transforming energy from one form to another and facilitating responsive and adaptive systems across different applications.
On the other hand, the sensor application segment is anticipated to grow at a higher CAGR during the forecast period. This growth can be attributed to the increasing demand in the automotive and aerospace sectors, where they are utilized in tire pressure monitoring and vibration control systems.
Market Share by Type of End User
Based on type of end user, the global smart materials market is segmented into aerospace & defense, automotive, construction, consumer electronics, healthcare, and others. According to our estimates, currently, the aerospace and defense industry captures the majority of the market share. This is due to the significant need for advanced materials that can endure harsh conditions like high temperatures, pressure variations, and mechanical stress.
On the other hand, the automotive industry is anticipated to grow at a higher CAGR during the forecast period. This is primarily due to the rising use of smart materials in actuators for seat adjustments and piezoelectric sensors in airbag systems for impact detection.
Market Share by Geographical Regions
Based on geographical regions, the smart materials market is segmented into North America, Europe, Asia, Latin America, Middle East and North Africa, and the rest of the world. According to our estimates, currently, North America captures the majority share of the market. Furthermore, the market in Asia is projected to experience a higher compound annual growth rate (CAGR) during the forecast period. This growth can be linked to the expansion of the electronic and automotive industries, coupled with a robust manufacturing base in Asian countries such as China, Taiwan, and South Korea.
Example Players in Smart Materials Market
- AMETEK
- APC International
- Arkema
- Cerametric
- CeramTech
- Channel Technologies
- Confluent Medical Technologies
- CTS
- Gentex
- Harris
- Huntsman
- Johnson Matthey
- Kyocera
- LORD
- Meggitt
- Noliac A/S
- Piezo Kinetics
- QorTek
- SAGE Electrochromics
- Solvay
- TDK
- The Lubrizol
- Wright Medical Group
Smart Materials Market: Research Coverage
The report on the smart materials market features insights on various sections, including:
- Market Sizing and Opportunity Analysis: An in-depth analysis of the smart materials market, focusing on key market segments, including [A] type of material, [B] type of application, [C] type of end user, [D] geographical regions.
- Competitive Landscape: A comprehensive analysis of the companies engaged in the smart materials market, based on several relevant parameters, such as [A] year of establishment, [B] company size, [C] location of headquarters and [D] ownership structure.
- Company Profiles: Elaborate profiles of prominent players engaged in the smart materials market, providing details on [A] location of headquarters, [B] company size, [C] company mission, [D] company footprint, [E] management team, [F] contact details, [G] financial information, [H] operating business segments, [I] smart materials portfolio, [J] moat analysis, [K] recent developments, and an informed future outlook.
- SWOT Analysis: An insightful SWOT framework, highlighting the strengths, weaknesses, opportunities and threats in the domain. Additionally, it provides Harvey ball analysis, highlighting the relative impact of each SWOT parameter.
- Value Chain Analysis: A comprehensive analysis of the value chain, providing information on the different phases and stakeholders involved in the smart materials market.
Key Questions Answered in this Report
- How many companies are currently engaged in smart materials market?
- Which are the leading companies in this market?
- What factors are likely to influence the evolution of this market?
- What is the current and future market size?
- What is the CAGR of this market?
- How is the current and future market opportunity likely to be distributed across key market segments?
Reasons to Buy this Report
- The report provides a comprehensive market analysis, offering detailed revenue projections of the overall market and its specific sub-segments. This information is valuable to both established market leaders and emerging entrants.
- Stakeholders can leverage the report to gain a deeper understanding of the competitive dynamics within the market. By analyzing the competitive landscape, businesses can make informed decisions to optimize their market positioning and develop effective go-to-market strategies.
- The report offers stakeholders a comprehensive overview of the market, including key drivers, barriers, opportunities, and challenges. This information empowers stakeholders to stay abreast of market trends and make data-driven decisions to capitalize on growth prospects.
Additional Benefits
- Complimentary Excel Data Packs for all Analytical Modules in the Report
- 15% Free Content Customization
- Detailed Report Walkthrough Session with Research Team
- Free Updated report if the report is 6-12 months old or older
TABLE OF CONTENTS
1. PREFACE
- 1.1. Introduction
- 1.2. Market Share Insights
- 1.3. Key Market Insights
- 1.4. Report Coverage
- 1.5. Key Questions Answered
- 1.6. Chapter Outlines
2. RESEARCH METHODOLOGY
- 2.1. Chapter Overview
- 2.2. Research Assumptions
- 2.3. Database Building
- 2.3.1. Data Collection
- 2.3.2. Data Validation
- 2.3.3. Data Analysis
- 2.4. Project Methodology
- 2.4.1. Secondary Research
- 2.4.1.1. Annual Reports
- 2.4.1.2. Academic Research Papers
- 2.4.1.3. Company Websites
- 2.4.1.4. Investor Presentations
- 2.4.1.5. Regulatory Filings
- 2.4.1.6. White Papers
- 2.4.1.7. Industry Publications
- 2.4.1.8. Conferences and Seminars
- 2.4.1.9. Government Portals
- 2.4.1.10. Media and Press Releases
- 2.4.1.11. Newsletters
- 2.4.1.12. Industry Databases
- 2.4.1.13. Roots Proprietary Databases
- 2.4.1.14. Paid Databases and Sources
- 2.4.1.15. Social Media Portals
- 2.4.1.16. Other Secondary Sources
- 2.4.2. Primary Research
- 2.4.2.1. Introduction
- 2.4.2.2. Types
- 2.4.2.2.1. Qualitative
- 2.4.2.2.2. Quantitative
- 2.4.2.3. Advantages
- 2.4.2.4. Techniques
- 2.4.2.4.1. Interviews
- 2.4.2.4.2. Surveys
- 2.4.2.4.3. Focus Groups
- 2.4.2.4.4. Observational Research
- 2.4.2.4.5. Social Media Interactions
- 2.4.2.5. Stakeholders
- 2.4.2.5.1. Company Executives (CXOs)
- 2.4.2.5.2. Board of Directors
- 2.4.2.5.3. Company Presidents and Vice Presidents
- 2.4.2.5.4. Key Opinion Leaders
- 2.4.2.5.5. Research and Development Heads
- 2.4.2.5.6. Technical Experts
- 2.4.2.5.7. Subject Matter Experts
- 2.4.2.5.8. Scientists
- 2.4.2.5.9. Doctors and Other Healthcare Providers
- 2.4.2.6. Ethics and Integrity
- 2.4.2.6.1. Research Ethics
- 2.4.2.6.2. Data Integrity
- 2.4.3. Analytical Tools and Databases
- 2.4.1. Secondary Research
3. ECONOMIC AND OTHER PROJECT SPECIFIC CONSIDERATIONS
- 3.1. Forecast Methodology
- 3.1.1. Top-Down Approach
- 3.1.2. Bottom-Up Approach
- 3.1.3. Hybrid Approach
- 3.2. Market Assessment Framework
- 3.2.1. Total Addressable Market (TAM)
- 3.2.2. Serviceable Addressable Market (SAM)
- 3.2.3. Serviceable Obtainable Market (SOM)
- 3.2.4. Currently Acquired Market (CAM)
- 3.3. Forecasting Tools and Techniques
- 3.3.1. Qualitative Forecasting
- 3.3.2. Correlation
- 3.3.3. Regression
- 3.3.4. Time Series Analysis
- 3.3.5. Extrapolation
- 3.3.6. Convergence
- 3.3.7. Forecast Error Analysis
- 3.3.8. Data Visualization
- 3.3.9. Scenario Planning
- 3.3.10. Sensitivity Analysis
- 3.4. Key Considerations
- 3.4.1. Demographics
- 3.4.2. Market Access
- 3.4.3. Reimbursement Scenarios
- 3.4.4. Industry Consolidation
- 3.5. Robust Quality Control
- 3.6. Key Market Segmentations
- 3.7. Limitations
4. MACRO-ECONOMIC INDICATORS
- 4.1. Chapter Overview
- 4.2. Market Dynamics
- 4.2.1. Time Period
- 4.2.1.1. Historical Trends
- 4.2.1.2. Current and Forecasted Estimates
- 4.2.1. Time Period
4.2.2. Currency Coverage
- 4.2.2.1. Overview of Major Currencies Affecting the Market
- 4.2.2.2. Impact of Currency Fluctuations on the Industry
- 4.2.3. Foreign Exchange Impact
- 4.2.3.1. Evaluation of Foreign Exchange Rates and Their Impact on Market
- 4.2.3.2. Strategies for Mitigating Foreign Exchange Risk
- 4.2.4. Recession
- 4.2.4.1. Historical Analysis of Past Recessions and Lessons Learnt
- 4.2.4.2. Assessment of Current Economic Conditions and Potential Impact on the Market
- 4.2.5. Inflation
- 4.2.5.1. Measurement and Analysis of Inflationary Pressures in the Economy
- 4.2.5.2. Potential Impact of Inflation on the Market Evolution
- 4.2.6. Interest Rates
- 4.2.6.1. Overview of Interest Rates and Their Impact on the Market
- 4.2.6.2. Strategies for Managing Interest Rate Risk
- 4.2.7. Commodity Flow Analysis
- 4.2.7.1. Type of Commodity
- 4.2.7.2. Origins and Destinations
- 4.2.7.3. Values and Weights
- 4.2.7.4. Modes of Transportation
- 4.2.8. Global Trade Dynamics
- 4.2.8.1. Import Scenario
- 4.2.8.2. Export Scenario
- 4.2.9. War Impact Analysis
- 4.2.9.1. Russian-Ukraine War
- 4.2.9.2. Israel-Hamas War
- 4.2.10. COVID Impact / Related Factors
- 4.2.10.1. Global Economic Impact
- 4.2.10.2. Industry-specific Impact
- 4.2.10.3. Government Response and Stimulus Measures
- 4.2.10.4. Future Outlook and Adaptation Strategies
- 4.2.11. Other Indicators
- 4.2.11.1. Fiscal Policy
- 4.2.11.2. Consumer Spending
- 4.2.11.3. Gross Domestic Product (GDP)
- 4.2.11.4. Employment
- 4.2.11.5. Taxes
- 4.2.11.6. R&D Innovation
- 4.2.11.7. Stock Market Performance
- 4.2.11.8. Supply Chain
- 4.2.11.9. Cross-Border Dynamics
5. EXECUTIVE SUMMARY
6. INTRODUCTION
- 6.1. Chapter Overview
- 6.2. Overview of Smart Materials Market
- 6.2.1. Type of Material
- 6.2.2. Type of Application
- 6.2.3. Type of End User
- 6.3. Future Perspective
7. COMPETITIVE LANDSCAPE
- 7.1. Chapter Overview
- 7.2. Smart Material: Overall Market Landscape
- 7.2.1. Analysis by Year of Establishment
- 7.2.2. Analysis by Company Size
- 7.2.3. Analysis by Location of Headquarters
- 7.2.4. Analysis by Ownership Structure
8. COMPANY PROFILES
- 8.1. Chapter Overview
- 8.2. AMETEK*
- 8.2.1. Company Overview
- 8.2.2. Company Mission
- 8.2.3. Company Footprint
- 8.2.4. Management Team
- 8.2.5. Contact Details
- 8.2.6. Financial Performance
- 8.2.7. Operating Business Segments
- 8.2.8. Service / Product Portfolio (project specific)
- 8.2.9. MOAT Analysis
- 8.2.10. Recent Developments and Future Outlook
- 8.3. APC International
- 8.4. Arkema
- 8.5. Cerametric
- 8.6. CeramTech
- 8.7. Channel Technologies
- 8.8. Confluent Medical Technologies
- 8.9. CTS
- 8.10. Gentex
- 8.11. Harris
- 8.12. Huntsman
- 8.13. Johnson Matthey
- 8.14. Kyocera
- 8.15. LORD
- 8.16. Noliac A/S
- 8.17. Piezo Kinetics
- 8.18. QorTek
- 8.19. SAGE Electrochromics
- 8.20. Solvay
- 8.21. TDK
- 8.22. The Lubrizol
- 8.23. Wright Medical Group
9. VALUE CHAIN ANALYSIS
10. SWOT ANALYSIS
11. GLOBAL SMART MATERIALS MARKET
- 11.1. Chapter Overview
- 11.2. Key Assumptions and Methodology
- 11.3. Trends Disruption Impacting Market
- 11.4. Global Smart Materials Market, Historical Trends (Since 2019) and Forecasted Estimates (Till 2035)
- 11.5. Multivariate Scenario Analysis
- 11.5.1. Conservative Scenario
- 11.5.2. Optimistic Scenario
- 11.6. Key Market Segmentations
12. MARKET OPPORTUNITIES BASED ON TYPE OF MATERIAL
- 12.1. Chapter Overview
- 12.2. Key Assumptions and Methodology
- 12.3. Revenue Shift Analysis
- 12.4. Market Movement Analysis
- 12.5. Penetration-Growth (P-G) Matrix
- 12.6. Smart Materials Market for Electrochromic: Historical Trends (Since 2019) and Forecasted Estimates (Till 2035)
- 12.7. Smart Materials Market for Electrostrictive: Historical Trends (Since 2019) and Forecasted Estimates (Till 2035)
- 12.8. Smart Materials Market for Magnetostrictive: Historical Trends (Since 2019) and Forecasted Estimates (Till 2035)
- 12.9. Smart Materials Market for Phase Change Material: Historical Trends (Since 2019) and Forecasted Estimates (Till 2035)
- 12.10. Smart Materials Market for Piezoelectric: Historical Trends (Since 2019) and Forecasted Estimates (Till 2035)
- 12.11. Smart Materials Market for Shape Memory Alloys: Historical Trends (Since 2019) and Forecasted Estimates (Till 2035)
- 12.12. Smart Materials Market for Smart Fluids: Historical Trends (Since 2019) and Forecasted Estimates (Till 2035)
- 12.13. Data Triangulation and Validation
13. MARKET OPPORTUNITIES BASED ON TYPE OF APPLICATION
- 13.1. Chapter Overview
- 13.2. Key Assumptions and Methodology
- 13.3. Revenue Shift Analysis
- 13.4. Market Movement Analysis
- 13.5. Penetration-Growth (P-G) Matrix
- 13.6. Smart Materials Market for Actuators & Motor: Historical Trends (Since 2019) and Forecasted Estimates (Till 2035)
- 13.7. Smart Materials Market for Sensors: Historical Trends (Since 2019) and Forecasted Estimates (Till 2035)
- 13.8. Smart Materials Market for Structural Materials: Historical Trends (Since 2019) and Forecasted Estimates (Till 2035)
- 13.9. Smart Materials Market for Transducers: Historical Trends (Since 2019) and Forecasted Estimates (Till 2035)
- 13.10. Smart Materials Market for Others: Historical Trends (Since 2019) and Forecasted Estimates (Till 2035)
- 13.11. Data Triangulation and Validation
14. MARKET OPPORTUNITIES BASED ON TYPE OF END USER
- 14.1. Chapter Overview
- 14.2. Key Assumptions and Methodology
- 14.3. Revenue Shift Analysis
- 14.4. Market Movement Analysis
- 14.5. Penetration-Growth (P-G) Matrix
- 14.6. Smart Materials Market for Aerospace & Defence: Historical Trends (Since 2019) and Forecasted Estimates (Till 2035)
- 14.7. Smart Materials Market for Automotive: Historical Trends (Since 2019) and Forecasted Estimates (Till 2035)
- 14.8. Smart Materials Market for Construction: Historical Trends (Since 2019) and Forecasted Estimates (Till 2035)
- 14.9. Smart Materials Market for Consumer Electronics: Historical Trends (Since 2019) and Forecasted Estimates (Till 2035)
- 14.10. Smart Materials Market for Healthcare: Historical Trends (Since 2019) and Forecasted Estimates (Till 2035)
- 14.11. Smart Materials Market for Others: Historical Trends (Since 2019) and Forecasted Estimates (Till 2035)
- 14.12. Data Triangulation and Validation
15. MARKET OPPORTUNITIES FOR SMART MATERIALS IN NORTH AMERICA
- 15.1. Chapter Overview
- 15.2. Key Assumptions and Methodology
- 15.3. Revenue Shift Analysis
- 15.4. Market Movement Analysis
- 15.5. Penetration-Growth (P-G) Matrix
- 15.6. Smart Materials Market in North America: Historical Trends (Since 2019) and Forecasted Estimates (Till 2035)
- 15.6.1. Smart Materials Market in the US: Historical Trends (Since 2019) and Forecasted Estimates (Till 2035)
- 15.6.2. Smart Materials Market in Canada: Historical Trends (Since 2019) and Forecasted Estimates (Till 2035)
- 15.6.3. Smart Materials Market in Mexico: Historical Trends (Since 2019) and Forecasted Estimates (Till 2035)
- 15.6.4. Smart Materials Market in Other North American Countries: Historical Trends (Since 2019) and Forecasted Estimates (Till 2035)
- 15.7. Data Triangulation and Validation
16. MARKET OPPORTUNITIES FOR SMART MATERIALS IN EUROPE
- 16.1. Chapter Overview
- 16.2. Key Assumptions and Methodology
- 16.3. Revenue Shift Analysis
- 16.4. Market Movement Analysis
- 16.5. Penetration-Growth (P-G) Matrix
- 16.6. Smart Materials Market in Europe: Historical Trends (Since 2019) and Forecasted Estimates (Till 2035)
- 16.6.1. Smart Materials Market in Austria: Historical Trends (Since 2019) and Forecasted Estimates (Till 2035)
- 16.6.2. Smart Materials Market in Belgium: Historical Trends (Since 2019) and Forecasted Estimates (Till 2035)
- 16.6.3. Smart Materials Market in Denmark: Historical Trends (Since 2019) and Forecasted Estimates (Till 2035)
- 16.6.4. Smart Materials Market in France: Historical Trends (Since 2019) and Forecasted Estimates (Till 2035)
- 16.6.5. Smart Materials Market in Germany: Historical Trends (Since 2019) and Forecasted Estimates (Till 2035)
- 16.6.6. Smart Materials Market in Ireland: Historical Trends (Since 2019) and Forecasted Estimates (Till 2035)
- 16.6.7. Smart Materials Market in Italy: Historical Trends (Since 2019) and Forecasted Estimates (Till 2035)
- 16.6.8. Smart Materials Market in Netherlands: Historical Trends (Since 2019) and Forecasted Estimates (Till 2035)
- 16.6.9. Smart Materials Market in Norway: Historical Trends (Since 2019) and Forecasted Estimates (Till 2035)
- 16.6.10. Smart Materials Market in Russia: Historical Trends (Since 2019) and Forecasted Estimates (Till 2035)
- 16.6.11. Smart Materials Market in Spain: Historical Trends (Since 2019) and Forecasted Estimates (Till 2035)
- 16.6.12. Smart Materials Market in Sweden: Historical Trends (Since 2019) and Forecasted Estimates (Till 2035)
- 16.6.13. Smart Materials Market in Switzerland: Historical Trends (Since 2019) and Forecasted Estimates (Till 2035)
- 16.6.14. Smart Materials Market in the UK: Historical Trends (Since 2019) and Forecasted Estimates (Till 2035)
- 16.6.15. Smart Materials Marketing Other European Countries: Historical Trends (Since 2019) and Forecasted Estimates (Till 2035)
- 16.7. Data Triangulation and Validation
17. MARKET OPPORTUNITIES FOR SMART MATERIALS IN ASIA
- 17.1. Chapter Overview
- 17.2. Key Assumptions and Methodology
- 17.3. Revenue Shift Analysis
- 17.4. Market Movement Analysis
- 17.5. Penetration-Growth (P-G) Matrix
- 17.6. Smart Materials Market in Asia: Historical Trends (Since 2019) and Forecasted Estimates (Till 2035)
- 17.6.1. Smart Materials Market in China: Historical Trends (Since 2019) and Forecasted Estimates (Till 2035)
- 17.6.2. Smart Materials Market in India: Historical Trends (Since 2019) and Forecasted Estimates (Till 2035)
- 17.6.3. Smart Materials Market in Japan: Historical Trends (Since 2019) and Forecasted Estimates (Till 2035)
- 17.6.4. Smart Materials Market in Singapore: Historical Trends (Since 2019) and Forecasted Estimates (Till 2035)
- 17.6.5. Smart Materials Market in South Korea: Historical Trends (Since 2019) and Forecasted Estimates (Till 2035)
- 17.6.6. Smart Materials Market in Other Asian Countries: Historical Trends (Since 2019) and Forecasted Estimates (Till 2035)
- 17.7. Data Triangulation and Validation
18. MARKET OPPORTUNITIES FOR SMART MATERIALS IN MIDDLE EAST AND NORTH AFRICA (MENA)
- 18.1. Chapter Overview
- 18.2. Key Assumptions and Methodology
- 18.3. Revenue Shift Analysis
- 18.4. Market Movement Analysis
- 18.5. Penetration-Growth (P-G) Matrix
- 18.6. Smart Materials Market in Middle East and North Africa (MENA): Historical Trends (Since 2019) and Forecasted Estimates (Till 2035)
- 18.6.1. Smart Materials Market in Egypt: Historical Trends (Since 2019) and Forecasted Estimates (Till 205)
- 18.6.2. Smart Materials Market in Iran: Historical Trends (Since 2019) and Forecasted Estimates (Till 2035)
- 18.6.3. Smart Materials Market in Iraq: Historical Trends (Since 2019) and Forecasted Estimates (Till 2035)
- 18.6.4. Smart Materials Market in Israel: Historical Trends (Since 2019) and Forecasted Estimates (Till 2035)
- 18.6.5. Smart Materials Market in Kuwait: Historical Trends (Since 2019) and Forecasted Estimates (Till 2035)
- 18.6.6. Smart Materials Market in Saudi Arabia: Historical Trends (Since 2019) and Forecasted Estimates (Till 2035)
- 18.6.7. Smart Materials Market in United Arab Emirates (UAE): Historical Trends (Since 2019) and Forecasted Estimates (Till 2035)
- 18.6.8. Smart Materials Market in Other MENA Countries: Historical Trends (Since 2019) and Forecasted Estimates (Till 2035)
- 18.7. Data Triangulation and Validation
19. MARKET OPPORTUNITIES FOR SMART MATERIALS IN LATIN AMERICA
- 19.1. Chapter Overview
- 19.2. Key Assumptions and Methodology
- 19.3. Revenue Shift Analysis
- 19.4. Market Movement Analysis
- 19.5. Penetration-Growth (P-G) Matrix
- 19.6. Smart Materials Market in Latin America: Historical Trends (Since 2019) and Forecasted Estimates (Till 2035)
- 19.6.1. Smart Materials Market in Argentina: Historical Trends (Since 2019) and Forecasted Estimates (Till 2035)
- 19.6.2. Smart Materials Market in Brazil: Historical Trends (Since 2019) and Forecasted Estimates (Till 2035)
- 19.6.3. Smart Materials Market in Chile: Historical Trends (Since 2019) and Forecasted Estimates (Till 2035)
- 19.6.4. Smart Materials Market in Colombia Historical Trends (Since 2019) and Forecasted Estimates (Till 2035)
- 19.6.5. Smart Materials Market in Venezuela: Historical Trends (Since 2019) and Forecasted Estimates (Till 2035)
- 19.6.6. Smart Materials Market in Other Latin American Countries: Historical Trends (Since 2019) and Forecasted Estimates (Till 2035)
- 19.7. Data Triangulation and Validation
20. MARKET OPPORTUNITIES FOR SMART MATERIALS IN REST OF THE WORLD
- 20.1. Chapter Overview
- 20.2. Key Assumptions and Methodology
- 20.3. Revenue Shift Analysis
- 20.4. Market Movement Analysis
- 20.5. Penetration-Growth (P-G) Matrix
- 20.6. Smart Materials Market in Rest of the World: Historical Trends (Since 2019) and Forecasted Estimates (Till 2035)
- 20.6.1. Smart Materials Market in Australia: Historical Trends (Since 2019) and Forecasted Estimates (Till 2035)
- 20.6.2. Smart Materials Market in New Zealand: Historical Trends (Since 2019) and Forecasted Estimates (Till 2035)
- 20.6.3. Smart Materials Market in Other Countries
- 20.7. Data Triangulation and Validation