
|
시장보고서
상품코드
1854915
석유 및 가스용 유동 확보 시장(-2035년) : 제품 유형별, 서비스 유형별, 용도 유형별, 장소 유형별, 지역별, 산업 동향, 예측Flow Assurance in Oil and Gas Market, Till 2035: Distribution by Type of Product, Type of Service, Type of Application, Type of Location, and Geographical Regions: Industry Trends and Global Forecasts |
||||||
석유 및 가스용 유동 확보 시장 개요
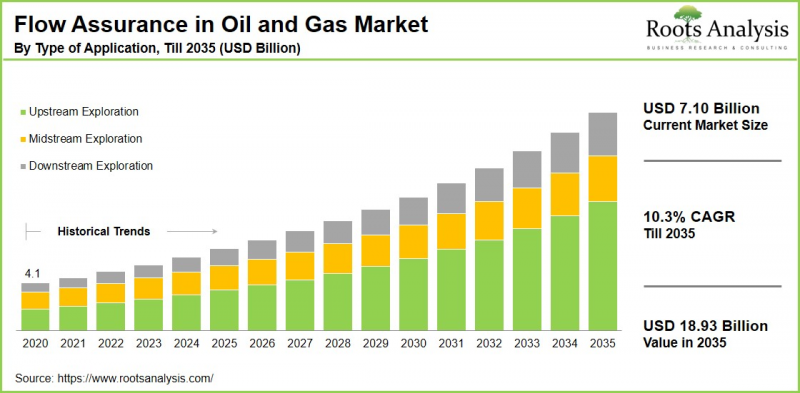
전 세계 석유 및 가스용 유동 확보 시장 규모는 현재 71억 달러에서 2035년까지 189억 3,000만 달러에 달할 것으로 예상되며, 2035년까지 예측 기간 동안 10.3%의 연평균 성장률을 보일 것으로 예상됩니다.
석유 및 가스용 유동 확보 시장 : 성장과 트렌드
석유 및 가스용 유동 확보는 파이프라인의 막힘을 방지하고 석유, 가스 및 관련 유체를 저장층에서 수송 파이프라인을 통해 생산 시설까지 원활하게 운송하는 것을 목적으로 하는 프로세스를 포함합니다. 이 프로세스에는 생산 및 보관 중 흐름을 방해할 수 있는 문제를 해결하고 완화하는 것이 포함됩니다. 유동 확보는 석유 및 가스 부문에서 단순히 기술적으로 필요한 것뿐만 아니라 경영 효율성과 경제적 지속가능성에 직접적인 영향을 미치는 중요한 요소입니다. 기업이 프로세스를 강화하고 유체 운송과 관련된 위험을 줄이기 위해 노력하는 가운데, 다양한 요인들이 유동 확보 서비스에 대한 세계 수요 증가에 기여하고 있습니다.
수화물 형성, 왁스 축적, 아스팔텐 침전, 스케일링 등의 문제를 해결해야 할 시급한 필요성이 석유 및 가스용 유동 확보의 중요성을 높이고 있습니다. 이러한 문제는 업스트림, 미드스티림, 다운스트림 각 작업에 걸친 유동 확보의 활용을 통해 해결할 수 있습니다. 또한, 이 분야의 주요 장애물 중 하나는 석유 및 가스 운송과 관련된 위험 관리입니다. 효율적인 흐름 보장 전략은 흐름의 중단으로 인해 경제적으로 큰 영향을 미칠 수 있는 잠재적인 중단을 줄이는 데 도움이 됩니다.
이러한 혼란은 단기적인 수익에 영향을 미칠 뿐만 아니라 고객 및 이해관계자와의 장기적인 관계에도 악영향을 미칠 수 있습니다. 따라서, 첨단 흐름 보증 솔루션에 대한 투자는 시시각각 변화하는 환경 속에서 경쟁력을 유지하고자 하는 기업에게 필수적입니다. 결과적으로, 상기 요인으로 인해 석유 및 가스용 유동 확보 시장은 예측 기간 동안 크게 성장할 것으로 예상됩니다.
세계의 석유 및 가스용 유동 확보 시장에 대해 조사했으며, 시장 규모 추정과 기회 분석, 경쟁 상황, 기업 프로파일 등의 정보를 전해드립니다.
목차
섹션 1 보고서 개요
제1장 서문
제2장 조사 방법
제3장 시장 역학
제4장 거시경제 지표
섹션 2 정성적 인사이트
제5장 주요 요약
제6장 소개
제7장 규제 시나리오
섹션 3 시장 개요
제8장 주요 기업의 종합적인 데이터베이스
제9장 경쟁 구도
제10장 화이트 스페이스 분석
제11장 기업의 경쟁력 분석
제12장 석유 및 가스용 유동 확보 시장 스타트업 생태계
섹션 4 기업 개요
제13장 기업 개요
- 분석 개요
- AMOG
- Baker Hughes Company
- Cargill
- ESSS
- Exxon Mobil
- GATE Energy
- Genesis
- Halliburton Energy Services
- Intertek
- METTLER TOLEDO
- Oceaneering International
- ROSEN Group
- SLB
- TEA Sistemi
- Veolia
- Wood PLC
섹션 5 시장 동향
제14장 메가트렌드 분석
제15장 미충족 수요 분석
제16장 특허 분석
제17장 최근의 발전
섹션 6 시장 기회 분석
제18장 세계의 석유 및 가스용 유동 확보 시장
제19장 시장 기회 : 제품 유형별
제20장 시장 기회 : 서비스 유형별
제21장 시장 기회 : 용도 유형별
제22장 시장 기회 : 장소 유형별
제23장 북미의 석유 및 가스용 유동 확보 시장 기회
제24장 유럽의 석유 및 가스용 유동 확보 시장 기회
제25장 아시아의 석유 및 가스용 유동 확보 시장 기회
제26장 중동 및 북아프리카(MENA)의 석유 및 가스용 유동 확보 시장 기회
제27장 라틴아메리카의 석유 및 가스용 유동 확보 시장 기회
제28장 인접 시장 분석
섹션 7 전략적 툴
제29장 중요한 승리 전략
제30장 Porter's Five Forces 분석
제31장 SWOT 분석
제32장 밸류체인 분석
제33장 Roots의 전략적 제안
섹션 8 기타 독점적 인사이트
제34장 1차 조사로부터의 인사이트
제35장 보고서 결론
섹션 9 부록
KSM 25.11.10Flow Assurance in Oil and Gas Market Overview
As per Roots Analysis, the global flow assurance in oil and gas market size is estimated to grow from USD 7.10 billion in the current year to USD 18.93 billion by 2035, at a CAGR of 10.3% during the forecast period, till 2035.

The opportunity for flow assurance in oil and gas market has been distributed across the following segments:
Type of Product
- Asphaltene Inhibitors
- Corrosion Inhibitors
- Demulsifiers
- Drag Reducing Agents
- Hydrate Inhibitors
- Paraffin / Wax Inhibitors
- Scale Inhibitors
Type of Service
- Chemical Injection Service
- Flow Assurance Consulting
- Flow Monitoring and Management
- Inspection and Maintenance
- Pipeline Design and Modeling
Type of Application
- Upstream Exploration
- Midstream Exploration
- Downstream Exploration
Type of Location
- Onshore
- Offshore
Geographical Regions
- North America
- US
- Canada
- Mexico
- Other North American countries
- Europe
- Austria
- Belgium
- Denmark
- France
- Germany
- Ireland
- Italy
- Netherlands
- Norway
- Russia
- Spain
- Sweden
- Switzerland
- UK
- Other European countries
- Asia
- China
- India
- Japan
- Singapore
- South Korea
- Other Asian countries
- Latin America
- Brazil
- Chile
- Colombia
- Venezuela
- Other Latin American countries
- Middle East and North Africa
- Egypt
- Iran
- Iraq
- Israel
- Kuwait
- Saudi Arabia
- UAE
- Other MENA countries
- Rest of the World
- Australia
- New Zealand
- Other countries
Flow Assurance in Oil and Gas Market: Growth and Trends
Flow assurance in the oil and gas sector involves a process aimed at preventing pipeline blockages and ensuring the smooth transport of oil, gas, and related fluids from a reservoir to production facilities through transportation pipelines. This process involves tackling and alleviating challenges that could impede flow during production and storage. Flow assurance is not just a technical necessity in the oil and gas sector; it is a crucial factor that directly influences operational efficiency and economic sustainability. Various elements contribute to the rising global demand for flow assurance services, as companies strive to enhance their processes and reduce risks linked to fluid transportation.
The pressing need to tackle issues such as hydrate formation, wax buildup, asphaltene precipitation, and scaling has heightened the importance of flow assurance within the oil and gas sector. These issues can be addressed through flow assurance applications across upstream, midstream, and downstream operations. Additionally, one of the main obstacles in this field is managing risks associated with the transportation of oil and gas. Efficient flow assurance strategies help reduce potential disruptions, which can have significant economic repercussions due to flow interruptions.
These disruptions can not only impact short-term revenue but also harm long-term relationships with clients and stakeholders. Therefore, investing in advanced flow assurance solutions is essential for companies seeking to remain competitive in an ever-changing environment. As a result, owing to the above mentioned factors, the flow assurance in oil and gas market is expected to grow significantly during the forecast period.
Flow Assurance in Oil and Gas Market: Key Segments
Market Share by Type of Product
Based on type of product, the global flow assurance in oil and gas market is segmented into asphaltene inhibitors, corrosion inhibitors, demulsifiers, drag-reducing agents, hydrate inhibitors, paraffin/wax inhibitors, and scale inhibitors. According to our estimates, currently, the hydrate inhibitors segment captures the majority of the market share. These inhibitors play a crucial role in preventing the formation of gas hydrates, which resemble ice structures that can obstruct pipelines and hinder operations. Additionally, the increasing demand for dependable and efficient solutions to sustain flow in difficult environments is bolstering the leadership of this segment.
However, the wax inhibitors segment is expected to grow at a relatively higher CAGR during the forecast period, owing to their extensive application in crude oil production.
Market Share by Type of Service
Based on type of service, the global flow assurance in oil and gas market is segmented into chemical injection service, flow assurance consulting, flow monitoring and management, inspection and maintenance, and pipeline design and modeling. According to our estimates, currently, the flow assurance segment captures the majority of the market share, due to its exceptional mechanical properties, versatility, and rising usage in the electronics sector.
However, the flow monitoring and management segment is expected to grow at a relatively higher CAGR during the forecast period. Flow assurance experts deploy cutting-edge technologies like sensors, predictive analytics, and automated control systems for real-time monitoring, data gathering, and flow assurance management. By utilizing these tools, service providers can maintain flow assurance parameters to avert and address flow complications, thereby enhancing the growth of the segment.
Market Share by Type of Application
Based on type of application, the global flow assurance in oil and gas market is segmented into upstream exploration, midstream exploration, and downstream exploration. According to our estimates, currently, the upstream application captures the majority of the market share. Ensuring effective upstream oil and gas flow assurance is critical to avoid problems such as asphaltene precipitation, wax deposition, and scaling that can lead to financial losses for companies.
Consequently, the importance of solutions aimed at addressing these challenges and maintaining continuous production while optimizing operational efficiency in demanding conditions makes it critical for flow assurance technologies in upstream applications.
However, the midstream segment is expected to grow at a relatively higher CAGR during the forecast period.
Market Share by Type of Location
Based on type of location, the global flow assurance in oil and gas market is segmented into onshore and offshore. According to our estimates, currently, the offshore segment captures the majority of the market share. This is due to the increasing exploration and production activities in deepwater and ultra-deepwater areas, where challenging flow issues such as hydrate formation, corrosion, and wax deposition are prevalent.
Additionally, the onshore segment is expected to grow at a relatively higher CAGR during the forecast period, driven by the expansion of extensive pipeline networks and the surge in unconventional onshore resources, such as shale oil and gas.
Market Share by Geographical Regions
Based on geographical regions, the flow assurance in oil and gas market is segmented into North America, Europe, Asia, Latin America, Middle East and North Africa, and the rest of the world. According to our estimates, currently North America captures the majority share of the market.
Meanwhile, Asia is expected to experience a higher compound annual growth rate (CAGR) during this forecast period. This can be attributed to the rapid demand for energy, driven by swift industrial growth and urban development in the region. Consequently, the high levels of oil and gas production require sophisticated flow assurance solutions to aid exploration and transportation.
Moreover, the expansion of extensive pipeline networks, refineries, and LNG facilities throughout Asia has increased the demand for flow assurance chemical inhibitors and services, as these inhibitors play a crucial role in preventing disruptions in the transport and processing of hydrocarbons.
Example Players in Flow Assurance in Oil and Gas Market
- AMOG
- Baker Hughes Company
- Cargil
- ESSS
- Exxon Mobil
- GATE Energy
- Genesis
- Hallibuton Energy Services
- Interteck
- METTLER TOLEDO
- Oceaneeering International
- ROSEN
- SLB
- TEASistemi
- Veolia
- Wood PLC
Flow Assurance in Oil and Gas Market: Research Coverage
The report on the flow assurance in oil and gas market features insights on various sections, including:
- Market Sizing and Opportunity Analysis: An in-depth analysis of the flow assurance in oil and gas market, focusing on key market segments, including [A] type of product, [B] type of service, [C] type of application, [D] type of location, and [E] geographical regions.
- Competitive Landscape: A comprehensive analysis of the companies engaged in the flow assurance in oil and gas market, based on several relevant parameters, such as [A] year of establishment, [B] company size, [C] location of headquarters and [D] ownership structure.
- Company Profiles: Elaborate profiles of prominent players engaged in the flow assurance in oil and gas market, providing details on [A] location of headquarters, [B] company size, [C] company mission, [D] company footprint, [E] management team, [F] contact details, [G] financial information, [H] operating business segments, [I] flow assurance in oil and gas portfolio, [J] moat analysis, [K] recent developments, and an informed future outlook.
- Megatrends: An evaluation of ongoing megatrends in the flow assurance in oil and gas industry.
- Patent Analysis: An insightful analysis of patents filed / granted in the flow assurance in oil and gas domain, based on relevant parameters, including [A] type of patent, [B] patent publication year, [C] patent age and [D] leading players.
- Recent Developments: An overview of the recent developments made in the flow assurance in oil and gas market, along with analysis based on relevant parameters, including [A] year of initiative, [B] type of initiative, [C] geographical distribution and [D] most active players.
- Porter's Five Forces Analysis: An analysis of five competitive forces prevailing in the flow assurance in oil and gas market, including threats of new entrants, bargaining power of buyers, bargaining power of suppliers, threats of substitute products and rivalry among existing competitors.
- SWOT Analysis: An insightful SWOT framework, highlighting the strengths, weaknesses, opportunities and threats in the domain. Additionally, it provides Harvey ball analysis, highlighting the relative impact of each SWOT parameter.
- Value Chain Analysis: A comprehensive analysis of the value chain, providing information on the different phases and stakeholders involved in the flow assurance in oil and gas market.
Key Questions Answered in this Report
- How many companies are currently engaged in flow assurance in oil and gas market?
- Which are the leading companies in this market?
- What factors are likely to influence the evolution of this market?
- What is the current and future market size?
- What is the CAGR of this market?
- How is the current and future market opportunity likely to be distributed across key market segments?
Reasons to Buy this Report
- The report provides a comprehensive market analysis, offering detailed revenue projections of the overall market and its specific sub-segments. This information is valuable to both established market leaders and emerging entrants.
- Stakeholders can leverage the report to gain a deeper understanding of the competitive dynamics within the market. By analyzing the competitive landscape, businesses can make informed decisions to optimize their market positioning and develop effective go-to-market strategies.
- The report offers stakeholders a comprehensive overview of the market, including key drivers, barriers, opportunities, and challenges. This information empowers stakeholders to stay abreast of market trends and make data-driven decisions to capitalize on growth prospects.
Additional Benefits
- Complimentary Excel Data Packs for all Analytical Modules in the Report
- 15% Free Content Customization
- Detailed Report Walkthrough Session with Research Team
- Free Updated report if the report is 6-12 months old or older
TABLE OF CONTENTS
SECTION I: REPORT OVERVIEW
1. PREFACE
- 1.1. Introduction
- 1.2. Market Share Insights
- 1.3. Key Market Insights
- 1.4. Report Coverage
- 1.5. Key Questions Answered
- 1.6. Chapter Outlines
2. RESEARCH METHODOLOGY
- 2.1. Chapter Overview
- 2.2. Research Assumptions
- 2.3. Database Building
- 2.3.1. Data Collection
- 2.3.2. Data Validation
- 2.3.3. Data Analysis
- 2.4. Project Methodology
- 2.4.1. Secondary Research
- 2.4.1.1. Annual Reports
- 2.4.1.2. Academic Research Papers
- 2.4.1.3. Company Websites
- 2.4.1.4. Investor Presentations
- 2.4.1.5. Regulatory Filings
- 2.4.1.6. White Papers
- 2.4.1.7. Industry Publications
- 2.4.1.8. Conferences and Seminars
- 2.4.1.9. Government Portals
- 2.4.1.10. Media and Press Releases
- 2.4.1.11. Newsletters
- 2.4.1.12. Industry Databases
- 2.4.1.13. Roots Proprietary Databases
- 2.4.1.14. Paid Databases and Sources
- 2.4.1.15. Social Media Portals
- 2.4.1.16. Other Secondary Sources
- 2.4.2. Primary Research
- 2.4.2.1. Introduction
- 2.4.2.2. Types
- 2.4.2.2.1. Qualitative
- 2.4.2.2.2. Quantitative
- 2.4.2.3. Advantages
- 2.4.2.4. Techniques
- 2.4.2.4.1. Interviews
- 2.4.2.4.2. Surveys
- 2.4.2.4.3. Focus Groups
- 2.4.2.4.4. Observational Research
- 2.4.2.4.5. Social Media Interactions
- 2.4.2.5. Stakeholders
- 2.4.2.5.1. Company Executives (CXOs)
- 2.4.2.5.2. Board of Directors
- 2.4.2.5.3. Company Presidents and Vice Presidents
- 2.4.2.5.4. Key Opinion Leaders
- 2.4.2.5.5. Research and Development Heads
- 2.4.2.5.6. Technical Experts
- 2.4.2.5.7. Subject Matter Experts
- 2.4.2.5.8. Scientists
- 2.4.2.5.9. Doctors and Other Healthcare Providers
- 2.4.2.6. Ethics and Integrity
- 2.4.2.6.1. Research Ethics
- 2.4.2.6.2. Data Integrity
- 2.4.3. Analytical Tools and Databases
- 2.4.1. Secondary Research
3. MARKET DYNAMICS
- 3.1. Forecast Methodology
- 3.1.1. Top-Down Approach
- 3.1.2. Bottom-Up Approach
- 3.1.3. Hybrid Approach
- 3.2. Market Assessment Framework
- 3.2.1. Total Addressable Market (TAM)
- 3.2.2. Serviceable Addressable Market (SAM)
- 3.2.3. Serviceable Obtainable Market (SOM)
- 3.2.4. Currently Acquired Market (CAM)
- 3.3. Forecasting Tools and Techniques
- 3.3.1. Qualitative Forecasting
- 3.3.2. Correlation
- 3.3.3. Regression
- 3.3.4. Time Series Analysis
- 3.3.5. Extrapolation
- 3.3.6. Convergence
- 3.3.7. Forecast Error Analysis
- 3.3.8. Data Visualization
- 3.3.9. Scenario Planning
- 3.3.10. Sensitivity Analysis
- 3.4. Key Considerations
- 3.4.1. Demographics
- 3.4.2. Market Access
- 3.4.3. Reimbursement Scenarios
- 3.4.4. Industry Consolidation
- 3.5. Robust Quality Control
- 3.6. Key Market Segmentations
- 3.7. Limitations
4. MACRO-ECONOMIC INDICATORS
- 4.1. Chapter Overview
- 4.2. Market Dynamics
- 4.2.1. Time Period
- 4.2.1.1. Historical Trends
- 4.2.1.2. Current and Forecasted Estimates
- 4.2.2. Currency Coverage
- 4.2.2.1. Overview of Major Currencies Affecting the Market
- 4.2.2.2. Impact of Currency Fluctuations on the Industry
- 4.2.3. Foreign Exchange Impact
- 4.2.3.1. Evaluation of Foreign Exchange Rates and Their Impact on Market
- 4.2.3.2. Strategies for Mitigating Foreign Exchange Risk
- 4.2.4. Recession
- 4.2.4.1. Historical Analysis of Past Recessions and Lessons Learnt
- 4.2.4.2. Assessment of Current Economic Conditions and Potential Impact on the Market
- 4.2.5. Inflation
- 4.2.5.1. Measurement and Analysis of Inflationary Pressures in the Economy
- 4.2.5.2. Potential Impact of Inflation on the Market Evolution
- 4.2.6. Interest Rates
- 4.2.6.1. Overview of Interest Rates and Their Impact on the Market
- 4.2.6.2. Strategies for Managing Interest Rate Risk
- 4.2.7. Commodity Flow Analysis
- 4.2.7.1. Type of Commodity
- 4.2.7.2. Origins and Destinations
- 4.2.7.3. Values and Weights
- 4.2.7.4. Modes of Transportation
- 4.2.8. Global Trade Dynamics
- 4.2.8.1. Import Scenario
- 4.2.8.2. Export Scenario
- 4.2.9. War Impact Analysis
- 4.2.9.1. Russian-Ukraine War
- 4.2.9.2. Israel-Hamas War
- 4.2.10. COVID Impact / Related Factors
- 4.2.10.1. Global Economic Impact
- 4.2.10.2. Industry-specific Impact
- 4.2.10.3. Government Response and Stimulus Measures
- 4.2.10.4. Future Outlook and Adaptation Strategies
- 4.2.11. Other Indicators
- 4.2.11.1. Fiscal Policy
- 4.2.11.2. Consumer Spending
- 4.2.11.3. Gross Domestic Product (GDP)
- 4.2.11.4. Employment
- 4.2.11.5. Taxes
- 4.2.11.6. R&D Innovation
- 4.2.11.7. Stock Market Performance
- 4.2.11.8. Supply Chain
- 4.2.11.9. Cross-Border Dynamics
- 4.2.1. Time Period
SECTION II: QUALITATIVE INSIGHTS
5. EXECUTIVE SUMMARY
6. INTRODUCTION
- 6.1. Chapter Overview
- 6.2. Overview of Flow Assurance in Oil and Gas Market
- 6.2.1. Type of Product
- 6.2.2. Type of Service
- 6.2.3. Type of Application
- 6.2.4. Type of Location
- 6.3. Future Perspective
7. REGULATORY SCENARIO
SECTION III: MARKET OVERVIEW
8. COMPREHENSIVE DATABASE OF LEADING PLAYERS
9. COMPETITIVE LANDSCAPE
- 9.1. Chapter Overview
- 9.2. Flow Assurance in Oil and Gas: Overall Market Landscape
- 9.2.1. Analysis by Year of Establishment
- 9.2.2. Analysis by Company Size
- 9.2.3. Analysis by Location of Headquarters
- 9.2.4. Analysis by Ownership Structure
10. WHITE SPACE ANALYSIS
11. COMAPNY COMPETITIVENESS ANALYSIS
12. STARTUP ECOSYSTEM IN THE FLOW ASSURANCE IN OIL AND GAS MARKET
- 12.1. Flow Assurance in Oil and Gas: Market Landscape of Startups
- 12.1.1. Analysis by Year of Establishment
- 12.1.2. Analysis by Company Size
- 12.1.3. Analysis by Company Size and Year of Establishment
- 12.1.4. Analysis by Location of Headquarters
- 12.1.5. Analysis by Company Size and Location of Headquarters
- 12.1.6. Analysis by Ownership Structure
- 12.2. Key Findings
SECTION IV: COMPANY PROFILES
13. COMPANY PROFILES
- 13.1. Chapter Overview
- 13.2. AMOG *
- 13.2.1. Company Overview
- 13.2.2. Company Mission
- 13.2.3. Company Footprint
- 13.2.4. Management Team
- 13.2.5. Contact Details
- 13.2.6. Financial Performance
- 13.2.7. Operating Business Segments
- 13.2.8. Service / Product Portfolio (project specific)
- 13.2.9. MOAT Analysis
- 13.2.10. Recent Developments and Future Outlook
- 13.3. Baker Hughes Company
- 13.4. Cargill
- 13.5. ESSS
- 13.6. Exxon Mobil
- 13.7. GATE Energy
- 13.8. Genesis
- 13.9. Halliburton Energy Services
- 13.10. Intertek
- 13.11. METTLER TOLEDO
- 13.12. Oceaneering International
- 13.13. ROSEN Group
- 13.14. SLB
- 13.15. TEA Sistemi
- 13.16. Veolia
- 13.17. Wood PLC
SECTION V: MARKET TRENDS
14. MEGA TRENDS ANALYSIS
15. UNMET NEED ANALYSIS
16. PATENT ANALYSIS
17. RECENT DEVELOPMENTS
- 17.1. Chapter Overview
- 17.2. Recent Funding
- 17.3. Recent Partnerships
- 17.4. Other Recent Initiatives
SECTION VI: MARKET OPPORTUNITY ANALYSIS
18. GLOBAL FLOW ASSURANCE IN OIL AND GAS MARKET
- 18.1. Chapter Overview
- 18.2. Key Assumptions and Methodology
- 18.3. Trends Disruption Impacting Market
- 18.4. Demand Side Trends
- 18.5. Supply Side Trends
- 18.6. Global Flow Assurance in Oil and Gas Market, Historical Trends (Since 2020) and Forecasted Estimates (Till 2035)
- 18.7. Multivariate Scenario Analysis
- 18.7.1. Conservative Scenario
- 18.7.2. Optimistic Scenario
- 18.8. Investment Feasibility Index
- 18.9. Key Market Segmentations
19. MARKET OPPORTUNITIES BASED ON TYPE OF PRODUCT
- 19.1. Chapter Overview
- 19.2. Key Assumptions and Methodology
- 19.3. Revenue Shift Analysis
- 19.4. Market Movement Analysis
- 19.5. Penetration-Growth (P-G) Matrix
- 19.6. Flow Assurance in Oil and Gas Market for Asphaltene Inhibitors: Historical Trends (Since 2020) and Forecasted Estimates (Till 2035)
- 19.7. Flow Assurance in Oil and Gas Market for Corrosion Inhibitors: Historical Trends (Since 2020) and Forecasted Estimates (Till 2035)
- 19.8. Flow Assurance in Oil and Gas Market for Municipal Demulsifiers: Historical Trends (Since 2020) and Forecasted Estimates (Till 2035)
- 19.9. Flow Assurance in Oil and Gas Market for Municipal Drag Reducing Agents: Historical Trends (Since 2020) and Forecasted Estimates (Till 2035)
- 19.10. Flow Assurance in Oil and Gas Market for Municipal Hydrate Inhibitors: Historical Trends (Since 2020) and Forecasted Estimates (Till 2035)
- 19.11. Flow Assurance in Oil and Gas Market for Municipal Paraffin / Wax Inhibitors: Historical Trends (Since 2020) and Forecasted Estimates (Till 2035)
- 19.12. Flow Assurance in Oil and Gas Market for Municipal Scale Inhibitors: Historical Trends (Since 2020) and Forecasted Estimates (Till 2035)
- 19.13. Data Triangulation and Validation
- 19.13.1. Secondary Sources
- 19.13.2. Primary Sources
- 19.13.3. Statistical Modeling
20. MARKET OPPORTUNITIES BASED ON TYPE OF SERVICE
- 20.1. Chapter Overview
- 20.2. Key Assumptions and Methodology
- 20.3. Revenue Shift Analysis
- 20.4. Market Movement Analysis
- 20.5. Penetration-Growth (P-G) Matrix
- 20.6. Flow Assurance in Oil and Gas Market for Chemical Injection Service: Historical Trends (Since 2020) and Forecasted Estimates (Till 2035)
- 20.7. Flow Assurance in Oil and Gas Market for Flow Assurance Consulting: Historical Trends (Since 2020) and Forecasted Estimates (Till 2035)
- 20.8. Flow Assurance in Oil and Gas Market for Flow Monitoring and Management: Historical Trends (Since 2020) and Forecasted Estimates (Till 2035)
- 20.9. Flow Assurance in Oil and Gas Market for Inspection and Maintenance: Historical Trends (Since 2020) and Forecasted Estimates (Till 2035)
- 20.10. Flow Assurance in Oil and Gas Market for Pipeline Design and Modeling: Historical Trends (Since 2020) and Forecasted Estimates (Till 2035)
- 20.11. Data Triangulation and Validation
- 20.11.1. Secondary Sources
- 20.11.2. Primary Sources
- 20.11.3. Statistical Modeling
21. MARKET OPPORTUNITIES BASED ON TYPE OF APPLICATION
- 21.1. Chapter Overview
- 21.2. Key Assumptions and Methodology
- 21.3. Revenue Shift Analysis
- 21.4. Market Movement Analysis
- 21.5. Penetration-Growth (P-G) Matrix
- 21.6. Flow Assurance in Oil and Gas Market for Upstream Exploration: Historical Trends (Since 2020) and Forecasted Estimates (Till 2035)
- 21.7. Flow Assurance in Oil and Gas Market for Midstream Exploration: Historical Trends (Since 2020) and Forecasted Estimates (Till 2035)
- 21.8. Flow Assurance in Oil and Gas Market for Downstream Exploration: Historical Trends (Since 2020) and Forecasted Estimates (Till 2035)
- 21.9. Data Triangulation and Validation
- 21.9.1. Secondary Sources
- 21.9.2. Primary Sources
- 21.9.3. Statistical Modeling
22. MARKET OPPORTUNITIES BASED ON TYPE OF LOCATION
- 22.1. Chapter Overview
- 22.2. Key Assumptions and Methodology
- 22.3. Revenue Shift Analysis
- 22.4. Market Movement Analysis
- 22.5. Penetration-Growth (P-G) Matrix
- 22.6. Flow Assurance in Oil and Gas Market for Onshore: Historical Trends (Since 2020) and Forecasted Estimates (Till 2035)
- 22.7. Flow Assurance in Oil and Gas Market for Offshore: Historical Trends (Since 2020) and Forecasted Estimates (Till 2035)
- 22.8. Data Triangulation and Validation
- 22.8.1. Secondary Sources
- 22.8.2. Primary Sources
- 22.8.3. Statistical Modeling
23. MARKET OPPORTUNITIES FOR FLOW ASSURANCE IN OIL AND GAS IN NORTH AMERICA
- 23.1. Chapter Overview
- 23.2. Key Assumptions and Methodology
- 23.3. Revenue Shift Analysis
- 23.4. Market Movement Analysis
- 23.5. Penetration-Growth (P-G) Matrix
- 23.6. Flow Assurance in Oil and Gas Market in North America: Historical Trends (Since 2020) and Forecasted Estimates (Till 2035)
- 23.6.1. Flow Assurance in Oil and Gas Market in the US: Historical Trends (Since 2020) and Forecasted Estimates (Till 2035)
- 23.6.2. Flow Assurance in Oil and Gas Market in Canada: Historical Trends (Since 2020) and Forecasted Estimates (Till 2035)
- 23.6.3. Flow Assurance in Oil and Gas Market in Mexico: Historical Trends (Since 2020) and Forecasted Estimates (Till 2035)
- 23.6.4. Flow Assurance in Oil and Gas Market in Other North American Countries: Historical Trends (Since 2020) and Forecasted Estimates (Till 2035)
- 23.7. Data Triangulation and Validation
24. MARKET OPPORTUNITIES FOR FLOW ASSURANCE IN OIL AND GAS IN EUROPE
- 24.1. Chapter Overview
- 24.2. Key Assumptions and Methodology
- 24.3. Revenue Shift Analysis
- 24.4. Market Movement Analysis
- 24.5. Penetration-Growth (P-G) Matrix
- 24.6. Flow Assurance in Oil and Gas Market in Europe: Historical Trends (Since 2020) and Forecasted Estimates (Till 2035)
- 24.6.1. Flow Assurance in Oil and Gas Market in Austria: Historical Trends (Since 2020) and Forecasted Estimates (Till 2035)
- 24.6.2. Flow Assurance in Oil and Gas Market in Belgium: Historical Trends (Since 2020) and Forecasted Estimates (Till 2035)
- 24.6.3. Flow Assurance in Oil and Gas Market in Denmark: Historical Trends (Since 2020) and Forecasted Estimates (Till 2035)
- 24.6.4. Flow Assurance in Oil and Gas Market in France: Historical Trends (Since 2020) and Forecasted Estimates (Till 2035)
- 24.6.5. Flow Assurance in Oil and Gas Market in Germany: Historical Trends (Since 2020) and Forecasted Estimates (Till 2035)
- 24.6.6. Flow Assurance in Oil and Gas Market in Ireland: Historical Trends (Since 2020) and Forecasted Estimates (Till 2035)
- 24.6.7. Flow Assurance in Oil and Gas Market in Italy: Historical Trends (Since 2020) and Forecasted Estimates (Till 2035)
- 24.6.8. Flow Assurance in Oil and Gas Market in Netherlands: Historical Trends (Since 2020) and Forecasted Estimates (Till 2035)
- 24.6.9. Flow Assurance in Oil and Gas Market in Norway: Historical Trends (Since 2020) and Forecasted Estimates (Till 2035)
- 24.6.10. Flow Assurance in Oil and Gas Market in Russia: Historical Trends (Since 2020) and Forecasted Estimates (Till 2035)
- 24.6.11. Flow Assurance in Oil and Gas Market in Spain: Historical Trends (Since 2020) and Forecasted Estimates (Till 2035)
- 24.6.12. Flow Assurance in Oil and Gas Market in Sweden: Historical Trends (Since 2020) and Forecasted Estimates (Till 2035)
- 24.6.13. Flow Assurance in Oil and Gas Market in Switzerland: Historical Trends (Since 2020) and Forecasted Estimates (Till 2035)
- 24.6.14. Flow Assurance in Oil and Gas Market in the UK: Historical Trends (Since 2020) and Forecasted Estimates (Till 2035)
- 24.6.15. Flow Assurance in Oil and Gas Market in Other European Countries: Historical Trends (Since 2020) and Forecasted Estimates (Till 2035)
- 24.7. Data Triangulation and Validation
25. MARKET OPPORTUNITIES FOR FLOW ASSURANCE IN OIL AND GAS IN ASIA
- 25.1. Chapter Overview
- 25.2. Key Assumptions and Methodology
- 25.3. Revenue Shift Analysis
- 25.4. Market Movement Analysis
- 25.5. Penetration-Growth (P-G) Matrix
- 25.6. Flow Assurance in Oil and Gas Market in Asia: Historical Trends (Since 2020) and Forecasted Estimates (Till 2035)
- 25.6.1. Flow Assurance in Oil and Gas Market in China: Historical Trends (Since 2020) and Forecasted Estimates (Till 2035)
- 25.6.2. Flow Assurance in Oil and Gas Market in India: Historical Trends (Since 2020) and Forecasted Estimates (Till 2035)
- 25.6.3. Flow Assurance in Oil and Gas Market in Japan: Historical Trends (Since 2020) and Forecasted Estimates (Till 2035)
- 25.6.4. Flow Assurance in Oil and Gas Market in Singapore: Historical Trends (Since 2020) and Forecasted Estimates (Till 2035)
- 25.6.5. Flow Assurance in Oil and Gas Market in South Korea: Historical Trends (Since 2020) and Forecasted Estimates (Till 2035)
- 25.6.6. Flow Assurance in Oil and Gas Market in Other Asian Countries: Historical Trends (Since 2020) and Forecasted Estimates (Till 2035)
- 25.7. Data Triangulation and Validation
26. MARKET OPPORTUNITIES FOR FLOW ASSURANCE IN OIL AND GAS IN MIDDLE EAST AND NORTH AFRICA (MENA)
- 26.1. Chapter Overview
- 26.2. Key Assumptions and Methodology
- 26.3. Revenue Shift Analysis
- 26.4. Market Movement Analysis
- 26.5. Penetration-Growth (P-G) Matrix
- 26.6. Flow Assurance in Oil and Gas Market in Middle East and North Africa (MENA): Historical Trends (Since 2020) and Forecasted Estimates (Till 2035)
- 26.6.1. Flow Assurance in Oil and Gas Market in Egypt: Historical Trends (Since 2020) and Forecasted Estimates (Till 205)
- 26.6.2. Flow Assurance in Oil and Gas Market in Iran: Historical Trends (Since 2020) and Forecasted Estimates (Till 2035)
- 26.6.3. Flow Assurance in Oil and Gas Market in Iraq: Historical Trends (Since 2020) and Forecasted Estimates (Till 2035)
- 26.6.4. Flow Assurance in Oil and Gas Market in Israel: Historical Trends (Since 2020) and Forecasted Estimates (Till 2035)
- 26.6.5. Flow Assurance in Oil and Gas Market in Kuwait: Historical Trends (Since 2020) and Forecasted Estimates (Till 2035)
- 26.6.6. Flow Assurance in Oil and Gas Market in Saudi Arabia: Historical Trends (Since 2020) and Forecasted Estimates (Till 2035)
- 26.6.7. Neuromorphic Computing Marke in United Arab Emirates (UAE): Historical Trends (Since 2020) and Forecasted Estimates (Till 2035)
- 26.6.8. Flow Assurance in Oil and Gas Market in Other MENA Countries: Historical Trends (Since 2020) and Forecasted Estimates (Till 2035)
- 26.7. Data Triangulation and Validation
27. MARKET OPPORTUNITIES FOR FLOW ASSURANCE IN OIL AND GAS IN LATIN AMERICA
- 27.1. Chapter Overview
- 27.2. Key Assumptions and Methodology
- 27.3. Revenue Shift Analysis
- 27.4. Market Movement Analysis
- 27.5. Penetration-Growth (P-G) Matrix
- 27.6. Flow Assurance in Oil and Gas Market in Latin America: Historical Trends (Since 2020) and Forecasted Estimates (Till 2035)
- 27.6.1. Flow Assurance in Oil and Gas Market in Argentina: Historical Trends (Since 2020) and Forecasted Estimates (Till 2035)
- 27.6.2. Flow Assurance in Oil and Gas Market in Brazil: Historical Trends (Since 2020) and Forecasted Estimates (Till 2035)
- 27.6.3. Flow Assurance in Oil and Gas Market in Chile: Historical Trends (Since 2020) and Forecasted Estimates (Till 2035)
- 27.6.4. Flow Assurance in Oil and Gas Market in Colombia Historical Trends (Since 2020) and Forecasted Estimates (Till 2035)
- 27.6.5. Flow Assurance in Oil and Gas Market in Venezuela: Historical Trends (Since 2020) and Forecasted Estimates (Till 2035)
- 27.6.6. Flow Assurance in Oil and Gas Market in Other Latin American Countries: Historical Trends (Since 2020) and Forecasted Estimates (Till 2035)
- 27.7. Data Triangulation and Validation
