|
시장보고서
상품코드
1857194
스마트 조명 시장 : 업계 동향과 세계 예측(-2035년) - 컴포넌트 유형별, 접속 유형별, 조명 유형별, 조명 기술 유형별, 설치 유형별, 용도별, 판매 채널, 주요 지역별Smart Lighting Market, Till 2035: Distribution by Type of Component, Type of Connectivity, Lighting, Lighting Technology, Installation, Type of Application, Type of Sales Channel, Key Geographical Regions: Industry Trends and Global Forecasts |
||||||
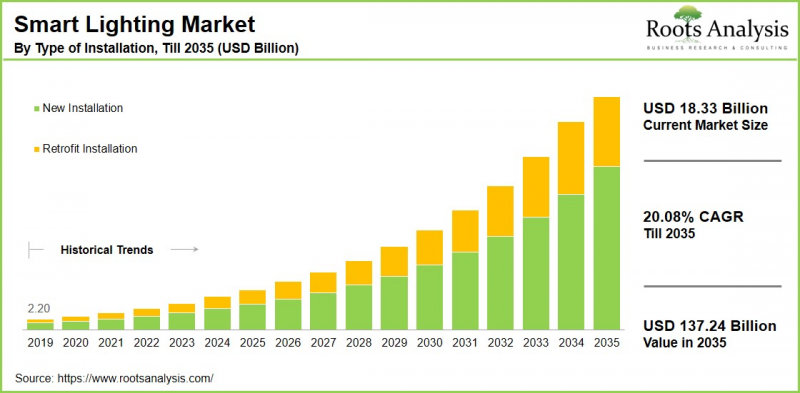
세계의 스마트 조명 시장 규모는 2035년까지의 예측 기간 중 20.08%의 CAGR로 확대하며, 현재 183억 3,000만 달러에서 2035년에는 1,372억 4,000만 달러로 성장할 것으로 예측됩니다.

스마트 조명 시장의 기회는 다음과 같은 부문에 분포되어 있습니다.
컴포넌트 유형
- 하드웨어
- 조명기구
- 조명 제어
- 조광기 및 스위치
- 게이트웨이
- 인감 센서 라이트
- 허브 연결 스마트 라이트
- 소프트웨어
- 클라우드 기반
- On-Premise
- 서비스
- 컨설팅
- 디자인 & 엔지니어링
- 설치 방법
- 유지보수
연결 유형
- 하이브리드
- 유선
- 디지털 어드레서블 라이팅 인터페이스(DALI)
- 전력선 제어(PLC)
- PoE(Power over Ethernet)
- 무선
- Bluetooth
- EnOcean
- Wi-Fi
- ZigBee
- 6LoWPAN
조명 유형
- 조명기구
- 조명 제어
- 스마트 전구
조명 기술 유형
- CFL
- 형광등
- 할로겐
- 백열등
- LED
설치 유형
- 신규
- 후가공
용도
- 실내
- 상업용
- 산업용
- 주택
- 아웃도어
- 건축물
- 고속도로
- 공공조명
- 스타디움
판매 채널
- 직접
- 간접판매
지역
- 북미
- 미국
- 캐나다
- 멕시코
- 기타 북미 국가
- 유럽
- 오스트리아
- 벨기에
- 덴마크
- 프랑스
- 독일
- 아일랜드
- 이탈리아
- 네덜란드
- 노르웨이
- 러시아
- 스페인
- 스웨덴
- 스위스
- 영국
- 기타 유럽 국가
- 아시아
- 중국
- 인도
- 일본
- 싱가포르
- 한국
- 기타 아시아 국가
- 라틴아메리카
- 브라질
- 칠레
- 콜롬비아
- 베네수엘라
- 기타 라틴아메리카 국가
- 중동 및 북아프리카
- 이집트
- 이란
- 이라크
- 이스라엘
- 쿠웨이트
- 사우디아라비아
- 아랍에미리트
- 기타 MENA 국가
- 세계 기타 지역
- 호주
- 뉴질랜드
- 기타 국가
스마트 조명 시장 성장 및 동향
스마트 조명은 홈자동화과 에너지 효율 분야의 새로운 동향입니다. 커넥티드 디바이스의 확산과 지속가능한 삶에 대한 요구가 증가함에 따라 스마트 조명은 생활 환경을 밝히는 방식을 변화시키고 있습니다. 기존 조명과 달리 스마트 조명은 음성 비서, 센서, 센서, 모바일 기기, 네트워크 접속 등 다양한 첨단 기술과 인터페이스를 사용하여 관리하거나 자동화할 수 있습니다.
스마트 조명의 장점은 맞춤형, 원격 관리, 적응형 조명, 에너지 절약, 보안 강화, 안전성 향상 등이 있습니다. 이러한 장점으로 인해 주거, 직장, 상업시설, 야외 공간 등 다양한 환경에서 편리함과 효율성을 모두 제공하는 매력적인 선택이 되고 있습니다.
지속가능성 측면에서 스마트 조명은 국가 발전과 환경에 미치는 영향에 있으며, 필수적인 요소로 인식되고 있습니다. 상업 및 산업 부문에 스마트 조명을 도입함으로써 경제와 환경을 모두 개선할 수 있습니다. 유엔액트나우의 정보에 따르면 에너지 공급 산업은 전 세계 온실가스 배출량의 35%를 차지합니다. 그럼에도 불구하고 에너지 소비가 환경에 미치는 영향에 대한 인식을 높이기 위한 지속적인 노력은 전 세계 온실가스 배출률 둔화에 기여하고 있으며, 스마트 조명은 이러한 발전에 중요한 역할을 하고 있습니다.
자동화, AI, IoT 기술을 활용하여 이해관계자들은 원격 제어, 음성 작동, 에너지 효율이 높은 기능을 갖춘 첨단 스마트 조명 솔루션을 제공합니다. 스마트 조명의 이러한 특성은 주택 소유자가 탁월한 제어와 유연성으로 조명 선호도를 관리할 수 있는 능력을 크게 향상시킵니다. 위와 같은 요인으로 인해 스마트 조명 시장은 예측 기간 중 크게 성장할 것으로 예측됩니다.
목차
제1장 서문
제2장 조사 방법
제3장 경제적 및 기타 프로젝트 특유 고려 사항
제4장 거시경제 지표
제5장 개요
제6장 서론
제7장 경쟁 구도
제8장 기업 개요
- 챕터 개요
- Acuity Brands
- Cisco Systems
- Deco Lighting
- Dialight
- Eaton
- General Electric
- Honeywell International
- Hubbell Incorporated
- LIFX
- Philips Lighting
제9장 밸류체인 분석
제10장 SWOT 분석
제11장 세계의 스마트 조명 시장
제12장 컴포넌트 유형별 시장 기회
제13장 접속 유형별 시장 기회
제14장 조명 유형별 시장 기회
제15장 조명 기술 유형별 시장 기회
제16장 설치 유형별 시장 기회
제17장 용도별 시장 기회
제18장 판매 채널별 시장 기회
제19장 북미에서 스마트 조명의 시장 기회
제20장 유럽에서 스마트 조명의 시장 기회
제21장 아시아에서 스마트 조명의 시장 기회
제22장 중동·북아프리카(MENA)에서 스마트 조명의 시장 기회
제23장 라틴아메리카에서 스마트 조명의 시장 기회
제24장 기타 지역에서 스마트 조명의 시장 기회
제25장 표형식 데이터
제26장 기업·단체 리스트
제27장 커스터마이즈 기회
제28장 ROOT 서브스크립션 서비스
제29장 저자 상세
KSA 25.11.13Smart Lighting Market Overview
As per Roots Analysis, the global smart lighting market size is estimated to grow from USD 18.33 billion in the current year to USD 137.24 billion by 2035, at a CAGR of 20.08% during the forecast period, till 2035.
The opportunity for smart lighting market has been distributed across the following segments:
Type of Component
- Hardware
- Lights & Luminaires
- Light Control
- Dimmers & Switches
- Gateways
- Motion Sensing Lights
- Smart Lights Connected with Hubs
- Software
- Cloud-Based
- On-Premise
- Service
- Consulting
- Design & Engineering
- Installation
- Maintenance
Type of Capability
- Hybrid
- Wired
- Digital Addressable Lighting Interface (DALI)
- Power Line Control (PLC)
- Power Over Ethernet (PoE)
- Wireless
- Bluetooth
- EnOcean
- Wi-Fi
- ZigBee
- 6LoWPAN
Type of Lighting
- Fixtures
- Lighting Controls
- Smart Bulbs
Type of Lighting Technology
- CFL
- Fluorescent
- Halogen
- Incandescent
- LED
Type of Installation
- New Installation
- Retrofit Installation
Type of Application
- Indoor
- Commercial
- Industrial
- Residential
- Outdoor
- Architectural
- Highways & Roadways
- Lighting for Public Places
- Stadium
Type of Sales Channel
- Direct
- Indirect
Geographical Regions
- North America
- US
- Canada
- Mexico
- Other North American countries
- Europe
- Austria
- Belgium
- Denmark
- France
- Germany
- Ireland
- Italy
- Netherlands
- Norway
- Russia
- Spain
- Sweden
- Switzerland
- UK
- Other European countries
- Asia
- China
- India
- Japan
- Singapore
- South Korea
- Other Asian countries
- Latin America
- Brazil
- Chile
- Colombia
- Venezuela
- Other Latin American countries
- Middle East and North Africa
- Egypt
- Iran
- Iraq
- Israel
- Kuwait
- Saudi Arabia
- UAE
- Other MENA countries
- Rest of the World
- Australia
- New Zealand
- Other countries
Smart Lighting Market: Growth and Trends
Smart lighting represents a new trend in the realm of home automation and energy efficiency. As connected devices become more prevalent and the demand for sustainable living increases, smart lighting is poised to transform how we illuminate our living environments. In contrast to conventional lighting, smart lights can be managed or automated using various sophisticated technologies and interfaces, including voice assistants, sensors, mobile devices, and network connections.
The benefits of smart lighting include customization, remote management, adaptive illumination, energy savings, enhanced security, and improved safety. These benefits make it an attractive option for a range of settings, such as residences, workplaces, commercial properties, and outdoor spaces, offering both convenience and efficiency.
Regarding sustainability, smart lighting is increasingly recognized as a vital component in the development of nations and their environmental impact. Implementing smart lighting in commercial and industrial sectors has the potential to enhance both the economy and the environment. According to information from the United Nations Act Now, the energy supply industry is responsible for 35% of global greenhouse gas emissions. Nevertheless, ongoing efforts to raise awareness about the environmental effects of energy consumption have contributed to a slowdown in the global rate of greenhouse gas emissions, with smart lighting playing a significant role in this progress.
By utilizing automation, AI, and IoT technologies, stakeholders are providing advanced smart lighting solutions that feature remote control, voice activation, and energy-efficient functionalities. These characteristics of smart lighting greatly enhance homeowners' ability to manage their lighting preferences with unparalleled control and flexibility. As a result of the above mentioned factors, the smart lighting market is expected to grow significantly throughout the forecast period.
Smart Lighting Market: Key Segments
Market Share by Type of Component
Based on type of component, the global smart lighting market is segmented into hardware, software, and services. According to our estimates, currently, the hardware components, particularly lights and luminaires, captures the majority of the market share. This can be attributed to the increasing demand and sales for smart bulbs and IoT-connected lighting devices.
However, the software segment is expected to grow at a higher CAGR during the forecast period, due to the rising adoption of IoT technologies integrated with smart lighting has led to higher software demand, which is crucial for controlling smart lights via devices like smartphones and tablets. Additionally, the capability of smart lights to connect with platforms such as Alexa, Google, Siri, and others enhances the growth of this segment by providing voice control features through these systems.
Market Share by Type of Connectivity
Based on type of connectivity, the global smart lighting market is segmented into hybrid, wired, and wireless. According to our estimates, currently, the wired segment captures the majority of the market share during the forecast period. This can be ascribed to the increasing implementation of smart lighting in both commercial and industrial sectors. Additionally, it is widely utilized across various sectors such as office buildings, shopping centers, and educational facilities where reliable and controlled lighting systems are crucial.
On the other hand, the wireless segment, which includes Bluetooth, EnOcean, Wi-Fi, ZigBee, and 6lowpan, is expected to grow at a higher CAGR during the forecast period. This is due to the rising demand for wireless connectivity, which is propelled by its high data transmission rates and capability to connect directly to home networks without the need for extra hubs or gateways.
Moreover, Bluetooth connectivity provides user-friendly direct control via smartphones and tablets without requiring an internet connection, significantly boosting the growth of this segment.
Market Share by Type of Lighting
Based on type of lighting, the global smart lighting market is segmented into fixtures, lighting controls, and smart bulbs. According to our estimates, currently, the smart bulbs segment captures the majority of the market share. Smart bulbs are favored by consumers due to their affordability, user-friendly nature, and broad compatibility, which significantly contributes to the growth of this segment. Additionally, the lower upfront costs and straightforward installation further enhance the demand for smart bulbs, driving market expansion.
On the other hand, the fixtures segment is expected to grow at a higher CAGR during the forecast period. This can be attributed to the rise in new construction within both the residential and commercial sectors, which often require comprehensive lighting solutions where smart fixtures, integrated with smart bulbs and controls, are essential.
Market Share by Type of Lighting Technology
Based on type of lighting technology, the global smart lighting market is segmented into CFL, fluorescent, halogen, incandescent, and LED. According to our estimates, currently, the Light Light-emitting diode (LED) segment captures the majority of the market share. This can be attributed to the advantages of LED, such as cost savings, compatibility with smart technology and energy efficiency.
On the other hand, the incandescent lighting segment is expected to grow at a higher CAGR during the forecast period. Incandescent lighting, one of the earliest forms of electric lighting, continues to be in demand due to its simplicity and compatibility for replacement with existing fixtures, which does not require special controls or devices.
Market Share by Type of Installation
Based on type of installation, the global smart lighting market is segmented into new installation and retrofit installation. According to our estimates, currently, the new installation segment captures the majority of the market share and this trend is unlikely to change in future. This can be attributed to the increased uptake of smart lighting in new buildings, where such systems can be easily integrated into initial construction plans, allowing for optimal wiring and placement.
On the other hand, the retrofit segment is expected to grow at a higher CAGR during the forecast period, driven by the rising consumer interest in SMART LIGHTING technologies aimed at enhancing living spaces with minimal disturbances.
Market Share by Type of Application
Based on type of application, the global smart lighting market is segmented into indoor (commercial, industrial and residential) and outdoor (architectural, highways & roadways, lighting for public places and stadiums). According to our estimates, currently, the indoor segment captures the majority of the market share, due to the rapid urbanization occurring globally. This is especially true in developing nations, which are increasingly incorporating smart lighting systems into their new infrastructure projects, including buildings, schools, hospitals, and more.
On the other hand, the outdoor segment is expected to grow at a higher CAGR during the forecast period. This can be attributed to the rise of smart city initiatives, along with the development of highways and roadways across the globe.
Market Share by Type of Sale Channels
Based on type of sale channels, the global smart lighting market is segmented into direct sales and indirect sales. According to our estimates, currently, the indirect sales channel captures the majority of the market share, due to the rapid urbanization occurring globally. This can be attributed to the collaborations with e-commerce platforms, retailers, and distributors, which have enhanced the availability of smart lighting products. These channels offer extensive consumer reach and logistical support, creating more opportunities for manufacturers in the smart lighting sector.
Market Share by Geographical Regions
Based on geographical regions, the smart lighting market is segmented into North America, Europe, Asia, Latin America, Middle East and North Africa, and the rest of the world. According to our estimates, currently, Europe captures the majority share of the market, due to the widespread adoption of smart lighting technology and a strong focus on energy efficiency and sustainability. However, the market in Asia Pacific is expected to grow at relatively higher CAGR during the forecast period.
Example Players in Smart Lighting Market
- Acuity Brands
- Cisco Systems
- Cree
- Deco Lighting
- Dialight
- Eaton
- General Electric
- Honeywell International
- Hubbell Incorporated
- Koninklijke Philips
- LIFX
- Lutron Electronics
- Osram Licht
- Philips Lighting
- Samsung Electronics
- Syska
Smart Lighting Market: Research Coverage
The report on the smart lighting market features insights on various sections, including:
- Market Sizing and Opportunity Analysis: An in-depth analysis of the smart lighting market, focusing on key market segments, including [A] type of component, [B] type of connectivity, [C] type of lighting, [D] type of lighting technology, [E] type of installation, [F] type of application, [G] type of sales channel and [H] key geographical regions.
- Competitive Landscape: A comprehensive analysis of the companies engaged in the smart lighting market, based on several relevant parameters, such as [A] year of establishment, [B] company size, [C] location of headquarters and [D] ownership structure.
- Company Profiles: Elaborate profiles of prominent players engaged in the smart lighting market, providing details on [A] location of headquarters, [B] company size, [C] company mission, [D] company footprint, [E] management team, [F] contact details, [G] financial information, [H] operating business segments, [I] smart lighting portfolio, [J] moat analysis, [K] recent developments, and an informed future outlook.
- SWOT Analysis: An insightful SWOT framework, highlighting the strengths, weaknesses, opportunities and threats in the domain. Additionally, it provides Harvey ball analysis, highlighting the relative impact of each SWOT parameter.
- Value Chain Analysis: A comprehensive analysis of the value chain, providing information on the different phases and stakeholders involved in the smart lighting market
Key Questions Answered in this Report
- How many companies are currently engaged in smart lighting market?
- Which are the leading companies in this market?
- What factors are likely to influence the evolution of this market?
- What is the current and future market size?
- What is the CAGR of this market?
- How is the current and future market opportunity likely to be distributed across key market segments?
Reasons to Buy this Report
- The report provides a comprehensive market analysis, offering detailed revenue projections of the overall market and its specific sub-segments. This information is valuable to both established market leaders and emerging entrants.
- Stakeholders can leverage the report to gain a deeper understanding of the competitive dynamics within the market. By analyzing the competitive landscape, businesses can make informed decisions to optimize their market positioning and develop effective go-to-market strategies.
- The report offers stakeholders a comprehensive overview of the market, including key drivers, barriers, opportunities, and challenges. This information empowers stakeholders to stay abreast of market trends and make data-driven decisions to capitalize on growth prospects.
Additional Benefits
- Complimentary Excel Data Packs for all Analytical Modules in the Report
- 15% Free Content Customization
- Detailed Report Walkthrough Session with Research Team
- Free Updated report if the report is 6-12 months old or older
TABLE OF CONTENTS
1. PREFACE
- 1.1. Introduction
- 1.2. Market Share Insights
- 1.3. Key Market Insights
- 1.4. Report Coverage
- 1.5. Key Questions Answered
- 1.6. Chapter Outlines
2. RESEARCH METHODOLOGY
- 2.1. Chapter Overview
- 2.2. Research Assumptions
- 2.3. Database Building
- 2.3.1. Data Collection
- 2.3.2. Data Validation
- 2.3.3. Data Analysis
- 2.4. Project Methodology
- 2.4.1. Secondary Research
- 2.4.1.1. Annual Reports
- 2.4.1.2. Academic Research Papers
- 2.4.1.3. Company Websites
- 2.4.1.4. Investor Presentations
- 2.4.1.5. Regulatory Filings
- 2.4.1.6. White Papers
- 2.4.1.7. Industry Publications
- 2.4.1.8. Conferences and Seminars
- 2.4.1.9. Government Portals
- 2.4.1.10. Media and Press Releases
- 2.4.1.11. Newsletters
- 2.4.1.12. Industry Databases
- 2.4.1.13. Roots Proprietary Databases
- 2.4.1.14. Paid Databases and Sources
- 2.4.1.15. Social Media Portals
- 2.4.1.16. Other Secondary Sources
- 2.4.2. Primary Research
- 2.4.2.1. Introduction
- 2.4.2.2. Types
- 2.4.2.2.1. Qualitative
- 2.4.2.2.2. Quantitative
- 2.4.2.3. Advantages
- 2.4.2.4. Techniques
- 2.4.2.4.1. Interviews
- 2.4.2.4.2. Surveys
- 2.4.2.4.3. Focus Groups
- 2.4.2.4.4. Observational Research
- 2.4.2.4.5. Social Media Interactions
- 2.4.2.5. Stakeholders
- 2.4.2.5.1. Company Executives (CXOs)
- 2.4.2.5.2. Board of Directors
- 2.4.2.5.3. Company Presidents and Vice Presidents
- 2.4.2.5.4. Key Opinion Leaders
- 2.4.2.5.5. Research and Development Heads
- 2.4.2.5.6. Technical Experts
- 2.4.2.5.7. Subject Matter Experts
- 2.4.2.5.8. Scientists
- 2.4.2.5.9. Doctors and Other Healthcare Providers
- 2.4.2.6. Ethics and Integrity
- 2.4.2.6.1. Research Ethics
- 2.4.2.6.2. Data Integrity
- 2.4.3. Analytical Tools and Databases
- 2.4.1. Secondary Research
3. ECONOMIC AND OTHER PROJECT SPECIFIC CONSIDERATIONS
- 3.1. Forecast Methodology
- 3.1.1. Top-Down Approach
- 3.1.2. Bottom-Up Approach
- 3.1.3. Hybrid Approach
- 3.2. Market Assessment Framework
- 3.2.1. Total Addressable Market (TAM)
- 3.2.2. Serviceable Addressable Market (SAM)
- 3.2.3. Serviceable Obtainable Market (SOM)
- 3.2.4. Currently Acquired Market (CAM)
- 3.3. Forecasting Tools and Techniques
- 3.3.1. Qualitative Forecasting
- 3.3.2. Correlation
- 3.2.3. Regression
- 3.3.4. Time Series Analysis
- 3.3.5. Extrapolation
- 3.3.6. Convergence
- 3.3.7. Forecast Error Analysis
- 3.3.8. Data Visualization
- 3.3.9. Scenario Planning
- 3.3.10. Sensitivity Analysis
- 3.4. Key Considerations
- 3.4.1. Demographics
- 3.4.2. Market Access
- 3.4.3. Reimbursement Scenarios
- 3.4.4. Industry Consolidation
- 3.5. Robust Quality Control
- 3.6. Key Market Segmentations
- 3.7 Limitations
4. MACRO-ECONOMIC INDICATORS
- 4.1. Chapter Overview
- 4.2. Market Dynamics
- 4.2.1. Time Period
- 4.2.1.1. Historical Trends
- 4.2.1.2. Current and Forecasted Estimates
- 4.2.2. Currency Coverage
- 4.2.2.1. Overview of Major Currencies Affecting the Market
- 4.2.2.2. Impact of Currency Fluctuations on the Industry
- 4.2.3. Foreign Exchange Impact
- 4.2.3.1. Evaluation of Foreign Exchange Rates and Their Impact on Market
- 4.2.3.2. Strategies for Mitigating Foreign Exchange Risk
- 4.2.4. Recession
- 4.2.4.1. Historical Analysis of Past Recessions and Lessons Learnt
- 4.2.4.2. Assessment of Current Economic Conditions and Potential Impact on the Market
- 4.2.5. Inflation
- 4.2.5.1. Measurement and Analysis of Inflationary Pressures in the Economy
- 4.2.5.2. Potential Impact of Inflation on the Market Evolution
- 4.2.6. Interest Rates
- 4.2.5.1. Overview of Interest Rates and Their Impact on the Market
- 4.2.5.2. Strategies for Managing Interest Rate Risk
- 4.2.7. Commodity Flow Analysis
- 4.2.7.1. Type of Commodity
- 4.2.7.2. Origins and Destinations
- 4.2.7.3. Values and Weights
- 4.2.7.4. Modes of Transportation
- 4.2.8. Global Trade Dynamics
- 4.2.8.1. Import Scenario
- 4.2.8.2. Export Scenario
- 4.2.9. War Impact Analysis
- 4.2.9.1. Russian-Ukraine War
- 4.2.9.2. Israel-Hamas War
- 4.2.10. COVID Impact / Related Factors
- 4.2.10.1. Global Economic Impact
- 4.2.10.2. Industry-specific Impact
- 4.2.10.3. Government Response and Stimulus Measures
- 4.2.10.4. Future Outlook and Adaptation Strategies
- 4.2.11. Other Indicators
- 4.2.11.1. Fiscal Policy
- 4.2.11.2. Consumer Spending
- 4.2.11.3. Gross Domestic Product (GDP)
- 4.2.11.4. Employment
- 4.2.11.5. Taxes
- 4.2.11.6. R&D Innovation
- 4.2.11.7. Stock Market Performance
- 4.2.11.8. Supply Chain
- 4.2.11.9. Cross-Border Dynamics
- 4.2.1. Time Period
5. EXECUTIVE SUMMARY
6. INTRODUCTION
- 6.1. Chapter Overview
- 6.2. Overview of Smart Lighting
- 6.2.1. Type of Component
- 6.2.2. Type of Connectivity
- 6.2.3. Type of Lighting
- 6.2.4. Type of Lighting Technology
- 6.2.5. Type of Installation
- 6.2.6. Type of Application
- 6.2.7. Type of Sales Channel
- 6.3. Future Perspective
7. COMPETITIVE LANDSCAPE
- 7.1. Chapter Overview
- 7.2. Smart Lighting: Overall Market Landscape
- 7.2.1. Analysis by Year of Establishment
- 7.2.2. Analysis by Company Size
- 7.2.3. Analysis by Location of Headquarters
- 7.2.4. Analysis by Ownership Structure
8. COMPANY PROFILES
- 8.1. Chapter Overview
- 8.2.1. Acuity Brands*
- 8.2.1.1. Company Overview
- 8.2.1.2. Company Mission
- 8.2.1.3. Company Footprint
- 8.2.1.4. Management Team
- 8.2.1.5. Contact Details
- 8.2.1.6. Financial Performance
- 8.2.1.7. Operating Business Segments
- 8.2.1.8. Service / Product Portfolio (project specific)
- 8.2.1.9. MOAT Analysis
- 8.2.1.10. Recent Developments and Future Outlook
- 8.2.2. Cisco Systems
- 8.2.3. Deco Lighting
- 8.2.4. Dialight
- 8.2.5. Eaton
- 8.2.6. General Electric
- 8.2.7. Honeywell International
- 8.2.8. Hubbell Incorporated
- 8.2.9. LIFX
- 8.2.10. Philips Lighting
- 8.2.1. Acuity Brands*
9. VALUE CHAIN ANALYSIS
10. SWOT ANALYSIS
11. GLOBAL Smart Lighting Market
- 11.1. Chapter Overview
- 11.2. Key Assumptions and Methodology
- 11.3. Trends Disruption Impacting Market
- 11.4. Global Smart Lighting Market, Historical Trends (Since 2019) and Forecasted Estimates (Till 2035)
- 11.5. Multivariate Scenario Analysis
- 11.5.1. Conservative Scenario
- 11.5.2. Optimistic Scenario
- 11.6. Key Market Segmentations
12. MARKET OPPORTUNITIES BASED ON TYPE OF COMPONENT
- 12.1. Chapter Overview
- 12.2. Key Assumptions and Methodology
- 12.3. Revenue Shift Analysis
- 12.4. Market Movement Analysis
- 12.5. Penetration-Growth (P-G) Matrix
- 12.6. Smart Lighting Market for Hardware: Historical Trends (Since 2019) and Forecasted Estimates (Till 2035)
- 12.7. Smart Lighting Market for Software: Historical Trends (Since 2019) and Forecasted Estimates (Till 2035)
- 12.8. Smart Lighting Market for Service: Historical Trends (Since 2019) and Forecasted Estimates (Till 2035)
- 12.9. Data Triangulation and Validation
13. MARKET OPPORTUNITIES BASED ON TYPE OF CONNECTIVITY
- 13.1. Chapter Overview
- 13.2. Key Assumptions and Methodology
- 13.3. Revenue Shift Analysis
- 13.4. Market Movement Analysis
- 13.5. Penetration-Growth (P-G) Matrix
- 13.6. Smart Lighting Market for Hybrid: Historical Trends (Since 2019) and Forecasted Estimates (Till 2035)
- 13.7. Smart Lighting Market for Wired: Historical Trends (Since 2019) and Forecasted Estimates (Till 2035)
- 13.8. Smart Lighting Market for Wireless: Historical Trends (Since 2019) and Forecasted Estimates (Till 2035)
- 13.9. Data Triangulation and Validation
14. MARKET OPPORTUNITIES BASED ON TYPE OF LIGHTING
- 14.1. Chapter Overview
- 14.2. Key Assumptions and Methodology
- 14.3. Revenue Shift Analysis
- 14.4. Market Movement Analysis
- 14.5. Penetration-Growth (P-G) Matrix
- 14.6. Smart Lighting Market for Fixtures: Historical Trends (Since 2019) and Forecasted Estimates (Till 2035)
- 14.7. Smart Lighting Market for Lighting Controls: Historical Trends (Since 2019) and Forecasted Estimates (Till 2035)
- 14.8. Smart Lighting Market for Smart Bulbs: Historical Trends (Since 2019) and Forecasted Estimates (Till 2035)
- 14.9. Data Triangulation and Validation
15. MARKET OPPORTUNITIES BASED ON TYPE OF LIGHTINHG TECHNOLOGY
- 15.1. Chapter Overview
- 15.2. Key Assumptions and Methodology
- 15.3. Revenue Shift Analysis
- 15.4. Market Movement Analysis
- 15.5. Penetration-Growth (P-G) Matrix
- 15.6. Smart Lighting Market for CFL: Historical Trends (Since 2019) and Forecasted Estimates (Till 2035)
- 15.7. Smart Lighting Market for Fluorescent: Historical Trends (Since 2019) and Forecasted Estimates (Till 2035)
- 15.8. Smart Lighting Market for Halogen: Historical Trends (Since 2019) and Forecasted Estimates (Till 2035)
- 15.9 Smart Lighting Market for Incandescent: Historical Trends (Since 2019) and Forecasted Estimates (Till 2035)
- 15.10. Smart Lighting Market for LED: Historical Trends (Since 2019) and Forecasted Estimates (Till 2035)
- 15.11. Data Triangulation and Validation
16. MARKET OPPORTUNITIES BASED ON TYPE OF INSTALLATION
- 16.1. Chapter Overview
- 16.2. Key Assumptions and Methodology
- 16.3. Revenue Shift Analysis
- 16.4. Market Movement Analysis
- 16.5. Penetration-Growth (P-G) Matrix
- 16.6. Smart Lighting Market for New Installation: Historical Trends (Since 2019) and Forecasted Estimates (Till 2035)
- 16.7. Smart Lighting Market for Retrofit Installation: Historical Trends (Since 2019) and Forecasted Estimates (Till 2035)
- 16.8. Data Triangulation and Validation
17. MARKET OPPORTUNITIES BASED ON TYPE OF APPLICATION
- 17.1. Chapter Overview
- 17.2. Key Assumptions and Methodology
- 17.3. Revenue Shift Analysis
- 17.4. Market Movement Analysis
- 17.5. Penetration-Growth (P-G) Matrix
- 17.6. Smart Lighting Market for Indoor: Historical Trends (Since 2019) and Forecasted Estimates (Till 2035)
- 17.7. Smart Lighting Market for Outdoor: Historical Trends (Since 2019) and Forecasted Estimates (Till 2035)
- 17.8. Data Triangulation and Validation
18. MARKET OPPORTUNITIES BASED ON TYPE OF SALES CHANNEL
- 18.1. Chapter Overview
- 18.2. Key Assumptions and Methodology
- 18.3. Revenue Shift Analysis
- 18.4. Market Movement Analysis
- 18.5. Penetration-Growth (P-G) Matrix
- 18.6. Smart Lighting Market for Direct Sales Channels: Historical Trends (Since 2019) and Forecasted Estimates (Till 2035)
- 18.7. Smart Lighting Market for Indirect Sales Channels: Historical Trends (Since 2019) and Forecasted Estimates (Till 2035)
- 18.8. Data Triangulation and Validation
19. MARKET OPPORTUNITIES FOR SMART LIGHTING IN NORTH AMERICA
- 19.1. Chapter Overview
- 19.2. Key Assumptions and Methodology
- 19.3. Revenue Shift Analysis
- 19.4. Market Movement Analysis
- 19.5. Penetration-Growth (P-G) Matrix
- 19.6. Smart Lighting Market in North America: Historical Trends (Since 2019) and Forecasted Estimates (Till 2035)
- 19.6.1. Smart Lighting Market in the US: Historical Trends (Since 2019) and Forecasted Estimates (Till 2035)
- 19.6.2. Smart Lighting Market in Canada: Historical Trends (Since 2019) and Forecasted Estimates (Till 2035)
- 19.6.3. Smart Lighting Market in Mexico: Historical Trends (Since 2019) and Forecasted Estimates (Till 2035)
- 19.6.4. Smart Lighting Market in Other North American Countries: Historical Trends (Since 2019) and Forecasted Estimates (Till 2035)
- 19.7. Data Triangulation and Validation
20. MARKET OPPORTUNITIES FOR SMART LIGHTING IN EUROPE
- 20.1. Chapter Overview
- 20.2. Key Assumptions and Methodology
- 20.3. Revenue Shift Analysis
- 20.4. Market Movement Analysis
- 20.5. Penetration-Growth (P-G) Matrix
- 20.6. Smart Lighting Market in Europe: Historical Trends (Since 2019) and Forecasted Estimates (Till 2035)
- 20.6.1. Smart Lighting Market in the Austria: Historical Trends (Since 2019) and Forecasted Estimates (Till 2035)
- 20.6.2. Smart Lighting Market in Belgium: Historical Trends (Since 2019) and Forecasted Estimates (Till 2035)
- 20.6.3. Smart Lighting Market in Denmark: Historical Trends (Since 2019) and Forecasted Estimates (Till 2035)
- 20.6.4. Smart Lighting Market in France: Historical Trends (Since 2019) and Forecasted Estimates (Till 2035)
- 20.6.5. Smart Lighting Market in Germany: Historical Trends (Since 2019) and Forecasted Estimates (Till 2035)
- 20.6.6. Smart Lighting Market in Ireland: Historical Trends (Since 2019) and Forecasted Estimates (Till 2035)
- 20.6.7. Smart Lighting Market in Italy: Historical Trends (Since 2018) and Forecasted Estimates (Till 2035)
- 20.6.8. Smart Lighting Market in Netherlands: Historical Trends (Since 2019) and Forecasted Estimates (Till 2035)
- 20.6.9. Smart Lighting Market in Norway: Historical Trends (Since 2019) and Forecasted Estimates (Till 2035)
- 20.6.10. Smart Lighting Market in Russia: Historical Trends (Since 2019) and Forecasted Estimates (Till 2035)
- 20.6.11. Smart Lighting Market in Spain: Historical Trends (Since 2019) and Forecasted Estimates (Till 2035)
- 20.6.12. Smart Lighting Market in Sweden: Historical Trends (Since 2019) and Forecasted Estimates (Till 2035)
- 20.6.13. Smart Lighting Market in Switzerland: Historical Trends(Since 2019) and Forecasted Estimates (Till 2035)
- 20.6.14. Smart Lighting Market in the UK: Historical Trends (Since 2019) and Forecasted Estimates (Till 2035)
- 20.6.15. Smart Lighting Market in Other European Countries: Historical Trends (Since 2019) and Forecasted Estimates (Till 2035)
- 20.7. Data Triangulation and Validation
21. MARKET OPPORTUNITIES FOR SMART LIGHTING IN ASIA
- 21.1. Chapter Overview
- 21.2. Key Assumptions and Methodology
- 21.3. Revenue Shift Analysis
- 21.4. Market Movement Analysis
- 21.5. Penetration-Growth (P-G) Matrix
- 21.6. Smart Lighting Market in Asia: Historical Trends (Since 2018) and Forecasted Estimates (Till 2035)
- 21.6.1. Smart Lighting Market in China: Historical Trends (Since 2019) and Forecasted Estimates (Till 2035)
- 21.6.2. Smart Lighting Market in India: Historical Trends (Since 2018) and Forecasted Estimates (Till 2035)
- 21.6.3. Smart Lighting Market in Japan: Historical Trends (Since 2019) and Forecasted Estimates (Till 2035)
- 21.6.4. Smart Lighting Market in Singapore: Historical Trends (Since 2019) and Forecasted Estimates (Till 2035)
- 21.6.5. Smart Lighting Market in South Korea: Historical Trends (Since 2019) and Forecasted Estimates (Till 2035)
- 21.6.6. Smart Lighting Market in Other Asian Countries: Historical Trends (Since 2019) and Forecasted Estimates (Till 2035)
- 21.7. Data Triangulation and Validation
22. MARKET OPPORTUNITIES FOR SMART LIGHTING IN MIDDLE EAST AND NORTH AFRICA (MENA)
- 22.1. Chapter Overview
- 22.2. Key Assumptions and Methodology
- 22.3. Revenue Shift Analysis
- 22.4. Market Movement Analysis
- 22.5. Penetration-Growth (P-G) Matrix
- 22.6. Smart Lighting Market in Middle East and North Africa (MENA): Historical Trends (Since 2019) and Forecasted Estimates (Till 2035)
- 22.6.1. Smart Lighting Market in Egypt: Historical Trends (Since 2019) and Forecasted Estimates (Till 205)
- 22.6.2. Smart Lighting Market in Iran: Historical Trends (Since 2018) and Forecasted Estimates (Till 2035)
- 22.6.3. Smart Lighting Market in Iraq: Historical Trends (Since 2018) and Forecasted Estimates (Till 2035)
- 22.6.4. Smart Lighting Market in Israel: Historical Trends (Since 2019) and Forecasted Estimates (Till 2035)
- 22.6.5. Smart Lighting Market in Kuwait: Historical Trends (Since 2019) and Forecasted Estimates (Till 2035)
- 22.6.6. Smart Lighting Market in Saudi Arabia: Historical Trends (Since 2019) and Forecasted Estimates (Till 2035)
- 22.6.7. Smart Lighting Market in United Arab Emirates (UAE): Historical Trends (Since 2019) and Forecasted Estimates (Till 2035)
- 22.6.8. Smart Lighting Market in Other MENA Countries: Historical Trends (Since 2019) and Forecasted Estimates (Till 2035)
- 22.7. Data Triangulation and Validation
23. MARKET OPPORTUNITIES FOR SMART LIGHTING IN LATIN AMERICA
- 23.1. Chapter Overview
- 23.2. Key Assumptions and Methodology
- 23.3. Revenue Shift Analysis
- 23.4. Market Movement Analysis
- 23.5. Penetration-Growth (P-G) Matrix
- 23.6. Smart Lighting Market in Latin America: Historical Trends (Since 2019) and Forecasted Estimates (Till 2035)
- 23.6.1. Smart Lighting Market in Argentina: Historical Trends (Since 2019) and Forecasted Estimates (Till 2035)
- 23.6.2. Smart Lighting Market in Brazil: Historical Trends (Since 2019) and Forecasted Estimates (Till 2035)
- 23.6.3. Smart Lighting Market in Chile: Historical Trends (Since 2019) and Forecasted Estimates (Till 2035)
- 23.6.4. Smart Lighting Market in Colombia Historical Trends (Since 2019) and Forecasted Estimates (Till 2035)
- 23.6.5. Smart Lighting Market in Venezuela: Historical Trends (Since 2019) and Forecasted Estimates (Till 2035)
- 23.6.6. Smart Lighting Market in Other Latin American Countries: Historical Trends (Since 2019) and Forecasted Estimates (Till 2035)
- 23.7. Data Triangulation and Validation
24. MARKET OPPORTUNITIES FOR SMART LIGHTING IN REST OF THE WORLD
- 24.1. Chapter Overview
- 24.2. Key Assumptions and Methodology
- 24.3. Revenue Shift Analysis
- 24.4. Market Movement Analysis
- 24.5. Penetration-Growth (P-G) Matrix
- 24.6. Smart Lighting Market in Rest of the World: Historical Trends (Since 2019) and Forecasted Estimates (Till 2035)
- 24.6.1. Smart Lighting Market in Australia: Historical Trends (Since 2019) and Forecasted Estimates (Till 2035)
- 24.6.2. Smart Lighting Market in New Zealand: Historical Trends (Since 2019) and Forecasted Estimates (Till 2035)
- 24.6.3. Smart Lighting Market in Other Countries
- 24.7. Data Triangulation and Validation