
|
시장보고서
상품코드
1883292
솔라카 시장 : 업계 동향 및 예측(-2035년) - 차량 유형별, 배터리 유형별, 전기자동차 유형별, 태양전지판 유형별, 기업 유형별, 지역별Solar Vehicle Market, Till 2035: Distribution by Type of Vehicle, Type of Battery, Type of Electronic Vehicle, Type of Solar Panel, Type of Enterprise, and Geographical Regions: Industry Trends and Global Forecasts |
||||||
솔라카 시장 개요
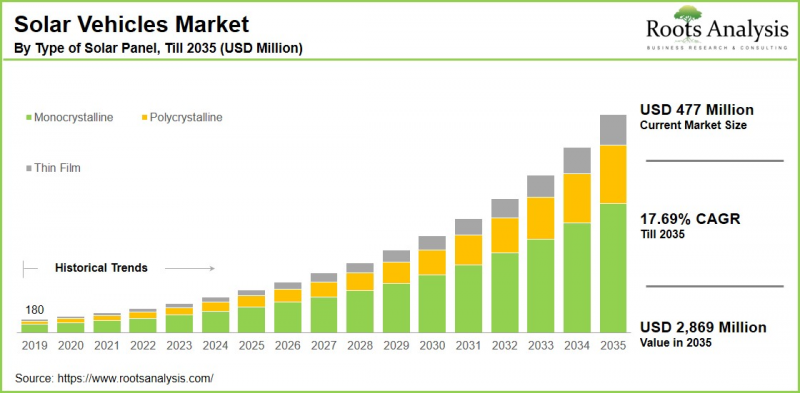
Roots Analysis의 조사에 따르면 세계의 솔라카 시장 규모는 현재 4억 7,700만 달러에서 2035년까지 28억 6,900만 달러로 성장하고, 예측 기간의 CAGR은 17.69%로 추정되고 있습니다.
솔라카 시장의 기회는 다음 부문에 분산되어 있습니다.
차량 유형
- 상용차
- 승용차
배터리 유형
- 납축전지
- 리튬 이온
- 니켈 카드뮴
- 기타
전기자동차 유형
- 배터리식 전기자동차
- 하이브리드 전기자동차
태양전지판 유형
- 단결정
- 다결정
- 박막
기업 형태
- 대기업
- 중소기업
지리적 지역
- 북미
- 미국
- 캐나다
- 멕시코
- 기타 북미 국가
- 유럽
- 오스트리아
- 벨기에
- 덴마크
- 프랑스
- 독일
- 아일랜드
- 이탈리아
- 네덜란드
- 노르웨이
- 러시아
- 스페인
- 스웨덴
- 스위스
- 영국
- 기타 유럽 국가
- 아시아
- 중국
- 인도
- 일본
- 싱가포르
- 한국
- 기타 아시아 국가
- 라틴아메리카
- 브라질
- 칠레
- 콜롬비아
- 베네수엘라
- 기타 라틴아메리카 국가
- 중동 및 북아프리카
- 이집트
- 이란
- 이라크
- 이스라엘
- 쿠웨이트
- 사우디아라비아
- 아랍에미리트(UAE)
- 기타 중동 및 북아프리카 국가
- 기타 지역
- 호주
- 뉴질랜드
- 기타 국가들
솔라카 시장 : 성장과 동향
평균적으로 일반 승용차는 연간 4.5톤 이상의 이산화탄소를 배출합니다. 이 통계는 태양광을 이용하여 전기 모터를 구동하는 태양열 자동차의 중요성을 강조합니다. 솔라카는 태양광을 전기로 변환하는 태양전지(PV)를 사용하여 작동하며, 변환된 전기는 차량 구동에 즉시 사용하거나 배터리에 저장합니다. 태양광 자동차는 경량 소재 개발, 효율적인 에너지 변환 시스템, 그리고 환경에 미치는 영향을 최소화하는 능력 덕분에 많은 사람들에게 선호되고 있습니다. 게다가 휘발유 자동차를 대체할 친환경적인 대안에 대한 수요 증가가 태양광 자동차 시장의 성장세를 견인하고 있습니다.
자동차업계의 지속가능성 촉진을 목적으로 하는 엄격한 규제로 예측기간 동안 솔라카시장은 대폭적인 성장이 예상됩니다. 중요한 기술 혁신은 태양전지판에서 에너지 생산을 최적화하는 최대 전력 포인트 추적(MPPT) 회로의 개발을 포함합니다. 게다가, 제조면에서의 다른 발전에는 배터리 성능 향상과 하이브리드 전기 기술이 포함됩니다. 중요한 점은 온실가스 배출과 관련한 환경문제의 높아짐에 따라 각국 당국과 규제기관은 도로의 안전성을 확보하면서 친환경 차량 사용을 장려하고 있습니다.
솔라카 시장 : 주요 부문
차종별 시장 점유율
차량 유형별로 세계 솔라카 시장은 상용차와 승용차로 구분됩니다. 당사의 추정에 따르면 현재 승용차 부문은 시장 점유율의 대부분을 차지하고 있습니다. 또한, 이 부문은 가까운 미래에 현저하게 높은 CAGR로 확대될 것으로 예측됩니다. 이 성장은 환경 문제에 대한 소비자의 의식 향상, 태양 기술의 진보 및 정부의 유리한 조치와 관련이 있습니다.
배터리 유형별 시장 점유율
배터리 유형별로 세계 솔라카 시장은 납 축전지, 리튬 이온 배터리, 니켈 카드뮴 배터리 등으로 분류됩니다. 당사의 추정에 따르면 현재 리튬 이온 배터리 부문은 시장 점유율의 대부분을 차지합니다. 또한, 이 부문은 예측 기간 동안 비교적 높은 CAGR로 성장할 것으로 예측됩니다. 이 성장은 뛰어난 에너지 밀도로 인한 콤팩트한 크기의 대용량 축전 능력과 긴 수명 사이클로 인한 장기적인 내구성과 비용 효율성 증가로 인한 것으로 예측됩니다.
전기자동차 유형별 시장 점유율
전기자동차 유형별로 세계의 솔라카 시장은 배터리식 전기자동차와 하이브리드식 전기자동차로 분류됩니다. 당사의 추정에 따르면, 현재 하이브리드 솔라카 부문은 시장 점유율의 대부분을 차지하고 있습니다. 또한, 이 부문은 예측 기간 동안 비교적 높은 복합 연간 성장률(CAGR)을 보일 것으로 예측됩니다. 이 성장은 솔라카에 대한 정부의 우대 조치와 그 비용 효과를 높이는 엄격한 배출 규제에 의해 추진되고 있습니다.
태양전지판 유형별 시장 점유율
태양전지판 유형별로 세계의 솔라카 시장은 단결정, 다결정 및 기타로 구분됩니다. 당사의 추정에 따르면 현재 단결정 부문은 시장 점유율의 대부분을 차지하고 있습니다. 이는 솔라카의 높은 에너지 효율로 인해 더 작은 공간에서 더 많은 발전을 가능하게 하기 때문입니다.
한편, 예측 기간 동안 다결정 부문의 성장률이 빨라질 것으로 예측됩니다. 이는 다결정 패널이 일반적으로 약 20% 저렴하기 때문에 합리적인 가격과 제조 용이성이 요인입니다. 이를 통해 비용 효율적인 태양광 옵션을 요구하는 소비자와 제조업체 모두에게 매력적인 선택이 되었습니다.
기업 규모별 시장 점유율
기업 규모별로 보면 세계 솔라카 시장은 대기업과 중소기업으로 구분됩니다. 당사의 추정에 따르면 현재 대기업 부문은 시장 점유율의 대부분을 차지하고 있습니다. 이 성장은 솔라카 기술에 대한 투자 능력, 풍부한 자원 활용, 규모의 경제 실현, 사업 확대 추진 등의 점에 기인한다고 생각됩니다.
지역별 시장 점유율
지역별로 솔라카 시장은 북미, 유럽, 아시아, 라틴아메리카, 중동, 북아프리카 및 기타 지역으로 구분됩니다. 당사의 추계에 따르면 현재 북미는 시장의 대부분을 차지하고 있습니다. 이는 정부의 강력한 지원, 솔라카의 환경적 이점에 대한 인식이 높아지고, 수송용 태양광 기술의 현저한 발전으로 인한 것입니다.
그 결과 예측기간 동안 아시아가 가장 높은 CAGR을 나타낼 것으로 예측됩니다. 이 성장을 견인하는 주요 요인으로는 솔라카 충전 인프라의 급속한 발전과 지속 가능한 교통 솔루션에 대한 소비자 수요 증가가 있습니다.
솔라카 시장의 대표적인 기업 예
- Aptera
- BMW
- Daimler
- Fiat Chrysler
- Fiat Chrysler
- Fisker
- Ford
- Hyundai Motor
- Lightyear
- Mahindra & Mahindra
- Nissan
- Sono Motors
- Tata Motors
- Tesla
- Toyota
- Volkswagen
솔라카 시장 : 조사 범위
이 보고서는 솔라카 시장에 대한 다음 섹션별로 상세한 분석을 제공합니다.
- 시장 규모와 기회 분석 : 솔라카 시장의 상세한 분석. 주요 시장 부문은 (A) 차량 유형, (B) 배터리 유형, (C) 전기자동차 유형, (D) 태양전지판 유형, (E) 기업 유형, (F) 지리적 지역에 초점을 맞추었습니다.
- 경쟁 구도 : 솔라카 시장 진출기업에 대해 (A) 설립 연도, (B) 기업 규모, (C) 본사 위치, (D) 소유 구조 등 여러 관련 매개변수를 기반으로 한 종합적인 분석입니다.
- 기업 프로파일 : 솔라카 시장에 참여하는 주요 기업의 상세한 프로파일을 제공하고, (A) 본사 위치, (B) 기업 규모, (C) 기업 이념, (D) 사업 전개 지역, (E) 경영진, (F) 연락처, (G) 재무 정보, (H) 사업 부문, (I) 제품 포트폴리오, (J) 경쟁 우위성 분석, (K) 최근 동향 및 미래 전망을 설명합니다.
- 메가 트렌드 : 태양전지 자동차 산업에서 진행중인 메가 트렌드의 평가를 제공합니다.
- 특허 분석 : 솔라카 분야에서 출원 및 등록된 특허에 관한 통찰이 풍부한 분석. 관련 파라미터별로는 (A) 특허 유형, (B) 특허 공개 연도, (C) 특허의 경과 연수, (D) 주요 기업을 분석 대상으로 합니다.
- 최근 동향 : 태양전지 자동차 시장에서의 최근 동향의 개요와 (A) 이니셔티브의 연례, (B) 이니셔티브 유형, (C) 지리적 분포, (D) 가장 활발한 기업와 같은 관련 매개변수에 기초한 분석입니다.
- Porter's Five Forces 분석 : 솔라카 시장에 존재하는 5개의 경쟁적 요인(신규 참가자의 위협, 구매자의 협상력, 공급업체의 협상력, 대체품의 위협, 기존 경쟁자 간의 경쟁)에 대한 분석입니다.
- SWOT 분석 : 당분야의 강점, 약점, 기회, 위협을 명시한 통찰력이 풍부한 SWOT 프레임워크입니다. 또한 하비볼 분석을 제공하여 각 SWOT 파라미터의 상대적 영향도를 강조합니다.
- 밸류체인 분석 : 밸류체인의 종합적인 분석으로, 태양전지 자동차 시장과 관련된 다양한 단계와 이해관계자의 정보를 제공합니다.
목차
섹션 I : 보고서 개요
제1장 서문
제2장 조사 방법
제3장 시장 역학
제4장 거시경제지표
섹션 II : 질적 통찰력
제5장 주요 요약
제6장 소개
제7장 규제 시나리오
섹션 III : 시장 개요
제8장 주요 진출기업의 종합적인 데이터베이스
제9장 경쟁 구도
제10장 화이트 스페이스 분석
제11장 기업 경쟁력 분석
제12장 솔라카 시장의 스타트업 에코시스템
섹션 IV : 기업 프로파일
제13장 기업 프로파일
- 장의 개요
- Aptera
- BMW
- Daimler
- Fiat Chrysler
- Fiat Chrysler
- Fisker
- Ford
- Hyundai Motor
- Lightyear
- Mahindra & Mahindra
- Nissan
- Sono Motors
- Tata Motors
- Tesla
- Toyota
- Volkswagen
섹션 V : 시장 동향
제14장 메가 트렌드 분석
제15장 미충족 요구 분석
제16장 특허 분석
제17장 최근 동향
섹션 VI : 시장 기회 분석
제18장 세계의 솔라카 시장
제19장 차량 유형별 시장 기회
제20장 배터리 유형별 시장 기회
제21장 전기자동차 유형별 시장 기회
제22장 솔라 패널 유형별 시장 기회
제23장 기업 유형별 시장 기회
제24장 북미의 솔라카 시장 기회
제25장 유럽의 솔라카 시장 기회
제26장 아시아의 솔라카 시장 기회
제27장 중동 및 북아프리카(MENA)의 솔라카 시장 기회
제28장 라틴아메리카의 솔라카 시장 기회
제29장 기타 지역의 솔라카 시장 기회
제30장 시장 집중 분석 : 주요 시장 진출기업별 분포
제31장 인접 시장 분석
섹션 VII : 전략 도구
제32장 중요한 승리 전략
제33장 Porter's Five Forces 분석
제34장 SWOT 분석
제35장 밸류체인 분석
제36장 ROOTS의 전략 제안
섹션 VIII : 기타 독점적 통찰
제37장 1차 조사로부터의 통찰
제38장 보고서의 결론
섹션 IX : 부록
제39장 표 형식 데이터
제40장 기업 및 단체 일람
제41장 커스터마이즈 기회
제42장 ROOTS 구독 서비스
제43장 저자 상세
JHS 25.12.15Solar Vehicle Market Overview
As per Roots Analysis, the global solar vehicle market size is estimated to grow from USD 477 million in the current year USD 2,869 million by 2035, at a CAGR of 17.69% during the forecast period, till 2035.

The opportunity for solar vehicle market has been distributed across the following segments:
Type of Vehicle
- Commercial Vehicles
- Passenger Vehicles
Type of Battery
- Lead Acid
- Lithium Ion
- Nickel Cadmium
- Others
Type of Electronic Vehicle
- Battery Electric Vehicle
- Hybrid Electric Vehicle
Type of Solar Panel
- Monocrystalline
- Polycrystalline
- Thin Film
Type of Enterprise
- Large
- Small and Medium Enterprise
Geographical Regions
- North America
- US
- Canada
- Mexico
- Other North American countries
- Europe
- Austria
- Belgium
- Denmark
- France
- Germany
- Ireland
- Italy
- Netherlands
- Norway
- Russia
- Spain
- Sweden
- Switzerland
- UK
- Other European countries
- Asia
- China
- India
- Japan
- Singapore
- South Korea
- Other Asian countries
- Latin America
- Brazil
- Chile
- Colombia
- Venezuela
- Other Latin American countries
- Middle East and North Africa
- Egypt
- Iran
- Iraq
- Israel
- Kuwait
- Saudi Arabia
- UAE
- Other MENA countries
- Rest of the World
- Australia
- New Zealand
- Other countries
Solar Vehicle Market: Growth and Trends
On average, a standard passenger vehicle produces over 4.5 metric tons of carbon dioxide annually. This statistic highlights the importance of solar vehicles, which utilize sunlight to drive electric motors. Solar cars operate using photovoltaic (PV) cells that transform sunlight into electricity, either for immediate use in powering the vehicle or for storage in batteries. It is important to note that solar vehicles are preferred for their advancements in lightweight materials, effective energy conversion systems, and their capacity to function with minimal environmental impact. Moreover, the growth trend in the solar vehicle market is driven by increasing demand for eco-friendly alternatives to gasoline-powered cars.
The solar vehicle market is anticipated to grow substantially over the forecast period, due to strict regulations aimed at promoting sustainability within the automotive sector. A significant innovation is the development of maximum power point tracking (MPPT) circuits, which have optimized energy production from solar panels. Additionally, other advancements in manufacturing encompass enhanced battery performance and hybrid-electric technology. Importantly, rising environmental concerns related to greenhouse gas emissions have prompted authorities and regulatory organizations in various countries to promote the use of eco-friendly vehicles while ensuring road safety.
Solar Vehicle Market: Key Segments
Market Share by Type of Vehicle
Based on type of vehicle, the global solar vehicle market is segmented into commercial vehicles and passenger vehicles. According to our estimates, currently, the passenger vehicles segment captures the majority of the market share. Additionally, this segment is expected to expand at a notably higher CAGR in the near future. This growth can be linked to increasing consumer awareness regarding environmental concerns, advancements in solar technology, and favorable government initiatives.
Market Share by Type of Battery
Based on type of battery, the global solar vehicle market is segmented into lead acid, lithium ion, nickel cadmium and others. According to our estimates, currently, the lithium-ion segment captures the majority of the market share. Additionally, this segment is projected to experience a relatively higher CAGR during the forecast period. This growth can be linked to their superior energy density, enabling more energy storage in a compact size, along with their extended cycle life, ensuring long-term durability and cost-effectiveness.
Market Share by Type of Electronic Vehicle
Based on type of electronic vehicle, the global solar vehicle market is segmented into battery electric vehicle and hybrid electric vehicle. According to our estimates, currently, the hybrid solar vehicle segment captures the majority of the market share. Additionally, this segment is expected to experience a comparatively higher compound annual growth rate during the forecast period. This growth is driven by government incentives for solar vehicles and strict emission regulations that improve their cost-effectiveness.
Market Share by Type of Solar Panel
Based on type of solar panel, the global solar vehicle market is segmented into monocrystalline, polycrystalline and others. According to our estimates, currently, the monocrystalline segment captures the majority of the market share. This is due to the high energy efficiency in solar cars, enabling more electricity generation in smaller spaces.
Conversely, the polycrystalline segment is expected to experience a faster growth rate during the forecast period. This can be attributed to their affordability and ease of manufacturing, as polycrystalline panels are generally about 20% cheaper, making them an appealing choice for both consumers and manufacturers looking for cost-effective solar options.
Market Share by Type of Enterprise
Based on type of enterprise, the global solar vehicle market is segmented into large and small and medium enterprise. According to our estimates, currently, the large enterprise segment captures the majority of the market share. This growth can be attributed to their ability to invest in solar vehicle technologies, take advantage of considerable resources, achieve economies of scale, and promote business expansion.
Market Share by Geographical Regions
Based on geographical regions, the solar vehicle market is segmented into North America, Europe, Asia, Latin America, Middle East and North Africa, and the rest of the world. According to our estimates, currently North America captures the majority share of the market, owing to strong governmental backing, growing awareness of the environmental advantages of solar vehicles, and notable advancements in solar technology for transportation.
Consequently, Asia is projected to experience the highest compound annual growth rate (CAGR) during the forecast period. Key factors driving this growth include the rapid development of solar vehicle charging infrastructure and an increasing consumer demand for sustainable transportation solutions.
Example Players in Solar Vehicle Market
- Aptera
- BMW
- Daimler
- Fiat Chrysler
- Fiat Chrysler
- Fisker
- Ford
- Hyundai Motor
- Lightyear
- Mahindra & Mahindra
- Nissan
- Sono Motors
- Tata Motors
- Tesla
- Toyota
- Volkswagen
Solar Vehicle Market: Research Coverage
The report on the solar vehicle market features insights on various sections, including:
- Market Sizing and Opportunity Analysis: An in-depth analysis of the solar vehicle market, focusing on key market segments, including [A] type of vehicle, [B] type of battery, [C] type of electronic vehicle, [D] type of solar panel, [E] type of enterprise, and [F] geographical regions.
- Competitive Landscape: A comprehensive analysis of the companies engaged in the solar vehicle market, based on several relevant parameters, such as [A] year of establishment, [B] company size, [C] location of headquarters and [D] ownership structure.
- Company Profiles: Elaborate profiles of prominent players engaged in the solar vehicle market, providing details on [A] location of headquarters, [B] company size, [C] company mission, [D] company footprint, [E] management team, [F] contact details, [G] financial information, [H] operating business segments, [I] portfolio, [J] moat analysis, [K] recent developments, and an informed future outlook.
- Megatrends: An evaluation of ongoing megatrends in the solar vehicle industry.
- Patent Analysis: An insightful analysis of patents filed / granted in the solar vehicle domain, based on relevant parameters, including [A] type of patent, [B] patent publication year, [C] patent age and [D] leading players.
- Recent Developments: An overview of the recent developments made in the solar vehicle market, along with analysis based on relevant parameters, including [A] year of initiative, [B] type of initiative, [C] geographical distribution and [D] most active players.
- Porter's Five Forces Analysis: An analysis of five competitive forces prevailing in the solar vehicle market, including threats of new entrants, bargaining power of buyers, bargaining power of suppliers, threats of substitute products and rivalry among existing competitors.
- SWOT Analysis: An insightful SWOT framework, highlighting the strengths, weaknesses, opportunities and threats in the domain. Additionally, it provides Harvey ball analysis, highlighting the relative impact of each SWOT parameter.
- Value Chain Analysis: A comprehensive analysis of the value chain, providing information on the different phases and stakeholders involved in the solar vehicle market.
Key Questions Answered in this Report
- How many companies are currently engaged in solar vehicle market?
- Which are the leading companies in this market?
- What factors are likely to influence the evolution of this market?
- What is the current and future market size?
- What is the CAGR of this market?
- How is the current and future market opportunity likely to be distributed across key market segments?
Reasons to Buy this Report
- The report provides a comprehensive market analysis, offering detailed revenue projections of the overall market and its specific sub-segments. This information is valuable to both established market leaders and emerging entrants.
- Stakeholders can leverage the report to gain a deeper understanding of the competitive dynamics within the market. By analyzing the competitive landscape, businesses can make informed decisions to optimize their market positioning and develop effective go-to-market strategies.
- The report offers stakeholders a comprehensive overview of the market, including key drivers, barriers, opportunities, and challenges. This information empowers stakeholders to stay abreast of market trends and make data-driven decisions to capitalize on growth prospects.
Additional Benefits
- Complimentary Excel Data Packs for all Analytical Modules in the Report
- 15% Free Content Customization
- Detailed Report Walkthrough Session with Research Team
- Free Updated report if the report is 6-12 months old or older
TABLE OF CONTENTS
SECTION I: REPORT OVERVIEW
1. PREFACE
- 1.1. Introduction
- 1.2. Market Share Insights
- 1.3. Key Market Insights
- 1.4. Report Coverage
- 1.5. Key Questions Answered
- 1.6. Chapter Outlines
2. RESEARCH METHODOLOGY
- 2.1. Chapter Overview
- 2.2. Research Assumptions
- 2.3. Database Building
- 2.3.1. Data Collection
- 2.3.2. Data Validation
- 2.3.3. Data Analysis
- 2.4. Project Methodology
- 2.4.1. Secondary Research
- 2.4.1.1. Annual Reports
- 2.4.1.2. Academic Research Papers
- 2.4.1.3. Company Websites
- 2.4.1.4. Investor Presentations
- 2.4.1.5. Regulatory Filings
- 2.4.1.6. White Papers
- 2.4.1.7. Industry Publications
- 2.4.1.8. Conferences and Seminars
- 2.4.1.9. Government Portals
- 2.4.1.10. Media and Press Releases
- 2.4.1.11. Newsletters
- 2.4.1.12. Industry Databases
- 2.4.1.13. Roots Proprietary Databases
- 2.4.1.14. Paid Databases and Sources
- 2.4.1.15. Social Media Portals
- 2.4.1.16. Other Secondary Sources
- 2.4.2. Primary Research
- 2.4.2.1. Introduction
- 2.4.2.2. Types
- 2.4.2.2.1. Qualitative
- 2.4.2.2.2. Quantitative
- 2.4.2.3. Advantages
- 2.4.2.4. Techniques
- 2.4.2.4.1. Interviews
- 2.4.2.4.2. Surveys
- 2.4.2.4.3. Focus Groups
- 2.4.2.4.4. Observational Research
- 2.4.2.4.5. Social Media Interactions
- 2.4.2.5. Stakeholders
- 2.4.2.5.1. Company Executives (CXOs)
- 2.4.2.5.2. Board of Directors
- 2.4.2.5.3. Company Presidents and Vice Presidents
- 2.4.2.5.4. Key Opinion Leaders
- 2.4.2.5.5. Research and Development Heads
- 2.4.2.5.6. Technical Experts
- 2.4.2.5.7. Subject Matter Experts
- 2.4.2.5.8. Scientists
- 2.4.2.5.9. Doctors and Other Healthcare Providers
- 2.4.2.6. Ethics and Integrity
- 2.4.2.6.1. Research Ethics
- 2.4.2.6.2. Data Integrity
- 2.4.3. Analytical Tools and Databases
- 2.4.1. Secondary Research
3. MARKET DYNAMICS
- 3.1. Forecast Methodology
- 3.1.1. Top-Down Approach
- 3.1.2. Bottom-Up Approach
- 3.1.3. Hybrid Approach
- 3.2. Market Assessment Framework
- 3.2.1. Total Addressable Market (TAM)
- 3.2.2. Serviceable Addressable Market (SAM)
- 3.2.3. Serviceable Obtainable Market (SOM)
- 3.2.4. Currently Acquired Market (CAM)
- 3.3. Forecasting Tools and Techniques
- 3.3.1. Qualitative Forecasting
- 3.3.2. Correlation
- 3.3.3. Regression
- 3.3.4. Time Series Analysis
- 3.3.5. Extrapolation
- 3.3.6. Convergence
- 3.3.7. Forecast Error Analysis
- 3.3.8. Data Visualization
- 3.3.9. Scenario Planning
- 3.3.10. Sensitivity Analysis
- 3.4. Key Considerations
- 3.4.1. Demographics
- 3.4.2. Market Access
- 3.4.3. Reimbursement Scenarios
- 3.4.4. Industry Consolidation
- 3.5. Robust Quality Control
- 3.6. Key Market Segmentations
- 3.7. Limitations
4. MACRO-ECONOMIC INDICATORS
- 4.1. Chapter Overview
- 4.2. Market Dynamics
- 4.2.1. Time Period
- 4.2.1.1. Historical Trends
- 4.2.1.2. Current and Forecasted Estimates
- 4.2.2. Currency Coverage
- 4.2.2.1. Overview of Major Currencies Affecting the Market
- 4.2.2.2. Impact of Currency Fluctuations on the Industry
- 4.2.3. Foreign Exchange Impact
- 4.2.3.1. Evaluation of Foreign Exchange Rates and Their Impact on Market
- 4.2.3.2. Strategies for Mitigating Foreign Exchange Risk
- 4.2.4. Recession
- 4.2.4.1. Historical Analysis of Past Recessions and Lessons Learnt
- 4.2.4.2. Assessment of Current Economic Conditions and Potential Impact on the Market
- 4.2.5. Inflation
- 4.2.5.1. Measurement and Analysis of Inflationary Pressures in the Economy
- 4.2.5.2. Potential Impact of Inflation on the Market Evolution
- 4.2.6. Interest Rates
- 4.2.6.1. Overview of Interest Rates and Their Impact on the Market
- 4.2.6.2. Strategies for Managing Interest Rate Risk
- 4.2.7. Commodity Flow Analysis
- 4.2.7.1. Type of Commodity
- 4.2.7.2. Origins and Destinations
- 4.2.7.3. Values and Weights
- 4.2.7.4. Modes of Transportation
- 4.2.8. Global Trade Dynamics
- 4.2.8.1. Import Scenario
- 4.2.8.2. Export Scenario
- 4.2.9. War Impact Analysis
- 4.2.9.1. Russian-Ukraine War
- 4.2.9.2. Israel-Hamas War
- 4.2.10. COVID Impact / Related Factors
- 4.2.10.1. Global Economic Impact
- 4.2.10.2. Industry-specific Impact
- 4.2.10.3. Government Response and Stimulus Measures
- 4.2.10.4. Future Outlook and Adaptation Strategies
- 4.2.11. Other Indicators
- 4.2.11.1. Fiscal Policy
- 4.2.11.2. Consumer Spending
- 4.2.11.3. Gross Domestic Product (GDP)
- 4.2.11.4. Employment
- 4.2.11.5. Taxes
- 4.2.11.6. R&D Innovation
- 4.2.11.7. Stock Market Performance
- 4.2.11.8. Supply Chain
- 4.2.11.9. Cross-Border Dynamics
- 4.2.1. Time Period
SECTION II: QUALITATIVE INSIGHTS
5. EXECUTIVE SUMMARY
6. INTRODUCTION
- 6.1. Chapter Overview
- 6.2. Overview of Solar Vehicle Market
- 6.2.1. Type of Vehicle
- 6.2.2. Type of Battery
- 6.2.3. Type of Electronic Vehicle
- 6.2.4. Type of Solar Panel
- 6.2.5. Type of Enterprise
- 6.3. Future Perspective
7. REGULATORY SCENARIO
SECTION III: MARKET OVERVIEW
8. COMPREHENSIVE DATABASE OF LEADING PLAYERS
9. COMPETITIVE LANDSCAPE
- 9.1. Chapter Overview
- 9.2. Solar Vehicle: Overall Market Landscape
- 9.2.1. Analysis by Year of Establishment
- 9.2.2. Analysis by Company Size
- 9.2.3. Analysis by Location of Headquarters
- 9.2.4. Analysis by Ownership Structure
10. WHITE SPACE ANALYSIS
11. COMPANY COMPETITIVENESS ANALYSIS
12. STARTUP ECOSYSTEM IN THE SOLAR VEHICLE MARKET
- 12.1. Solar Vehicle Market: Market Landscape of Startups
- 12.1.1. Analysis by Year of Establishment
- 12.1.2. Analysis by Company Size
- 12.1.3. Analysis by Company Size and Year of Establishment
- 12.1.4. Analysis by Location of Headquarters
- 12.1.5. Analysis by Company Size and Location of Headquarters
- 12.1.6. Analysis by Ownership Structure
- 12.2. Key Findings
SECTION IV: COMPANY PROFILES
13. COMPANY PROFILES
- 13.1. Chapter Overview
- 13.2. Aptera*
- 13.2.1. Company Overview
- 13.2.2. Company Mission
- 13.2.3. Company Footprint
- 13.2.4. Management Team
- 13.2.5. Contact Details
- 13.2.6. Financial Performance
- 13.2.7. Operating Business Segments
- 13.2.8. Service / Product Portfolio (project specific)
- 13.2.9. MOAT Analysis
- 13.2.10. Recent Developments and Future Outlook
- 13.3. BMW
- 13.4. Daimler
- 13.5. Fiat Chrysler
- 13.6. Fiat Chrysler
- 13.7. Fisker
- 13.8. Ford
- 13.9. Hyundai Motor
- 13.10. Lightyear
- 13.11. Mahindra & Mahindra
- 13.12. Nissan
- 13.13. Sono Motors
- 13.14. Tata Motors
- 13.15. Tesla
- 13.16. Toyota
- 13.17. Volkswagen
SECTION V: MARKET TRENDS
14. MEGA TRENDS ANALYSIS
15. UNMET NEED ANALYSIS
16. PATENT ANALYSIS
17. RECENT DEVELOPMENTS
- 17.1. Chapter Overview
- 17.2. Recent Funding
- 17.3. Recent Partnerships
- 17.4. Other Recent Initiatives
SECTION VI: MARKET OPPORTUNITY ANALYSIS
18. GLOBAL SOLAR VEHICLE MARKET
- 18.1. Chapter Overview
- 18.2. Key Assumptions and Methodology
- 18.3. Trends Disruption Impacting Market
- 18.4. Demand Side Trends
- 18.5. Supply Side Trends
- 18.6. Global Solar Vehicle Market, Historical Trends (Since 2019) and Forecasted Estimates (Till 2035)
- 18.7. Multivariate Scenario Analysis
- 18.7.1. Conservative Scenario
- 18.7.2. Optimistic Scenario
- 18.8. Investment Feasibility Index
- 18.9. Key Market Segmentations
19. MARKET OPPORTUNITIES BASED ON TYPE OF VEHICLE
- 19.1. Chapter Overview
- 19.2. Key Assumptions and Methodology
- 19.3. Revenue Shift Analysis
- 19.4. Market Movement Analysis
- 19.5. Penetration-Growth (P-G) Matrix
- 19.6. Solar Vehicle Market for Commercial Vehicles: Historical Trends (Since 2019) and Forecasted Estimates (Till 2035)
- 19.7. Solar Vehicle Market for Passenger Vehicles: Historical Trends (Since 2019) and Forecasted Estimates (Till 2035)
- 19.8. Data Triangulation and Validation
- 19.8.1. Secondary Sources
- 19.8.2. Primary Sources
- 19.8.3. Statistical Modeling
20. MARKET OPPORTUNITIES BASED ON TYPE OF BATTERY
- 20.1. Chapter Overview
- 20.2. Key Assumptions and Methodology
- 20.3. Revenue Shift Analysis
- 20.4. Market Movement Analysis
- 20.5. Penetration-Growth (P-G) Matrix
- 20.6. Solar Vehicle Market for Lead Acid: Historical Trends (Since 2019) and Forecasted Estimates (Till 2035)
- 20.7. Solar Vehicle Market for Lithium Ion: Historical Trends (Since 2019) and Forecasted Estimates (Till 2035)
- 20.8. Solar Vehicle Market for Nickel Cadmium: Historical Trends (Since 2019) and Forecasted Estimates (Till 2035)
- 20.9. Solar Vehicle Market for Others: Historical Trends (Since 2019) and Forecasted Estimates (Till 2035)
- 20.10. Data Triangulation and Validation
- 20.10.1. Secondary Sources
- 20.10.2. Primary Sources
- 20.10.3. Statistical Modeling
21. MARKET OPPORTUNITIES BASED ON TYPE OF ELECTRONIC VEHICLE
- 21.1. Chapter Overview
- 21.2. Key Assumptions and Methodology
- 21.3. Revenue Shift Analysis
- 21.4. Market Movement Analysis
- 21.5. Penetration-Growth (P-G) Matrix
- 21.6. Solar Vehicle Market for Battery Electric Vehicle: Historical Trends (Since 2019) and Forecasted Estimates (Till 2035)
- 21.7. Solar Vehicle Market for Hybrid Electric Vehicle: Historical Trends (Since 2019) and Forecasted Estimates (Till 2035)
- 21.8. Data Triangulation and Validation
- 21.8.1. Secondary Sources
- 21.8.2. Primary Sources
- 21.8.3. Statistical Modeling
22. MARKET OPPORTUNITIES BASED ON TYPE OF SOLAR PANEL
- 22.1. Chapter Overview
- 22.2. Key Assumptions and Methodology
- 22.3. Revenue Shift Analysis
- 22.4. Market Movement Analysis
- 22.5. Penetration-Growth (P-G) Matrix
- 22.6. Solar Vehicle Market for Monocrystalline: Historical Trends (Since 2019) and Forecasted Estimates (Till 2035)
- 22.7. Solar Vehicle Market for Polycrystalline: Historical Trends (Since 2019) and Forecasted Estimates (Till 2035)
- 22.8. Solar Vehicle Market for Thin Film: Historical Trends (Since 2019) and Forecasted Estimates (Till 2035)
- 22.9. Data Triangulation and Validation
- 22.9.1. Secondary Sources
- 22.9.2. Primary Sources
- 22.9.3. Statistical Modeling
23. MARKET OPPORTUNITIES BASED ON TYPE OF ENTERPRISE
- 23.1. Chapter Overview
- 23.2. Key Assumptions and Methodology
- 23.3. Revenue Shift Analysis
- 23.4. Market Movement Analysis
- 23.5. Penetration-Growth (P-G) Matrix
- 23.6. Solar Vehicle Market for Large: Historical Trends (Since 2019) and Forecasted Estimates (Till 2035)
- 23.7. Solar Vehicle Market for Small and Medium Enterprise: Historical Trends (Since 2019) and Forecasted Estimates (Till 2035)
- 23.8. Data Triangulation and Validation
- 23.8.1. Secondary Sources
- 23.8.2. Primary Sources
- 23.8.3. Statistical Modeling
24. MARKET OPPORTUNITIES FOR SOLAR VEHICLE IN NORTH AMERICA
- 24.1. Chapter Overview
- 24.2. Key Assumptions and Methodology
- 24.3. Revenue Shift Analysis
- 24.4. Market Movement Analysis
- 24.5. Penetration-Growth (P-G) Matrix
- 24.6. Solar Vehicle Market in North America: Historical Trends (Since 2019) and Forecasted Estimates (Till 2035)
- 24.6.1. Solar Vehicle Market in the US: Historical Trends (Since 2019) and Forecasted Estimates (Till 2035)
- 24.6.2. Solar Vehicle Market in Canada: Historical Trends (Since 2019) and Forecasted Estimates (Till 2035)
- 24.6.3. Solar Vehicle Market in Mexico: Historical Trends (Since 2019) and Forecasted Estimates (Till 2035)
- 24.6.4. Solar Vehicle Market in Other North American Countries: Historical Trends (Since 2019) and Forecasted Estimates (Till 2035)
- 24.7. Data Triangulation and Validation
25. MARKET OPPORTUNITIES FOR SOLAR VEHICLE IN EUROPE
- 25.1. Chapter Overview
- 25.2. Key Assumptions and Methodology
- 25.3. Revenue Shift Analysis
- 25.4. Market Movement Analysis
- 25.5. Penetration-Growth (P-G) Matrix
- 25.6. Solar Vehicle Market in Europe: Historical Trends (Since 2019) and Forecasted Estimates (Till 2035)
- 25.6.1. Solar Vehicle Market in Austria: Historical Trends (Since 2019) and Forecasted Estimates (Till 2035)
- 25.6.2. Solar Vehicle Market in Belgium: Historical Trends (Since 2019) and Forecasted Estimates (Till 2035)
- 25.6.3. Solar Vehicle Market in Denmark: Historical Trends (Since 2019) and Forecasted Estimates (Till 2035)
- 25.6.4. Solar Vehicle Market in France: Historical Trends (Since 2019) and Forecasted Estimates (Till 2035)
- 25.6.5. Solar Vehicle Market in Germany: Historical Trends (Since 2019) and Forecasted Estimates (Till 2035)
- 25.6.6. Solar Vehicle Market in Ireland: Historical Trends (Since 2019) and Forecasted Estimates (Till 2035)
- 25.6.7. Solar Vehicle Market in Italy: Historical Trends (Since 2019) and Forecasted Estimates (Till 2035)
- 25.6.8. Solar Vehicle Market in Netherlands: Historical Trends (Since 2019) and Forecasted Estimates (Till 2035)
- 25.6.9. Solar Vehicle Market in Norway: Historical Trends (Since 2019) and Forecasted Estimates (Till 2035)
- 25.6.10. Solar Vehicle Market in Russia: Historical Trends (Since 2019) and Forecasted Estimates (Till 2035)
- 25.6.11. Solar Vehicle Market in Spain: Historical Trends (Since 2019) and Forecasted Estimates (Till 2035)
- 25.6.12. Solar Vehicle Market in Sweden: Historical Trends (Since 2019) and Forecasted Estimates (Till 2035)
- 25.6.13. Solar Vehicle Market in Switzerland: Historical Trends (Since 2019) and Forecasted Estimates (Till 2035)
- 25.6.14. Solar Vehicle Market in the UK: Historical Trends (Since 2019) and Forecasted Estimates (Till 2035)
- 25.6.15. Solar Vehicle Market in Other European Countries: Historical Trends (Since 2019) and Forecasted Estimates (Till 2035)
- 25.7. Data Triangulation and Validation
26. MARKET OPPORTUNITIES FOR SOLAR VEHICLE IN ASIA
- 26.1. Chapter Overview
- 26.2. Key Assumptions and Methodology
- 26.3. Revenue Shift Analysis
- 26.4. Market Movement Analysis
- 26.5. Penetration-Growth (P-G) Matrix
- 26.6. Solar Vehicle Market in Asia: Historical Trends (Since 2019) and Forecasted Estimates (Till 2035)
- 26.6.1. Solar Vehicle Market in China: Historical Trends (Since 2019) and Forecasted Estimates (Till 2035)
- 26.6.2. Solar Vehicle Market in India: Historical Trends (Since 2019) and Forecasted Estimates (Till 2035)
- 26.6.3. Solar Vehicle Market in Japan: Historical Trends (Since 2019) and Forecasted Estimates (Till 2035)
- 26.6.4. Solar Vehicle Market in Singapore: Historical Trends (Since 2019) and Forecasted Estimates (Till 2035)
- 26.6.5. Solar Vehicle Market in South Korea: Historical Trends (Since 2019) and Forecasted Estimates (Till 2035)
- 26.6.6. Solar Vehicle Market in Other Asian Countries: Historical Trends (Since 2019) and Forecasted Estimates (Till 2035)
- 26.7. Data Triangulation and Validation
27. MARKET OPPORTUNITIES FOR SOLAR VEHICLE IN MIDDLE EAST AND NORTH AFRICA (MENA)
- 27.1. Chapter Overview
- 27.2. Key Assumptions and Methodology
- 27.3. Revenue Shift Analysis
- 27.4. Market Movement Analysis
- 27.5. Penetration-Growth (P-G) Matrix
- 27.6. Solar Vehicle Market in Middle East and North Africa (MENA): Historical Trends (Since 2019) and Forecasted Estimates (Till 2035)
- 27.6.1. Solar Vehicle Market in Egypt: Historical Trends (Since 2019) and Forecasted Estimates (Till 205)
- 27.6.2. Solar Vehicle Market in Iran: Historical Trends (Since 2019) and Forecasted Estimates (Till 2035)
- 27.6.3. Solar Vehicle Market in Iraq: Historical Trends (Since 2019) and Forecasted Estimates (Till 2035)
- 27.6.4. Solar Vehicle Market in Israel: Historical Trends (Since 2019) and Forecasted Estimates (Till 2035)
- 27.6.5. Solar Vehicle Market in Kuwait: Historical Trends (Since 2019) and Forecasted Estimates (Till 2035)
- 27.6.6. Solar Vehicle Market in Saudi Arabia: Historical Trends (Since 2019) and Forecasted Estimates (Till 2035)
- 27.6.7. Solar Vehicle Market in United Arab Emirates (UAE): Historical Trends (Since 2019) and Forecasted Estimates (Till 2035)
- 27.6.8. Solar Vehicle Market in Other MENA Countries: Historical Trends (Since 2019) and Forecasted Estimates (Till 2035)
- 27.7. Data Triangulation and Validation
28. MARKET OPPORTUNITIES FOR SOLAR VEHICLE IN LATIN AMERICA
- 28.1. Chapter Overview
- 28.2. Key Assumptions and Methodology
- 28.3. Revenue Shift Analysis
- 28.4. Market Movement Analysis
- 28.5. Penetration-Growth (P-G) Matrix
- 28.6. Solar Vehicle Market in Latin America: Historical Trends (Since 2019) and Forecasted Estimates (Till 2035)
- 28.6.1. Solar Vehicle Market in Argentina: Historical Trends (Since 2019) and Forecasted Estimates (Till 2035)
- 28.6.2. Solar Vehicle Market in Brazil: Historical Trends (Since 2019) and Forecasted Estimates (Till 2035)
- 28.6.3. Solar Vehicle Market in Chile: Historical Trends (Since 2019) and Forecasted Estimates (Till 2035)
- 28.6.4. Solar Vehicle Market in Colombia Historical Trends (Since 2019) and Forecasted Estimates (Till 2035)
- 28.6.5. Solar Vehicle Market in Venezuela: Historical Trends (Since 2019) and Forecasted Estimates (Till 2035)
- 28.6.6. Solar Vehicle Market in Other Latin American Countries: Historical Trends (Since 2019) and Forecasted Estimates (Till 2035)
- 28.7. Data Triangulation and Validation
29. MARKET OPPORTUNITIES FOR SOLAR VEHICLE IN REST OF THE WORLD
- 29.1. Chapter Overview
- 29.2. Key Assumptions and Methodology
- 29.3. Revenue Shift Analysis
- 29.4. Market Movement Analysis
- 29.5. Penetration-Growth (P-G) Matrix
- 29.6. Solar Vehicle Market in Rest of the World: Historical Trends (Since 2019) and Forecasted Estimates (Till 2035)
- 29.6.1. Solar Vehicle Market in Australia: Historical Trends (Since 2019) and Forecasted Estimates (Till 2035)
- 29.6.2. Solar Vehicle Market in New Zealand: Historical Trends (Since 2019) and Forecasted Estimates (Till 2035)
- 29.6.3. Solar Vehicle Market in Other Countries
- 29.7. Data Triangulation and Validation
30. MARKET CONCENTRATION ANALYSIS: DISTRIBUTION BY LEADING PLAYERS
- 30.1. Leading Player 1
- 30.2. Leading Player 2
- 30.3. Leading Player 3
- 30.4. Leading Player 4
- 30.5. Leading Player 5
- 30.6. Leading Player 6
- 30.7. Leading Player 7
- 30.8. Leading Player 8
31. ADJACENT MARKET ANALYSIS
SECTION VII: STRATEGIC TOOLS
32. KEY WINNING STRATEGIES
33. PORTER'S FIVE FORCES ANALYSIS
34. SWOT ANALYSIS
35. VALUE CHAIN ANALYSIS
36. ROOTS STRATEGIC RECOMMENDATIONS
- 36.1. Chapter Overview
- 36.2. Key Business-related Strategies
- 36.2.1. Research & Development
- 36.2.2. Product Manufacturing
- 36.2.3. Commercialization / Go-to-Market
- 36.2.4. Sales and Marketing
- 36.3. Key Operations-related Strategies
- 36.3.1. Risk Management
- 36.3.2. Workforce
- 36.3.3. Finance
- 36.3.4. Others

