
|
시장보고서
상품코드
1920851
인공 광합성 시장 : 기술 유형별, 촉매 유형별, 용도 유형별, 최종 사용자 유형별, 지역별, 업계 동향, 예측(-2035년)Artificial Photosynthesis Market, Till 2035: Distribution by Type of Technology, Type of Catalyst, Type of Application, Type of End User, and Geographical Regions: Industry Trends and Global Forecasts |
||||||
인공 광합성 시장 개요
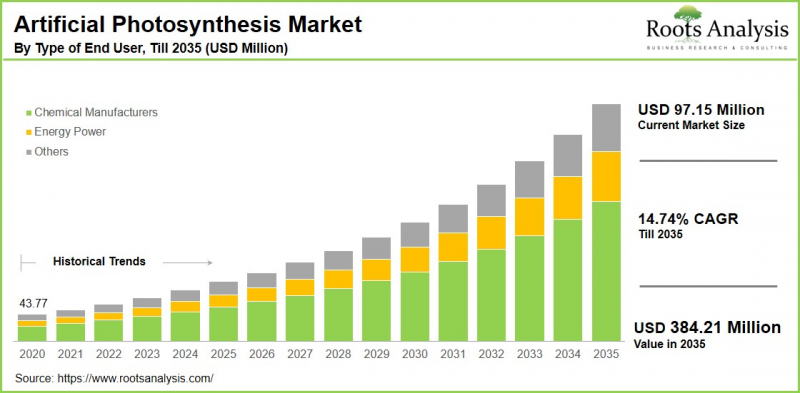
세계 인공 광합성 시장 규모는 현재 9,700만 달러에서 2035년까지 3억 8,400만 달러에 이를 것으로 추정되며, 2035년까지 예측 기간에 CAGR 14.74%로 성장할 전망입니다.

인공 광합성 시장 : 성장과 동향
인공 광합성은 태양광, 물, 이산화탄소를 포착하여 이용 가능한 태양에너지와 재생에너지를 생성하는 자연의 능력을 모방하는 고급 합성 기술입니다. 태양에너지를 화학적 형태로 변환함으로써 탄소 중립 또는 탄소 부정적인 에너지를 생성하는 수단을 제공하고, 화석 연료를 대체할 수 있는 지속가능한 대안으로서, 그리고 기후 변화 대책의 잠재적인 전략으로 확립되고 있습니다.
인공 광합성 시장은 깨끗한 태양에너지 기술의 발전과 그린 테크놀러지의 교차로에서 상승하고 있습니다. 중요한 점으로, 혁신은 태양광 에너지에서 발전하는 전력에 그치지 않고 첨단 광전기 화학 전지의 설계, 다기능 촉매의 개발, 산업 이용에 적합한 확장 가능한 시스템의 확립에 이릅니다. 연구가 초기 개념 증명 시스템에서 보다 효율적이고 안정적인 상업용 응용가능한 솔루션으로 전환함에 따라 지속가능한 연료인 인공 광합성 부문에 대한 투자자들의 관심이 꾸준히 커지고 있습니다.
인공 광합성 기술 시장은 기술적 진보, 탄소 중립 에너지에 대한 수요 증가, 지속 가능한 선택에 대한 대규모 세계 투자에 힘입어 급속한 확대가 예상됩니다. 연구 단계에서 대규모 상업 개발로 전환함에 따라 인공 광합성 기술은 생태 학적 장점과 큰 시장 기회를 함께 제공하는 청정 에너지 상황의 중요한 구성 요소가 될 것으로 보입니다.
이 보고서는 세계 인공 광합성 시장을 조사했으며, 시장 규모 추정 및 기회 분석, 경쟁 구도, 기업 프로파일 등의 정보를 제공합니다.
목차
제1장 프로젝트 개요
제2장 조사 방법
제3장 시장 역학
제4장 거시경제지표
제5장 주요 요약
제6장 소개
제7장 규제 시나리오
제8장 주요 기업의 종합적인 데이터베이스
제9장 경쟁 시장 상황
제10장 미개척 시장 분석
제11장 기업의 경쟁력 분석
제12장 스타트업 생태계 분석
제13장 기업 프로파일
- 장의 개요
- A-LEAF
- BASF SE
- Berkeley Lab
- Evonik Industries
- Engie
- Fujifilm
- Fujitsu
- Indian Institute of Science
- ICIQ
- Linde
- Mitsubishi Chemical
- Panasonic
- Siemens Energy
- Solaronix
- SunHydrogen
- Toshiba
- Toyota Central
- Twelve(formerly known as Opus 12)
제14장 메가트렌드 분석
제15장 미충족 요구의 분석
제16장 특허 분석
제17장 최근의 발전
제18장 세계의 인공 광합성 시장
제19장 시장 기회 : 기술 유형별
제20장 시장 기회 : 촉매 유형별
제21장 시장 기회 : 용도 유형별
제22장 시장 기회 : 최종 사용자 유형별
제23장 북미의 인공 광합성 시장 기회
제24장 유럽의 인공 광합성 시장 기회
제25장 아시아태평양의 인공 광합성 시장 기회
제26장 라틴아메리카의 인공 광합성 시장 기회
제27장 중동 및 아프리카의 인공 광합성 시장 기회
제28장 시장 집중 분석 : 주요 기업별
제29장 인접 시장 분석
제30장 중요한 성공 전략
제31장 Porter's Five Forces 분석
제32장 SWOT 분석
제33장 밸류체인 분석
제34장 Roots의 전략적 제안
제35장 1차 조사로부터의 지견
제36장 보고서 결론
제37장 표 형식 데이터
제38장 기업 및 단체의 리스트
SHW 26.02.09Artificial Photosynthesis Market Overview
As per Roots Analysis, the global artificial photosynthesis market size is estimated to grow from USD 97 million in the current year USD 384 million by 2035, at a CAGR of 14.74% during the forecast period, till 2035.
The opportunity for artificial photosynthesis market has been distributed across the following segments:
Type of Technology
- Co-electrolysis
- Nanotechnology
- Photo-electro Catalysis
- Others
Type of Catalyst
- Biomimetic Catalyst
- Hydrogen Catalyst
- Molecular Catalyst
- Semiconductor Catalyst
- Water-Oxidizing Catalyst
Type of Application
- Carbon Dioxide Utilization
- Chemicals Production
- Sustainable Fuel Production
- Hydrocarbon
- Hydrogen
- Water Purification
Type of End User
- Chemical Manufacturer
- Energy Power
- Others
Geographical Regions
- North America
- US
- Canada
- Mexico
- Other North American countries
- Europe
- Austria
- Belgium
- Denmark
- France
- Germany
- Ireland
- Italy
- Netherlands
- Norway
- Russia
- Spain
- Sweden
- Switzerland
- UK
- Other European countries
- Asia
- China
- India
- Japan
- Singapore
- South Korea
- Other Asian countries
- Latin America
- Brazil
- Chile
- Colombia
- Venezuela
- Other Latin American countries
- Middle East and North Africa
- Egypt
- Iran
- Iraq
- Israel
- Kuwait
- Saudi Arabia
- UAE
- Other MENA countries
- Rest of the World
- Australia
- New Zealand
- Other countries
Artificial Photosynthesis Market: Growth and Trends
Artificial photosynthesis represents a sophisticated synthetic method that emulates nature's ability to capture sunlight, water, and carbon dioxide to produce usable solar and renewable energy. By converting solar energy into chemical forms, it provides a way to generate energy that is either carbon-neutral or carbon-negative, establishing itself as a sustainable alternative to fossil fuels and a potential strategy for addressing climate change.
The market for artificial photosynthesis is emerging at the intersection of clean solar energy advancements and green technologies. Importantly, innovation extends beyond just the electricity produced from solar energy, encompassing the design of advanced photoelectrochemical cells, the development of multifunctional catalysts, and the establishment of scalable systems suitable for industrial use. The interest from investors in the sustainable fuel artificial photosynthesis sector is consistently increasing as research shifts from initial proof-of-concept systems to more efficient, steady, and commercially applicable solutions.
The market for artificial photosynthesis technology is poised for rapid expansion, fueled by technological advancements, increasing demand for carbon-neutral energy, and substantial global investment in sustainable options. As it transitions from research to large-scale commercial deployment, it is set to become an essential component of the clean energy landscape, offering both ecological advantages and considerable market opportunities.
Artificial Photosynthesis Market: Key Segments
Market Share by Type of Technology
Based on type of technology, the global artificial photosynthesis market is segmented into, co-electrolysis, nanotechnology, photo-electro catalysis and others. According to our estimates, currently, the co-electrolysis sub-segment captures the majority of the market share. This is due to the promising applications of co-electrolysis technology in generating green hydrogen through photosynthesis, which serves as a clean and sustainable energy carrier, in addition to producing other carbon-based fuels and chemicals.
On the other hand, the photo-electro catalysis sub-segment is projected to experience a relatively higher CAGR during the forecast period. This is due to the continuous advancements in nanotechnology and materials science that is improving the efficiency and longevity of photo-electrocatalytic systems.
Market Share by Type of Catalyst
Based on type of catalyst, the global artificial photosynthesis market is segmented into biomimetic catalyst, hydrogen catalyst, molecular catalyst, semiconductor catalyst and water-oxidizing catalyst. According to our estimates, currently, the semiconductor catalysts sub-segment captures the majority of the market share. This increase can be attributed to their extensive use in numerous energy applications, especially in photocatalysis for water splitting and solar-to-chemical conversion technologies. The increasing need for renewable energy is also driving the market forward.
Market Share by Type of Application
Based on type of application, the global artificial photosynthesis market is segmented into carbon dioxide utilization, chemicals production, sustainable fuel production, hydrocarbon, hydrogen and water purification. According to our estimates, currently, the sustainable fuel artificial photosynthesis sub-segment captures the majority of the market share. This increase is fueled by the rising application of hydrocarbons for heating, electricity generation, and as fuels. The adaptability and high energy density of hydrocarbons render them suitable and practical for numerous end-use applications, such as feedstock for petrochemical facilities, chemicals, and synthetic rubber.
Market Share by Type of End User
Based on type of end user, the global artificial photosynthesis market is segmented into chemical manufacturer, energy power and others. According to our estimates, currently, the chemical manufacturer segment captures the majority of the market share. This growth can be attributed to the increasing demand for advanced solar-to-chemical conversion technologies and a variety of chemicals, including hydrocarbons.
On the other hand, the energy power segment is projected to experience a relatively higher CAGR during the forecast period. This growth can be attributed to technological advancements in catalysts, nanotechnology, and photoelectrochemical systems. Additionally, substantial government funding, increased investments, and the expanding hydrogen economy are driving the rapid expansion of this sub-segment.
Market Share by Geographical Regions
Based on geographical regions, the artificial photosynthesis market is segmented into North America, Europe, Asia, Latin America, Middle East and North Africa, and the rest of the world. According to our estimates, currently North America captures the majority share of the market, owing to the favorable policies and programs implemented by the North American government for long-term modernization and development initiatives. In contrast, the trends in the artificial photosynthesis market for the Asia-Pacific region indicate the highest growth rate during the forecast period.
Example Players in Artificial Photosynthesis Market
- A-LEAF
- BASF
- Berkeley Lab
- Evonik Industries
- Engie
- Fujifilm
- Fujitsu
- Indian Institute of Science
- ICIQ
- Linde
- Mitsubishi Chemical
- Panasonic
- Siemens Energy
- Solaronix
- SunHydrogen
- Toshiba
- Toyota Central
- Twelve (formerly known as Opus 12)
Artificial Photosynthesis Market: Research Coverage
The report on the artificial photosynthesis market features insights on various sections, including:
- Market Sizing and Opportunity Analysis: An in-depth analysis of the artificial photosynthesis market, focusing on key market segments, including [A] type of technology, [B] type of catalyst, [C] type of application, [D] type of end user, and [E] geographical regions.
- Competitive Landscape: A comprehensive analysis of the companies engaged in the artificial photosynthesis market, based on several relevant parameters, such as [A] year of establishment, [B] company size, [C] location of headquarters and [D] ownership structure.
- Company Profiles: Elaborate profiles of prominent players engaged in the artificial photosynthesis market, providing details on [A] location of headquarters, [B] company size, [C] company mission, [D] company footprint, [E] management team, [F] contact details, [G] financial information, [H] operating business segments, [I] portfolio, [J] moat analysis, [K] recent developments, and an informed future outlook.
- Megatrends: An evaluation of ongoing megatrends in the artificial photosynthesis industry.
- Patent Analysis: An insightful analysis of patents filed / granted in the artificial photosynthesis domain, based on relevant parameters, including [A] type of patent, [B] patent publication year, [C] patent age and [D] leading players.
- Recent Developments: An overview of the recent developments made in the artificial photosynthesis market, along with analysis based on relevant parameters, including [A] year of initiative, [B] type of initiative, [C] geographical distribution and [D] most active players.
- Porter's Five Forces Analysis: An analysis of five competitive forces prevailing in the artificial photosynthesis market, including threats of new entrants, bargaining power of buyers, bargaining power of suppliers, threats of substitute products and rivalry among existing competitors.
- SWOT Analysis: An insightful SWOT framework, highlighting the strengths, weaknesses, opportunities and threats in the domain. Additionally, it provides Harvey ball analysis, highlighting the relative impact of each SWOT parameter.
- Value Chain Analysis: A comprehensive analysis of the value chain, providing information on the different phases and stakeholders involved in the artificial photosynthesis market.
Key Questions Answered in this Report
- How many companies are currently engaged in artificial photosynthesis market?
- Which are the leading companies in this market?
- What factors are likely to influence the evolution of this market?
- What is the current and future market size?
- What is the CAGR of this market?
- How is the current and future market opportunity likely to be distributed across key market segments?
Reasons to Buy this Report
- The report provides a comprehensive market analysis, offering detailed revenue projections of the overall market and its specific sub-segments. This information is valuable to both established market leaders and emerging entrants.
- Stakeholders can leverage the report to gain a deeper understanding of the competitive dynamics within the market. By analyzing the competitive landscape, businesses can make informed decisions to optimize their market positioning and develop effective go-to-market strategies.
- The report offers stakeholders a comprehensive overview of the market, including key drivers, barriers, opportunities, and challenges. This information empowers stakeholders to stay abreast of market trends and make data-driven decisions to capitalize on growth prospects.
Additional Benefits
- Complimentary Excel Data Packs for all Analytical Modules in the Report
- 15% Free Content Customization
- Detailed Report Walkthrough Session with Research Team
- Free Updated report if the report is 6-12 months old or older
TABLE OF CONTENTS
1. PROJECT OVERVIEW
- 1.1. Context
- 1.2. Project Objectives
2. RESEARCH METHODOLOGY
- 2.1. Chapter Overview
- 2.2. Research Assumptions
- 2.3. Database Building
- 2.3.1. Data Collection
- 2.3.2. Data Validation
- 2.3.3. Data Analysis
- 2.4. Project Methodology
- 2.4.1. Secondary Research
- 2.4.1.1. Annual Reports
- 2.4.1.2. Academic Research Papers
- 2.4.1.3. Company Websites
- 2.4.1.4. Investor Presentations
- 2.4.1.5. Regulatory Filings
- 2.4.1.6. White Papers
- 2.4.1.7. Industry Publications
- 2.4.1.8. Conferences and Seminars
- 2.4.1.9. Government Portals
- 2.4.1.10. Media and Press Releases
- 2.4.1.11. Newsletters
- 2.4.1.12. Industry Databases
- 2.4.1.13. Roots Proprietary Databases
- 2.4.1.14. Paid Databases and Sources
- 2.4.1.15. Social Media Portals
- 2.4.1.16. Other Secondary Sources
- 2.4.2. Primary Research
- 2.4.2.1. Introduction
- 2.4.2.2. Types
- 2.4.2.2.1. Qualitative
- 2.4.2.2.2. Quantitative
- 2.4.2.3. Advantages
- 2.4.2.4. Techniques
- 2.4.2.4.1. Interviews
- 2.4.2.4.2. Surveys
- 2.4.2.4.3. Focus Groups
- 2.4.2.4.4. Observational Research
- 2.4.2.4.5. Social Media Interactions
- 2.4.2.5. Stakeholders
- 2.4.2.5.1. Company Executives (CXOs)
- 2.4.2.5.2. Board of Directors
- 2.4.2.5.3. Company Presidents and Vice Presidents
- 2.4.2.5.4. Key Opinion Leaders
- 2.4.2.5.5. Research and Development Heads
- 2.4.2.5.6. Technical Experts
- 2.4.2.5.7. Subject Matter Experts
- 2.4.2.5.8. Scientists
- 2.4.2.5.9. Doctors and Other Healthcare Providers
- 2.4.2.6. Ethics and Integrity
- 2.4.2.6.1. Research Ethics
- 2.4.2.6.2. Data Integrity
- 2.4.3. Analytical Tools and Databases
- 2.4.1. Secondary Research
3. MARKET DYNAMICS
- 3.1. Forecast Methodology
- 3.1.1. Top-Down Approach
- 3.1.2. Bottom-Up Approach
- 3.1.3. Hybrid Approach
- 3.2. Market Assessment Framework
- 3.2.1. Total Addressable Market (TAM)
- 3.2.2. Serviceable Addressable Market (SAM)
- 3.2.3. Serviceable Obtainable Market (SOM)
- 3.2.4. Currently Acquired Market (CAM)
- 3.3. Forecasting Tools and Techniques
- 3.3.1. Qualitative Forecasting
- 3.3.2. Correlation
- 3.3.3. Regression
- 3.3.4. Time Series Analysis
- 3.3.5. Extrapolation
- 3.3.6. Convergence
- 3.3.7. Forecast Error Analysis
- 3.3.8. Data Visualization
- 3.3.9. Scenario Planning
- 3.3.10. Sensitivity Analysis
- 3.4. Key Considerations
- 3.4.1. Demographics
- 3.4.2. Market Access
- 3.4.3. Reimbursement Scenarios
- 3.4.4. Industry Consolidation
- 3.5. Robust Quality Control
- 3.6. Key Market Segmentations
- 3.7. Limitations
4. MACRO-ECONOMIC INDICATORS
- 4.1. Chapter Overview
- 4.2. Market Dynamics
- 4.2.1. Time Period
- 4.2.1.1. Historical Trends
- 4.2.1.2. Current and Forecasted Estimates
- 4.2.2. Currency Coverage
- 4.2.2.1. Overview of Major Currencies Affecting the Market
- 4.2.2.2. Impact of Currency Fluctuations on the Industry
- 4.2.3. Foreign Exchange Impact
- 4.2.3.1. Evaluation of Foreign Exchange Rates and Their Impact on Market
- 4.2.3.2. Strategies for Mitigating Foreign Exchange Risk
- 4.2.4. Recession
- 4.2.4.1. Historical Analysis of Past Recessions and Lessons Learnt
- 4.2.4.2. Assessment of Current Economic Conditions and Potential Impact on the Market
- 4.2.5. Inflation
- 4.2.5.1. Measurement and Analysis of Inflationary Pressures in the Economy
- 4.2.5.2. Potential Impact of Inflation on the Market Evolution
- 4.2.6. Interest Rates
- 4.2.6.1. Overview of Interest Rates and Their Impact on the Market
- 4.2.6.2. Strategies for Managing Interest Rate Risk
- 4.2.7. Commodity Flow Analysis
- 4.2.7.1. Type of Commodity
- 4.2.7.2. Origins and Destinations
- 4.2.7.3. Values and Weights
- 4.2.7.4. Modes of Transportation
- 4.2.8. Global Trade Dynamics
- 4.2.8.1. Import Scenario
- 4.2.8.2. Export Scenario
- 4.2.9. War Impact Analysis
- 4.2.9.1. Russian-Ukraine War
- 4.2.9.2. Israel-Hamas War
- 4.2.10. COVID Impact / Related Factors
- 4.2.10.1. Global Economic Impact
- 4.2.10.2. Industry-specific Impact
- 4.2.10.3. Government Response and Stimulus Measures
- 4.2.10.4. Future Outlook and Adaptation Strategies
- 4.2.11. Other Indicators
- 4.2.11.1. Fiscal Policy
- 4.2.11.2. Consumer Spending
- 4.2.11.3. Gross Domestic Product (GDP)
- 4.2.11.4. Employment
- 4.2.11.5. Taxes
- 4.2.11.6. R&D Innovation
- 4.2.11.7. Stock Market Performance
- 4.2.11.8. Supply Chain
- 4.2.11.9. Cross-Border Dynamics
- 4.2.1. Time Period
- 4.3. Concluding Remarks
5. EXECUTIVE SUMMARY
6. INTRODUCTION
- 6.1. Overview of Artificial Photosynthesis Market
- 6.2. Applications for Artificial Photosynthesis Solutions
- 6.3. Advantages of Artificial Photosynthesis
- 6.4. Challenges with Artificial Photosynthesis
- 6.5. Future Perspective
7. REGULATORY SCENARIO
8. COMPREHENSIVE DATABASE OF LEADING PLAYERS
9. COMPETITIVE MARKET LANDSCAPE
- 9.1. Chapter Overview
- 9.2. Artificial Photosynthesis Market: Overall Market Landscape
- 9.2.1. Analysis by Year of Establishment
- 9.2.2. Analysis by Company Size
- 9.2.3. Analysis by Location of Headquarters
- 9.2.4. Analysis by Type of Company
- 9.3. Key Findings
10. WHITE SPACE ANALYSIS
11. COMPANY COMPETITIVENESS ANALYSIS
12. STARTUP ECOSYSTEM ANALYSIS
- 12.1. Artificial Photosynthesis Market: Startup Ecosystem Analysis
- 12.1.1. Analysis by Year of Establishment
- 12.1.2. Analysis by Company Size
- 12.1.3. Analysis by Location of Headquarters
- 12.1.4. Analysis by Ownership Type
- 12.2. Key Findings
13. COMPANY PROFILES
- 13.1. Chapter Overview
- 13.2. A-LEAF*
- 13.2.1. Company Overview
- 13.2.2. Company Mission
- 13.2.3. Company Footprint
- 13.2.4. Management Team
- 13.2.5. Contact Details
- 13.2.6. Financial Performance
- 13.2.7. Operating Business Segments
- 13.2.8. Service / Product Portfolio (project specific)
- 13.2.9. MOAT Analysis
- 13.2.10. Recent Developments and Future Outlook
- similar details are presented for other below mentioned companies based on information in the public domain
- 13.3. BASF SE
- 13.4. Berkeley Lab
- 13.5. Evonik Industries
- 13.6. Engie
- 13.7. Fujifilm
- 13.8. Fujitsu
- 13.9. Indian Institute of Science
- 13.10. ICIQ
- 13.11. Linde
- 13.12. Mitsubishi Chemical
- 13.13. Panasonic
- 13.14. Siemens Energy
- 13.15. Solaronix
- 13.16. SunHydrogen
- 13.17. Toshiba
- 13.18. Toyota Central
- 13.19. Twelve (formerly known as Opus 12)
14. MEGA TRENDS ANALYSIS
15. UNMET NEED ANALYSIS
16. PATENT ANALYSIS
17. RECENT DEVELOPMENTS
- 17.1. Chapter Overview
- 17.2. Recent Funding
- 17.3. Recent Partnerships
- 17.4. Other Recent Initiatives
18. GLOBAL ARTIFICIAL PHOTOSYNTHESIS MARKET
- 18.1. Chapter Overview
- 18.2. Key Assumptions and Methodology
- 18.3. Trends Disruption Impacting Market
- 18.4. Demand Side Trends
- 18.5. Supply Side Trends
- 18.6. Global Artificial Photosynthesis Market, Historical Trends (Since 2020) and Forecasted Estimates (Till 2035)
- 18.7. Multivariate Scenario Analysis
- 18.7.1. Conservative Scenario
- 18.7.2. Optimistic Scenario
- 18.8. Investment Feasibility Index
- 18.9. Key Market Segmentations
19. MARKET OPPORTUNITIES BASED ON TYPE OF TECHNOLOGY
- 19.1. Chapter Overview
- 19.2. Key Assumptions and Methodology
- 19.3. Revenue Shift Analysis
- 19.4. Market Movement Analysis
- 19.5. Penetration-Growth (P-G) Matrix
- 19.6. Artificial Photosynthesis Market for Co-electrolysis: Historical Trends (Since 2020) and Forecasted Estimates (Till 2035)
- 19.7. Artificial Photosynthesis Market for Nanotechnology: Historical Trends (Since 2020) and Forecasted Estimates (Till 2035)
- 19.8. Artificial Photosynthesis Market for Photo-electro Catalysis: Historical Trends (Since 2020) and Forecasted Estimates (Till 2035)
- 19.9. Artificial Photosynthesis Market for Others: Historical Trends (Since 2020) and Forecasted Estimates (Till 2035)
- 19.10. Data Triangulation and Validation
- 19.10.1. Secondary Sources
- 19.10.2. Primary Sources
- 19.10.3. Statistical Modeling
20. MARKET OPPORTUNITIES BASED ON TYPE OF CATALYST
- 20.1. Chapter Overview
- 20.2. Key Assumptions and Methodology
- 20.3. Revenue Shift Analysis
- 20.4. Market Movement Analysis
- 20.5. Penetration-Growth (P-G) Matrix
- 20.6. Artificial Photosynthesis Market for Biomimetic Catalyst: Historical Trends (Since 2020) and Forecasted Estimates (Till 2035)
- 20.7. Artificial Photosynthesis Market for Hydrogen Catalyst: Historical Trends (Since 2020) and Forecasted Estimates (Till 2035)
- 20.8. Artificial Photosynthesis Market for Molecular Catalyst: Historical Trends (Since 2020) and Forecasted Estimates (Till 2035)
- 20.9. Artificial Photosynthesis Market for Semiconductor Catalyst: Historical Trends (Since 2020) and Forecasted Estimates (Till 2035)
- 20.10. Artificial Photosynthesis Market for Water-Oxidizing Catalyst: Historical Trends (Since 2020) and Forecasted Estimates (Till 2035)
- 20.11. Data Triangulation and Validation
- 20.11.1. Secondary Sources
- 20.11.2. Primary Sources
- 20.11.3. Statistical Modeling
21. MARKET OPPORTUNITIES BASED ON TYPE OF APPLICATION
- 21.1. Chapter Overview
- 21.2. Key Assumptions and Methodology
- 21.3. Revenue Shift Analysis
- 21.4. Market Movement Analysis
- 21.5. Penetration-Growth (P-G) Matrix
- 21.6. Artificial Photosynthesis Market for Carbon Dioxide Utilization: Historical Trends (Since 2020) and Forecasted Estimates (Till 2035)
- 21.7. Artificial Photosynthesis Market for Chemicals Production: Historical Trends (Since 2020) and Forecasted Estimates (Till 2035)
- 21.8. Artificial Photosynthesis Market for Sustainable Fuel Production: Historical Trends (Since 2020) and Forecasted Estimates (Till 2035)
- 21.8.1. Artificial Photosynthesis Sustainable Fuel Production Market for Hydrocarbon: Historical Trends (Since 2020) and Forecasted Estimates (Till 2035)
- 21.8.2. Artificial Photosynthesis Sustainable Fuel Production Market for Hydrogen: Historical Trends (Since 2020) and Forecasted Estimates (Till 2035)
- 21.9. Artificial Photosynthesis Market for Water Purification: Historical Trends (Since 2020) and Forecasted Estimates (Till 2035)
- 21.10. Data Triangulation and Validation
- 21.10.1. Secondary Sources
- 21.10.2. Primary Sources
- 21.10.3. Statistical Modeling
22. MARKET OPPORTUNITIES BASED ON TYPE OF END USER
- 22.1. Chapter Overview
- 22.2. Key Assumptions and Methodology
- 22.3. Revenue Shift Analysis
- 22.4. Market Movement Analysis
- 22.5. Penetration-Growth (P-G) Matrix
- 22.6. Artificial Photosynthesis Market for Chemical Manufacturer: Historical Trends (Since 2020) and Forecasted Estimates (Till 2035)
- 22.7. Artificial Photosynthesis Market for Energy Power: Historical Trends (Since 2020) and Forecasted Estimates (Till 2035)
- 22.8. Artificial Photosynthesis Market for Others: Historical Trends (Since 2020) and Forecasted Estimates (Till 2035)
- 22.9. Data Triangulation and Validation
- 22.9.1. Secondary Sources
- 22.9.2. Primary Sources
- 22.9.3. Statistical Modeling
23. MARKET OPPORTUNITIES FOR ARTIFICIAL PHOTOSYNTHESIS IN NORTH AMERICA
- 23.1. Chapter Overview
- 23.2. Key Assumptions and Methodology
- 23.3. Revenue Shift Analysis
- 23.4. Market Movement Analysis
- 23.5. Penetration-Growth (P-G) Matrix
- 23.6. Artificial Photosynthesis Market in North America: Historical Trends (Since 2020) and Forecasted Estimates (Till 2035)
- 23.6.1. Artificial Photosynthesis Market in the US: Historical Trends (Since 2020) and Forecasted Estimates (Till 2035)
- 23.6.2. Artificial Photosynthesis Market in Canada: Historical Trends (Since 2020) and Forecasted Estimates (Till 2035)
- 23.7. Data Triangulation and Validation
24. MARKET OPPORTUNITIES FOR ARTIFICIAL PHOTOSYNTHESIS IN EUROPE
- 24.1. Chapter Overview
- 24.2. Key Assumptions and Methodology
- 24.3. Revenue Shift Analysis
- 24.4. Market Movement Analysis
- 24.5. Penetration-Growth (P-G) Matrix
- 24.6. Artificial Photosynthesis Market in Europe: Historical Trends (Since 2020) and Forecasted Estimates (Till 2035)
- 24.6.1. Artificial Photosynthesis Market in Austria: Historical Trends (Since 2020) and Forecasted Estimates (Till 2035)
- 24.6.2. Artificial Photosynthesis Market in Belgium: Historical Trends (Since 2020) and Forecasted Estimates (Till 2035)
- 24.6.3. Artificial Photosynthesis Market in Denmark: Historical Trends (Since 2020) and Forecasted Estimates (Till 2035)
- 24.6.4. Artificial Photosynthesis Market in France: Historical Trends (Since 2020) and Forecasted Estimates (Till 2035)
- 24.6.5. Artificial Photosynthesis Market in Germany: Historical Trends (Since 2020) and Forecasted Estimates (Till 2035)
- 24.6.6. Artificial Photosynthesis Market in Ireland: Historical Trends (Since 2020) and Forecasted Estimates (Till 2035)
- 24.6.7. Artificial Photosynthesis Market in Italy: Historical Trends (Since 2020) and Forecasted Estimates (Till 2035)
- 24.6.8. Artificial Photosynthesis Market in Netherlands: Historical Trends (Since 2020) and Forecasted Estimates (Till 2035)
- 24.6.9. Artificial Photosynthesis Market in Norway: Historical Trends (Since 2020) and Forecasted Estimates (Till 2035)
- 24.6.10. Artificial Photosynthesis Market in Russia: Historical Trends (Since 2020) and Forecasted Estimates (Till 2035)
- 24.6.11. Artificial Photosynthesis Market in Spain: Historical Trends (Since 2020) and Forecasted Estimates (Till 2035)
- 24.6.12. Artificial Photosynthesis Market in Sweden: Historical Trends (Since 2020) and Forecasted Estimates (Till 2035)
- 24.6.13. Artificial Photosynthesis Market in Switzerland: Historical Trends (Since 2020) and Forecasted Estimates (Till 2035)
- 24.6.14. Artificial Photosynthesis Market in the UK: Historical Trends (Since 2020) and Forecasted Estimates (Till 2035)
- 24.6.15. Artificial Photosynthesis Market in Rest of Europe: Historical Trends (Since 2020) and Forecasted Estimates (Till 2035)
- 24.7. Data Triangulation and Validation
25. MARKET OPPORTUNITIES FOR ARTIFICIAL PHOTOSYNTHESIS IN ASIA-PACIFIC
- 25.1. Chapter Overview
- 25.2. Key Assumptions and Methodology
- 25.3. Revenue Shift Analysis
- 25.4. Market Movement Analysis
- 25.5. Penetration-Growth (P-G) Matrix
- 25.6. Artificial Photosynthesis Market in Asia-Pacific: Historical Trends (Since 2020) and Forecasted Estimates (Till 2035)
- 25.6.1. Artificial Photosynthesis Market in Australia: Historical Trends (Since 2020) and Forecasted Estimates (Till 2035)
- 25.6.2. Artificial Photosynthesis Market in China: Historical Trends (Since 2020) and Forecasted Estimates (Till 2035)
- 25.6.3. Artificial Photosynthesis Market in India: Historical Trends (Since 2020) and Forecasted Estimates (Till 2035)
- 25.6.4. Artificial Photosynthesis Market in Japan: Historical Trends (Since 2020) and Forecasted Estimates (Till 2035)
- 25.6.5. Artificial Photosynthesis Market in New Zealand: Historical Trends (Since 2020) and Forecasted Estimates (Till 2035)
- 25.6.6. Artificial Photosynthesis Market in Singapore: Historical Trends (Since 2020) and Forecasted Estimates (Till 2035)
- 25.6.7. Artificial Photosynthesis Market in South Korea: Historical Trends (Since 2020) and Forecasted Estimates (Till 2035)
- 25.6.8. Artificial Photosynthesis Market in Rest of Asia Pacific: Historical Trends (Since 2020) and Forecasted Estimates (Till 2035)
- 25.7. Data Triangulation and Validation
26. MARKET OPPORTUNITIES FOR ARTIFICIAL PHOTOSYNTHESIS IN LATIN AMERICA
- 26.1. Chapter Overview
- 26.2. Key Assumptions and Methodology
- 26.3. Revenue Shift Analysis
- 26.4. Market Movement Analysis
- 26.5. Penetration-Growth (P-G) Matrix
- 26.6. Artificial Photosynthesis Market in Latin America: Historical Trends (Since 2020) and Forecasted Estimates (Till 2035)
- 26.6.1. Artificial Photosynthesis Market in Argentina: Historical Trends (Since 2020) and Forecasted Estimates (Till 2035)
- 26.6.2. Artificial Photosynthesis Market in Brazil: Historical Trends (Since 2020) and Forecasted Estimates (Till 2035)
- 26.6.3. Artificial Photosynthesis Market in Chile: Historical Trends (Since 2020) and Forecasted Estimates (Till 2035)
- 26.6.4. Artificial Photosynthesis Market in Colombia Historical Trends (Since 2020) and Forecasted Estimates (Till 2035)
- 26.6.5. Artificial Photosynthesis Market in Venezuela: Historical Trends (Since 2020) and Forecasted Estimates (Till 2035)
- 26.6.6. Artificial Photosynthesis Market in Rest of Latin America: Historical Trends (Since 2020) and Forecasted Estimates (Till 2035)
- 26.7. Data Triangulation and Validation
27. MARKET OPPORTUNITIES FOR ARTIFICIAL PHOTOSYNTHESIS IN THE MIDDLE EAST AND AFRICA (MEA)
- 27.1. Chapter Overview
- 27.2. Key Assumptions and Methodology
- 27.3. Revenue Shift Analysis
- 27.4. Market Movement Analysis
- 27.5. Penetration-Growth (P-G) Matrix
- 27.6. Artificial Photosynthesis Market in Middle East and Africa (MEA): Historical Trends (Since 2020) and Forecasted Estimates (Till 2035)
- 27.6.1. Artificial Photosynthesis Market in Australia: Historical Trends (Since 2020) and Forecasted Estimates (Till 205)
- 27.6.2. Artificial Photosynthesis Market in Egypt: Historical Trends (Since 2020) and Forecasted Estimates (Till 205)
- 27.6.3. Artificial Photosynthesis Market in Iran: Historical Trends (Since 2020) and Forecasted Estimates (Till 2035)
- 27.6.4. Artificial Photosynthesis Market in Iraq: Historical Trends (Since 2020) and Forecasted Estimates (Till 2035)
- 27.6.5. Artificial Photosynthesis Market in Israel: Historical Trends (Since 2020) and Forecasted Estimates (Till 2035)
- 27.6.6. Artificial Photosynthesis Market in Kuwait: Historical Trends (Since 2020) and Forecasted Estimates (Till 2035)
- 27.6.7. Artificial Photosynthesis Market in New Zealand: Historical Trends (Since 2020) and Forecasted Estimates (Till 205)
- 27.6.8. Artificial Photosynthesis Market in Saudi Arabia: Historical Trends (Since 2020) and Forecasted Estimates (Till 2035)
- 27.6.9. Artificial Photosynthesis Market in United Arab Emirates (UAE): Historical Trends (Since 2020) and Forecasted Estimates (Till 2035)
- 27.6.10. Artificial Photosynthesis Market in Rest of MEA: Historical Trends (Since 2020) and Forecasted Estimates (Till 2035)
- 27.7. Data Triangulation and Validation
28. MARKET CONCENTRATION ANALYSIS: DISTRIBUTION BY LEADING PLAYERS
- 28.1. Leading Player 1
- 28.2. Leading Player 2
- 28.3. Leading Player 3
- 28.4. Leading Player 4
- 28.5. Leading Player 5
- 28.6. Leading Player 6
- 28.7. Leading Player 7
- 28.8. Leading Player 8
29. ADJACENT MARKET ANALYSIS
30. KEY WINNING STRATEGIES
31. PORTER'S FIVE FORCES ANALYSIS
32. SWOT ANALYSIS
33. VALUE CHAIN ANALYSIS
34. ROOTS STRATEGIC RECOMMENDATIONS
- 34.1. Chapter Overview
- 34.2. Key Business-related Strategies
- 34.2.1. Research & Development
- 34.2.2. Product Manufacturing
- 34.2.3. Commercialization / Go-to-Market
- 34.2.4. Sales and Marketing
- 34.3. Key Operations-related Strategies
- 34.3.1. Risk Management
- 34.3.2. Workforce
- 34.3.3. Finance
- 34.3.4. Others