
|
시장보고서
상품코드
1993583
탄소발자국 관리 시장 : 제공 형태, 도입 형태, 기업 규모, 최종 용도 산업 및 지역별 내역 - 업계 동향과 세계 예측(-2035년)Carbon Footprint Management Market: Distribution by Type of Offering, Deployment Mode, Type of Enterprise, End-use Industry, and Geographical Regions: Industry Trends and Global Forecasts, Till 2035 |
||||||
탄소발자국 관리 시장 전망
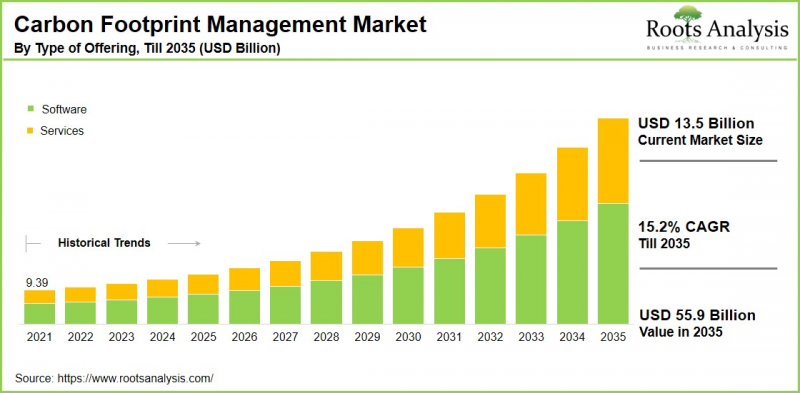
세계의 탄소발자국 관리 시장 규모는 2035년까지 CAGR 15.2%로 확대하며, 현재 135억 달러에서 2035년에는 559억 달러에 달할 것으로 추정되고 있습니다.
탄소발자국이란 활동, 프로세스 또는 제품에 의해 직간접적으로 발생하는 온실가스 배출량을 이산화탄소 환산치로 정량화한 것입니다. 이러한 배출은 에너지 사용, 산업 생산, 운송 시스템, 폐기물 관리 관행 등 다양한 원천에서 발생합니다. 탄소발자국 관리는 환경에 미치는 영향을 최소화하기 위해 배출량을 체계적으로 측정, 감축 및 상쇄하는 데 초점을 맞추고 있으며, 기후 변화에 대응하는 데 있으며, 매우 중요한 역할을 하고 있습니다.
이 체계적인 접근방식은 탄소발자국 평가, 배출원 감축, 탄소상쇄 구상 참여 등의 전략을 통해 주요 이해관계자, 특히 기업의 적극적인 참여를 유도합니다. 최근 세계 각국 정부가 탄소배출량 제로 목표를 달성하기 위해 기후 변화 완화 정책을 시행하는 가운데, 규제 강화에 힘입어 탄소발자국 관리는 세계 지속가능성 노력의 핵심 요소로 부상하고 있습니다. 경제적 관점에서 볼 때, 에너지 효율 향상 및 폐기물 감소를 통한 비용 절감과 같은 구체적인 이점이 있으므로 조직은 점점 더 많은 조직이 견고한 탄소 관리 관행을 채택하고 있습니다.
이러한 환경적, 경제적 요인이 결합되어 예측 기간 중 시장 성장을 크게 촉진할 것으로 예측됩니다.

경영진을 위한 전략적 인사이트
탄소발자국 관리 시장의 성장을 이끄는 주요 시장 성장 촉진요인들
세계 탄소발자국 관리 시장의 성장을 가속화하는 주요 요인 중 하나는 탄소 배출량을 줄이기 위한 정부 주도의 노력이 점점 더 많이 시행되고 있다는 점입니다. 이러한 노력에는 온실가스 배출을 억제하기 위해 탄소에 가격을 매기는 탄소배출권거래제(CCTS) 등의 제도가 포함됩니다. 또한 다양한 산업 분야에서 넷제로 목표가 채택되고 있는 것은 첨단 기술에 대한 수요를 크게 증가시키고 있습니다. 이를 통해 내부 지속가능성 목표와 투자자의 감시를 강화하여 정확한 탄소발자국을 추적하고 보고할 수 있게 됩니다. 또한 환경-사회-지배구조(ESG) 기준의 중요성이 높아지는 것도 시장 확대를 더욱 부추기고 있습니다. 투자자들은 우수한 환경적 성과와 투명한 지속가능성 실천을 보여주는 조직을 점점 더 선호하고 있기 때문입니다.
탄소발자국 관리 시장 - 동종업계의 기업 경쟁 구도
현재 시장 환경은 여러 지역에 걸쳐 솔루션 및 서비스를 제공할 수 있는 기술적 전문성과 운영 능력을 갖춘 크고 작은 기업이 존재한다는 특징이 있습니다. 특히 대다수의 기업(45%)이 클라우드 기반 탄소발자국 관리 솔루션을 제공합니다. 반면, On-Premise형 솔루션을 제공하는 기업의 비율은 약 4%로 비교적 적은 임베디드니다. 주요 클라우드 기반 솔루션 프로바이더로는 AiDASH, Carbon Footprint, Cority, Diligent, Envirosoft 등이 있습니다.
또한 시장내 소규모 진출기업은 틈새 수요에 대응하고 다양한 산업 분야의 미개발 기회를 활용하기 위해 적극적으로 포트폴리오를 확장하고 있습니다. Carbon Analytics, Carbon Footprint, Carbon Upcycling Technologies, Envirosoft, ESP, Green Sutra와 같은 기업은 혁신에 초점을 맞추고 경쟁력 강화를 위한 타겟팅된 솔루션 제공에 주력하고 있습니다. 솔루션 제공에 주력하고 있습니다.
탄소발자국 관리의 진화 - 업계의 새로운 동향
탄소발자국 관리 시장의 새로운 동향에는 인공지능(AI), 머신러닝, 사물인터넷(IoT)과 같은 첨단 기술의 도입이 가속화되고 있습니다. 이를 통해 배출량을 실시간으로 모니터링하고 탄소 배출량을 예측할 수 있습니다. 이러한 혁신은 기존의 탄소 배출량 추적을 업무 효율성과 컴플라이언스를 향상시키는 데이터베이스 의사결정 지원 시스템으로 전환하고 있습니다. 또 다른 중요한 동향은 확장성, 중앙 집중식 대시보드, 자동화된 온실가스(GHG) 계산 기능을 제공하는 클라우드 기반 통합 플랫폼으로의 전환입니다. 이러한 플랫폼은 조직이 점점 더 엄격해지는 규제 요건과 세계 공시 표준을 준수할 수 있도록 지원합니다.
또한 기업의 ESG에 대한 노력 강화와 지속가능성 보고 의무가 증가함에 따라 기업은 탄소 관리를 보다 광범위한 지속가능성 전략에 통합하고 있습니다.
지역별 분석 : 유럽이 탄소발자국 관리 시장을 주도하고 있습니다.
우리의 분석에 따르면 올해 유럽 탄소발자국 관리 시장이 가장 큰 점유율을 차지하고 있습니다. 이는 조직에 온실가스 배출량 측정, 공개 및 감축을 의무화하는 종합적이고 엄격한 규제 환경으로 인해 발생합니다. '유럽 그린딜(European Green Deal)'과 'CSRD(Corporate Sustainability Reporting Directive)'와 같은 강력한 정책적 프레임워크는 산업을 막론하고 첨단 탄소 회계 및 관리 솔루션에 대한 수요를 견인하는 필수적인 컴플라이언스 요건을 만들어내고 있습니다. 또한 정부의 강력한 지원, 그린 테크놀러지에 대한 막대한 공공 자금 투입, 그리고 유럽 소비자들의 높아진 환경에 대한 인식이 이러한 솔루션의 도입을 촉진하고 있습니다.
탄소발자국 관리 시장의 주요 과제
탄소발자국 관리 도입을 가로막는 주요 문제로는 표준화된 조사 방법론과 일관된 배출량 보고 프레임워크의 부족을 들 수 있습니다. 그 결과, 지역 및 산업 간 온실가스 데이터의 편차가 발생하고 비교 가능성이 낮아져 벤치마킹 및 규제 준수 노력이 복잡해졌습니다. 또한 많은 조직은 특히 복잡한 공급망에 걸친 Scope 3 배출량에 대한 정확한 데이터 수집 및 통합에 어려움을 겪고 있습니다. 이러한 문제는 공급업체들의 불일치한 보고, 시스템 파편화, 불충분한 디지털 인프라로 인해 탄소 인벤토리의 신뢰성을 저해하는 요인으로 작용하고 있습니다. 또한 탄소 회계에 대한 전문 지식을 갖춘 숙련된 인력의 부족과 규제 환경의 변화로 인해 컴플라이언스 및 전략적 계획이 더욱 복잡해지고 있습니다.
탄소발자국 관리 시장 - 주요 시장 세분화
제공 제품 유형
- 소프트웨어
- 서비스
도입 형태
- 클라우드 기반
- On-Premise
기업 규모
- 소규모 기업
- 중견기업
- 대기업
최종 사용 산업
- 에너지 및 유틸리티
- 제조업
- 주거 및 상업용 건물
- 교통-물류
- 농업
- 기타
지역
- 북미
- 미국
- 캐나다
- 멕시코
- 기타 북미 국가
- 유럽
- 오스트리아
- 벨기에
- 덴마크
- 프랑스
- 독일
- 아일랜드
- 이탈리아
- 네덜란드
- 노르웨이
- 러시아
- 스페인
- 스웨덴
- 스위스
- 영국
- 기타 유럽 국가
- 아시아
- 중국
- 인도
- 일본
- 싱가포르
- 한국
- 기타 아시아 국가
- 라틴아메리카
- 브라질
- 칠레
- 콜롬비아
- 베네수엘라
- 기타 라틴아메리카 국가
- 중동 및 북아프리카
- 이집트
- 이란
- 이라크
- 이스라엘
- 쿠웨이트
- 사우디아라비아
- 아랍에미리트
- 기타 MENA 국가
- 세계 기타 지역
- 호주
- 뉴질랜드
- 기타 국가
탄소발자국 관리 시장의 주요 기업 사례
- Carbon Footprint
- Carbon Trust
- Diligent
- EcoAct
- EnergyCAP
- ENGIE Impact
- Envirosoft
- ESP
- Optimum Energy
- SAP
- GreenSutra
탄소발자국 관리 시장 - 보고서 범위
본 탄소발자국 관리 시장 보고서는 다음과 같은 각 섹션에 대한 인사이트을 제공합니다.
- 시장 규모 및 기회 분석 :(A) 제공 형태,(B) 도입 형태,(C) 기업 유형,(D) 최종 사용 산업,(E) 지역 등 주요 시장 부문에 초점을 맞춘 탄소발자국 관리 시장에 대한 상세한 분석.
- 경쟁 구도:(A) 설립 연도,(B) 기업 규모,(C) 본사 소재지,(D) 소유 구조 등 관련 매개 변수를 기반으로 탄소발자국 관리 시장에 진출한 기업을 종합적으로 분석합니다.
- 기업 개요: 탄소발자국 관리 시장에 진출한 주요 기업의 상세한 프로파일입니다. (A) 본사 소재지, B) 기업 규모, C) 기업 이념, D) 사업 규모, E) 경영진, F) 연락처, G) 재무 정보, H) 사업 부문, I) 제품 및 기술 포트폴리오, J) 최근 동향 및 향후 전망에 대한 자세한 정보를 제공합니다.
- 메가트렌드: 탄소발자국 관리 산업에서 진행 중인 메가트렌드 평가.
- 특허 분석 :(A) 특허 유형,(B) 특허 공개 연도,(C) 특허 경과 기간,(D) 주요 기업 등 관련 파라미터를 기반으로 탄소발자국 관리 분야에서 출원 및 등록된 특허에 대한 인사이트 분석을 수행합니다.
- 최근 동향 : 탄소발자국 관리 시장의 최근 동향에 대한 개요와(A) 추진 연도,(B) 추진 방식,(C) 지역적 분포,(D) 가장 활발하게 활동하는 기업 등 관련 매개변수를 기반으로 한 분석.
- Portre's Five Forces 분석 : 탄소발자국 관리 시장에서 지배적인 5가지 경쟁 요인(신규 시장 진출기업의 위협, 구매자의 협상력, 공급업체의 협상력, 대체품의 위협, 기존 경쟁사 간 경쟁)에 대한 분석입니다.
- SWOT 분석 : 해당 분야의 강점, 약점, 기회, 위협을 부각시키는 인사이트 있는 SWOT 프레임워크입니다. 또한 각 SWOT 매개변수의 상대적 영향력을 강조하는 하비볼 분석도 제공합니다.
목차
제1장 프로젝트 개요
제2장 조사 방법
제3장 시장 역학
제4장 거시경제 지표
제5장 개요
제6장 서론
제7장 공급망 분석
제8장 규제 시나리오
제9장 탄소발자국 관리 시장 - 주요 기업
제10장 기업의 경쟁력 분석
제11장 스타트업 에코시스템 분석
제12장 기업 개요
제13장 메가트렌드
제14장 미충족 요구
제15장 탄소발자국 관리 : 주요 전략
제16장 특허 분석
제17장 세계의 탄소발자국 관리 시장
제18장 오퍼링 유형별 시장 기회
제19장 도입 형태별 시장 기회
제20장 기업 형태별 시장 기회
제21장 최종 용도 산업별 시장 기회
제22장 지역별 시장 기회
제23장 1차 조사로부터의 인사이트
제24장 결론
제25장 부록 I : 표형식 데이터
제26장 부록 II : 기업 및 조직 리스트
KSA 26.04.16Carbon Footprint Management Market Outlook
As per Roots Analysis, the global carbon footprint management market size is estimated to grow from USD 13.5 billion in current year to USD 55.9 billion by 2035, at a CAGR of 15.2% during the forecast period, till 2035.
Carbon footprint represents the quantification of greenhouse gas emissions, measured in carbon dioxide equivalent, generated directly or indirectly by activities, processes, or products. These emissions arise from a wide range of sources, including energy usage, industrial manufacturing, transportation systems, and waste management practices. Carbon footprint management focuses on systematically measuring, reducing, and offsetting emissions to minimize their environmental impact and plays a critical role in addressing climate change.
This structured approach actively involves key stakeholders, particularly businesses, through strategies such as carbon footprint assessment, emission reduction at the source, and participation in carbon offset initiatives. In recent years, carbon footprint management has emerged as a core component of global sustainability efforts, supported by increasing regulatory action as governments worldwide implement climate mitigation policies to achieve net-zero targets. From an economic standpoint, organizations are increasingly adopting robust carbon management practices due to tangible benefits, including cost savings driven by improved energy efficiency and reduced waste.
Collectively, these environmental and economic drivers are expected to significantly propel market growth over the forecast period.
Strategic Insights for Senior Leaders
Key Drivers Propelling Growth of Carbon Footprint Management Market
One of the primary drivers accelerating the growth of the global carbon footprint management market is the increasing implementation of government initiatives aimed at reducing carbon emissions. These initiatives include mechanisms such as carbon credit trading schemes (CCTS), which price carbon to help curb greenhouse gas emissions. Further, the growing adoption of net-zero commitments across multiple industries has significantly increased the demand for advanced technologies. This enables accurate carbon footprint tracking and reporting, driven by both internal sustainability objectives and heightened scrutiny from investors. Moreover, the rising prominence of environmental, social, and governance (ESG) criteria is further supporting market expansion, as investors are increasingly favoring organizations demonstrating strong environmental performance and transparent sustainability practices.
Carbon Footprint Management Market: Competitive Landscape of Companies in this Industry
The current market landscape is characterized by the presence of both small and large companies with technical expertise and operational capabilities to deliver solutions and services across multiple regions. Notably, majority of the companies (45%) offer cloud-based carbon footprint management solutions. However, a comparatively small share, approximately 4%, provides on-premise offerings; notable providers of cloud-based solutions include AiDASH, Carbon Footprint, Cority, Diligent, and Envirosoft.
Further, small players in the market are actively enhancing their portfolios to address niche requirements and capitalize on untapped opportunities across diverse industry verticals. Companies such as Carbon Analytics, Carbon Footprint, Carbon Upcycling Technologies, Envirosoft, ESP, and Green Sutra are focusing on innovation and providing targeted solutions to strengthen their competitive positioning.
Carbon Footprint Management Evolution: Emerging Trends in the Industry
Emerging trends in the carbon footprint management market include the accelerated adoption of advanced technologies, such as artificial intelligence (AI), machine learning, the Internet of Things (IoT), which are enabling real-time emissions monitoring, and forecasting of carbon outputs. These innovations are transforming traditional carbon tracking into data-driven decision support systems that enhance operational efficiency and compliance. Another important trend is the shift toward cloud-based and integrated platforms that offer scalability, centralized dashboards, and automated greenhouse gas (GHG) accounting. These platforms help organizations comply with increasingly stringent regulatory requirements and global disclosure standards.
Additionally, heightened corporate ESG commitments and sustainability reporting obligations are driving enterprises to integrate carbon management into broader sustainability strategies.
Regional Analysis: Europe Leads the Carbon Footprint Management Market
According to our analysis, in the current year, the carbon footprint management market in Europe captures the largest share. This is due to due to its comprehensive and stringent regulatory environment, which compels organizations to measure, disclose, and reduce greenhouse gas emissions. Robust policy frameworks such as the European Green Deal, the Corporate Sustainability Reporting Directive (CSRD), have created mandatory compliance requirements that drive demand for advanced carbon accounting and management solutions across industries. Further, strong governmental support, substantial public funding for green technologies, and rising environmental awareness among European consumers is driving the adoption of such solutions.
Key Challenges in Carbon Footprint Management Market
Key challenges hindering the adoption of carbon footprint management include lack of standardized methodologies and consistent emissions reporting frameworks. This results in variability and limited comparability of greenhouse gas data across regions and industries, thereby complicating benchmarking and regulatory compliance efforts. Additionally, many organizations struggle with accurate data collection and integration, particularly for Scope 3 emissions across complex supply chains. This challenge is driven by inconsistent supplier reporting, fragmented systems, and insufficient digital infrastructure, which undermines the reliability of carbon inventories. Furthermore, there is a shortage of skilled professionals with expertise in carbon accounting and an evolving regulatory landscape that adds complexity to compliance and strategic planning.
Carbon Footprint Management Market: Key Market Segmentation
Type of Offering
- Software
- Service
Deployment Mode
- Cloud-based
- On-premises
Type of Enterprise
- Small Companies
- Mid-sized Companies
- Large Companies
End Use Industry
- Energy Utilities
- Manufacturing Industry
- Residential and Commercial Buildings
- Transportation and Logistics
- Agriculture Industry
- Other Industries
Geographical Regions
- North America
- US
- Canada
- Mexico
- Other North American countries
- Europe
- Austria
- Belgium
- Denmark
- France
- Germany
- Ireland
- Italy
- Netherlands
- Norway
- Russia
- Spain
- Sweden
- Switzerland
- UK
- Other European countries
- Asia
- China
- India
- Japan
- Singapore
- South Korea
- Other Asian countries
- Latin America
- Brazil
- Chile
- Colombia
- Venezuela
- Other Latin American countries
- Middle East and North Africa
- Egypt
- Iran
- Iraq
- Israel
- Kuwait
- Saudi Arabia
- UAE
- Other MENA countries
- Rest of the World
- Australia
- New Zealand
- Other countries
Example Players in Carbon Footprint Management Market
- Carbon Footprint
- Carbon Trust
- Diligent
- EcoAct
- EnergyCAP
- ENGIE Impact
- Envirosoft
- ESP
- Optimum Energy
- SAP
- GreenSutra
Carbon Footprint Management Market: Report Coverage
The report on the carbon footprint management market features insights on various sections, including:
- Market Sizing and Opportunity Analysis: An in-depth analysis of the carbon footprint management market, focusing on key market segments, including [A] type of offering, [B] deployment mode, [C] type of enterprise, [D] end-use industry, and [E] geographical regions.
- Competitive Landscape: A comprehensive analysis of the companies engaged in the carbon footprint management market, based on several relevant parameters, such as [A] year of establishment, [B] company size, [C] location of headquarters and [D] ownership structure.
- Company Profiles: Elaborate profiles of prominent players engaged in the carbon footprint management market, providing details on [A] location of headquarters, [B] company size, [C] company mission, [D] company footprint, [E] management team, [F] contact details, [G] financial information, [H] operating business segments, [I] product / technology portfolio, [J] recent developments, and an informed future outlook.
- Megatrends: An evaluation of ongoing megatrends in the carbon footprint management industry.
- Patent Analysis: An insightful analysis of patents filed / granted in the carbon footprint management domain, based on relevant parameters, including [A] type of patent, [B] patent publication year, [C] patent age and [D] leading players.
- Recent Developments: An overview of the recent developments made in the carbon footprint management market, along with analysis based on relevant parameters, including [A] year of initiative, [B] type of initiative, [C] geographical distribution and [D] most active players.
- Porter's Five Forces Analysis: An analysis of five competitive forces prevailing in the carbon footprint management market, including threats of new entrants, bargaining power of buyers, bargaining power of suppliers, threats of substitute products and rivalry among existing competitors.
- SWOT Analysis: An insightful SWOT framework, highlighting the strengths, weaknesses, opportunities and threats in the domain. Additionally, it provides Harvey ball analysis, highlighting the relative impact of each SWOT parameter.
Key Questions Answered in this Report
- What is the current and future market size?
- Who are the leading companies in this market?
- What are the growth drivers that are likely to influence the evolution of this market?
- What are the key partnership and funding trends shaping this industry?
- Which region is likely to grow at higher CAGR till 2035?
- How is the current and future market opportunity likely to be distributed across key market segments?
Reasons to Buy this Report
- Detailed Market Analysis: The report provides a comprehensive market analysis, offering detailed revenue projections of the overall market and its specific sub-segments. This information is valuable to both established market leaders and emerging entrants.
- In-depth Analysis of Trends: Stakeholders can leverage the report to gain a deeper understanding of the competitive dynamics within the market. Each report maps ecosystem activity across partnerships, funding, and patent landscapes to reveal growth hotspots and white spaces in the industry.
- Opinion of Industry Experts: The report features extensive interviews and surveys with key opinion leaders and industry experts to validate market trends mentioned in the report.
- Decision-ready Deliverables: The report offers stakeholders with strategic frameworks (Porter's Five Forces, value chain, SWOT), and complimentary Excel / slide packs with customization support.
Additional Benefits
- Complimentary Dynamic Excel Dashboards for Analytical Modules
- Exclusive 15% Free Content Customization
- Personalized Interactive Report Walkthrough with Our Expert Research Team
- Free Report Updates for Versions Older than 6-12 Months
TABLE OF CONTENTS
1. PROJECT OVERVIEW
- 1.1. Context
- 1.2. Project Objectives
2. RESEARCH METHODOLOGY
- 2.1. Chapter Overview
- 2.2. Research Assumptions
- 2.2.1. Market Landscape and Market Trends
- 2.2.2. Market Forecast and Opportunity Analysis
- 2.2.3. Comparative Analysis
- 2.3. Database Building
- 2.3.1. Data Collection
- 2.3.2. Data Validation
- 2.3.3. Data Analysis
- 2.4. Project Methodology
- 2.4.1. Secondary Research
- 2.4.1.1. Annual Reports
- 2.4.1.2. Academic Research Papers
- 2.4.1.3. Company Websites
- 2.4.1.4. Investor Presentations
- 2.4.1.5. Regulatory Filings
- 2.4.1.6. White Papers
- 2.4.1.7. Industry Publications
- 2.4.1.8. Conferences and Seminars
- 2.4.1.9. Government Portals
- 2.4.1.10. Media and Press Releases
- 2.4.1.11. Newsletters
- 2.4.1.12. Industry Databases
- 2.4.1.13. Roots Proprietary Databases
- 2.4.1.14. Paid Databases and Sources
- 2.4.1.15. Social Media Portals
- 2.4.1.16. Other Secondary Sources
- 2.4.2. Primary Research
- 2.4.2.1. Types of Primary Research
- 2.4.2.1.1. Qualitative Research
- 2.4.2.1.2. Quantitative Research
- 2.4.2.1.3. Hybrid Approach
- 2.4.2.2. Advantages of Primary Research
- 2.4.2.3. Techniques for Primary Research
- 2.4.2.3.1. Interviews
- 2.4.2.3.2. Surveys
- 2.4.2.3.3. Focus Groups
- 2.4.2.3.4. Observational Research
- 2.4.2.3.5. Social Media Interactions
- 2.4.2.4. Key Opinion Leaders Considered in Primary Research
- 2.4.2.4.1. Company Executives (CXOs)
- 2.4.2.4.2. Board of Directors
- 2.4.2.4.3. Company Presidents and Vice Presidents
- 2.4.2.4.4. Research and Development Heads
- 2.4.2.4.5. Technical Experts
- 2.4.2.4.6. Subject Matter Experts
- 2.4.2.4.7. Scientists
- 2.4.2.4.8. Doctors and Other Healthcare Providers
- 2.4.2.5. Ethics and Integrity
- 2.4.2.5.1. Research Ethics
- 2.4.2.5.2. Data Integrity
- 2.4.2.1. Types of Primary Research
- 2.4.3. Analytical Tools and Databases
- 2.4.1. Secondary Research
- 2.5. Robust Quality Control
3. MARKET DYNAMICS
- 3.1. Chapter Overview
- 3.2. Forecast Methodology
- 3.2.1. Top-down Approach
- 3.2.2. Bottom-up Approach
- 3.2.3. Hybrid Approach
- 3.3. Market Assessment Framework
- 3.3.1. Total Addressable Market (TAM)
- 3.3.2. Serviceable Addressable Market (SAM)
- 3.3.3. Serviceable Obtainable Market (SOM)
- 3.3.4. Currently Acquired Market (CAM)
- 3.4. Forecasting Tools and Techniques
- 3.4.1. Qualitative Forecasting
- 3.4.2. Correlation
- 3.4.3. Regression
- 3.4.4. Extrapolation
- 3.4.5. Convergence
- 3.4.6. Sensitivity Analysis
- 3.4.7. Scenario Planning
- 3.4.8. Data Visualization
- 3.4.9. Time Series Analysis
- 3.4.10. Forecast Error Analysis
- 3.5. Key Considerations
- 3.5.1. Demographics
- 3.5.2. Government Regulations
- 3.5.3. Reimbursement Scenarios
- 3.5.4. Market Access
- 3.5.5. Supply Chain
- 3.5.6. Industry Consolidation
- 3.5.7. Pandemic / Unforeseen Disruptions Impact
- 3.6. Limitations
4. MACRO-ECONOMIC INDICATORS
- 4.1. Chapter Overview
- 4.2. Market Dynamics
- 4.2.1. Time Period
- 4.2.1.1. Historical Trends
- 4.2.1.2. Current and Forecasted Estimates
- 4.2.2. Currency Coverage
- 4.2.2.1. Major Currencies Affecting the Market
- 4.2.2.2. Factors Affecting Currency Fluctuations
- 4.2.2.3. Impact of Currency Fluctuations on the Industry
- 4.2.3. Foreign Currency Exchange Rate
- 4.2.3.1. Impact of Foreign Exchange Rate Volatility on the Market
- 4.2.3.2. Strategies for Mitigating Foreign Exchange Risk
- 4.2.4. Recession
- 4.2.4.1. Assessment of Current Economic Conditions and Potential Impact on the Market
- 4.2.4.2. Historical Analysis of Past Recessions and Lessons Learnt
- 4.2.5. Inflation
- 4.2.5.1. Measurement and Analysis of Inflationary Pressures in the Economy
- 4.2.5.2. Potential Impact of Inflation on the Market Evolution
- 4.2.6. Interest Rates
- 4.2.6.1. Interest Rates and Their Impact on the Market
- 4.2.6.2. Strategies for Managing Interest Rate Risk
- 4.2.7. Commodity Flow Analysis
- 4.2.7.1. Type of Commodity
- 4.2.7.2. Origins and Destinations
- 4.2.7.3. Values and Weights
- 4.2.7.4. Modes of Transportation
- 4.2.8. Global Trade Dynamics
- 4.2.8.1. Import Scenario
- 4.2.8.2. Export Scenario
- 4.2.8.3. Trade Policies
- 4.2.8.4. Strategies for Mitigating the Risks Associated with Trade Barriers
- 4.2.8.5. Impact of Trade Barriers on the Market
- 4.2.9. War Impact Analysis
- 4.2.9.1. Russian-Ukraine War
- 4.2.9.2. Israel-Hamas War
- 4.2.10. COVID Impact / Related Factors
- 4.2.10.1. Global Economic Impact
- 4.2.10.2. Industry-specific Impact
- 4.2.10.3. Government Response and Stimulus Measures
- 4.2.10.4. Future Outlook and Adaptation Strategies
- 4.2.11. Other Indicators
- 4.2.11.1. Fiscal Policy
- 4.2.11.2. Consumer Spending
- 4.2.11.3. Gross Domestic Product (GDP)
- 4.2.11.4. Employment
- 4.2.11.5. Taxes
- 4.2.11.6. Stock Market Performance
- 4.2.11.7. Cross-Border Dynamics
- 4.2.1. Time Period
- 4.3. Conclusion
5. EXECUTIVE SUMMARY
6. INTRODUCTION
- 6.1. Overview of Carbon Footprint Management
- 6.2. Components Contributing to Carbon Emission / Footprint
- 6.3. Future Trends
7. SUPPLY CHAIN ANALYSIS
- 7.1. Brief Overview of Processes and Stakeholders Involved
- 7.2. Schematic Representation of Carbon Footprint Management Process
- 7.3. Key Challenges and Mitigation Strategies
8. REGULATORY SCENARIO
- 8.1. International and National Regulatory Authorities
9. CARBON FOOTPRINT MANAGEMENT MARKET: LEADING PLAYERS
- 9.1. Methodology and Key Parameters
- 9.2. Analysis by Year of Establishment
- 9.3. Analysis by Company Size
- 9.4. Analysis by Location of Headquarters \
- 9.5. Analysis by Type of Company
- 9.6. Analysis by Type of Offering
- 9.7. Analysis by Type of Company and Type of Offering
- 9.8. Analysis by Deployment Mode
10. COMPANY COMPETITIVENESS ANALYSIS
- 10.1. Methodology and Scoring Criteria
- 10.2. Comparison of Leading Players: 2x2 Matrix
- 10.3. Leading Players
11. STARTUP ECOSYSTEM ANALYSIS
- 11.1. Methodology and Key Parameters
- 11.2. Analysis by Year of Establishment
- 11.3. Analysis by Company Size
- 11.4. Analysis by Location of Headquarters
- 11.5. Analysis by Type of Company
- 11.7. Analysis by Type of Offering
- 11.8. Analysis by Type of Deployment Mode
- 11.9. Analysis of Carbon Footprint Management Solution Providers by Location of Headquarters
- 11.10. Analysis of Cloud-based Carbon Footprint Management Solution Providers by Company Size
12. COMPANY PROFILES
- 12.1. Overview
- 12.2. Carbon Footprint
- 12.2.1. Company Overview
- 12.2.2. Management Team
- 12.2.3. Carbon Footprint Management Portfolio
- 12.2.4. Recent Initiatives
- *similar details are presented for other below mentioned companies based on information in the public domain**
- 12.3. Carbon Trust
- 12.4. Diligent
- 12.5. EcoAct
- 12.6. EnergyCAP
- 12.7. ENGIE Impact
- 12.8. Optimum Energy
- 12.9. SAP
- 12.10. Envirosoft
- 12.11. GreenSutra
- 12.12. ESP
13. MEGATRENDS
- 13.1. Climate Regulations and Net-zero Commitments
- 13.2. Technological Advancements
- 13.3. Corporate Decarbonization Strategies
- 13.4. Sustainability Driven Consumer Demands
- 13.5. Robust Regulatory Framework
- 13.6. Integration of Carbon Management into Business Strategy
14. UNMET NEEDS
- 14.1. Lack of Carbon Accounting Knowledge
- 14.2. Defining Emission Boundaries
- 14.3. Data Collection
- 14.4. Data Verification and Accuracy
- 14.5. Standardization and Data Consistency
- 14.6. Late Achievements
- 14.7. Technology and Infrastructure
- 14.8. Price Variations
15. CARBON FOOTPRINT MANAGEMENT: KEY STRATEGIES
- 15.1. Focus on Renewable Energy
- 15.2. Energy Efficiency Improvements
- 15.3. Supply Chain Optimization
- 15.4. Waste Reduction
- 15.5. Sustainable Transportation Strategies
- 15.6. Carbon Neutral Farming
- 15.7. Green House Solutions
- 15.8. Net Zero Aviation
16. PATENT ANALYSIS
- 16.1. Scope and Methodology
- 16.2. Key Parameters
- 16.3. Carbon Footprint Management: Patent Analysis
- 16.3.1. Analysis by Application Year
- 16.3.2. Analysis by Type of Patent
- 16.3.3. Analysis by Patent Jurisdiction
- 16.3.4. Analysis by Patent Publication Year
- 16.3.5. Analysis by Type of Patent and Patent Publication Year
- 16.3.6. Leading Players: Analysis by Number of Patents
- 16.3.7. Leading Individual Patent Assignees: Analysis by Number of Patents
- 16.3.8. Analysis by Type of Applicant
- 16.3.9. Analysis by Patent Age
- 16.3.10. Patent Valuation
17. GLOBAL CARBON FOOTPRINT MANAGEMENT MARKET
- 17.1. Key Assumptions and Methodology
- 17.2. Global Carbon Footprint Management Market, Historical Trends (Since 2021) and Forecasted Estimates (Till 2035)
- 17.2.1. Scenario Analysis
- 17.2.1.1. Conservative Scenario
- 17.2.1.2. Optimistic Scenario
- 17.2.1. Scenario Analysis
- 17.3. Key Market Segmentations
18. MARKET OPPORTUNITIES BASED ON TYPE OF OFFERING
- 18.1. Key Assumptions and Methodology
- 18.2. Carbon Footprint Management Market, by Type of Offering
- 18.2.1. Carbon Footprint Management Market for Software, Historical Trends (Since 2021) and Forecasted Estimates (Till 2035)
- 18.2.2. Carbon Footprint Management Market for Solution, Historical Trends (Since 2021) and Forecasted Estimates (Till 2035)
19. MARKET OPPORTUNITIES BASED ON DEPLOYMENT MODE
- 19.1. Key Assumptions and Methodology
- 19.2. Carbon Footprint Management Market, by Deployment Mode
- 19.2.1. Carbon Footprint Management Market for Cloud-based, Historical Trends (Since 2021) and Forecasted Estimates (Till 2035)
- 19.2.2. Carbon Footprint Management Market for On-Premises, Historical Trends (Since 2021) and Forecasted Estimates (Till 2035)
20. MARKET OPPORTUNITIES BASED ON TYPE OF ENTERPRISE
- 20.1. Key Assumptions and Methodology
- 20.2. Carbon Footprint Management Market, by Type of Enterprise
- 20.2.1. Carbon Footprint Management Market for Small Companies, Historical Trends (Since 2021) and Forecasted Estimates (Till 2035)
- 20.2.2. Carbon Footprint Management Market for Mid-sized Companies, Historical Trends (Since 2021) and Forecasted Estimates (Till 2035)
- 20.2.3. Carbon Footprint Management Market for Large Companies, Historical Trends (Since 2021) and Forecasted Estimates (Till 2035)
21. MARKET OPPORTUNITIES BASED ON END USE INDUSTRY
- 21.1. Key Assumptions and Methodology
- 21.2. Carbon Footprint Management Market, by End Use Industry
- 21.2.1. Carbon Footprint Management Market for Energy Utilities, Historical Trends (Since 2021) and Forecasted Estimates (Till 2035)
- 21.2.2. Carbon Footprint Management Market for Manufacturing Industry, Historical Trends (Since 2021) and Forecasted Estimates (Till 2035)
- 21.2.3. Carbon Footprint Management Market for Residential and Commercial Buildings, Historical Trends (Since 2021) and Forecasted Estimates (Till 2035)
- 21.2.4. Carbon Footprint Management Market for Transportation and Logistics, Historical Trends (Since 2021) and Forecasted Estimates (Till 2035)
- 21.2.5. Carbon Footprint Management Market for Agriculture Industry, Historical Trends (Since 2021) and Forecasted Estimates (Till 2035)
- 21.2.5. Carbon Footprint Management Market for Other Industries, Historical Trends (Since 2021) and Forecasted Estimates (Till 2035)
22. MARKET OPPORTUNITIES BASED ON GEOGRAPHICAL REGIONS
- 22.1. Key Assumptions and Methodology
- 22.2. Carbon Footprint Management Market, by Geographical Regions
- 22.2.1. Carbon Footprint Management Market for in North America, Historical Trends (Since 2021) and Forecasted Estimates (Till 2035)
- 22.2.1.1. Carbon Footprint Management Market in the US, Historical Trends (Since 2021) and Forecasted Estimates (Till 2035)
- 22.2.1.2. Carbon Footprint Management Market in Canada, Historical Trends (Since 2021) and Forecasted Estimates (Till 2035)
- 22.2.2 Carbon Footprint Management Market for in Europe, Historical Trends (Since 2021) and Forecasted Estimates (Till 2035)
- 22.2.2.1. Carbon Footprint Management Market in Germany, Historical Trends (Since 2021) and Forecasted Estimates (Till 2035)
- 22.2.2.2. Carbon Footprint Management Market in the UK, Historical Trends (Since 2021) and Forecasted Estimates (Till 2035)
- 22.2.2.3. Carbon Footprint Management Market in France, Historical Trends (Since 2021) and Forecasted Estimates (Till 2035)
- 22.2.2.4. Carbon Footprint Management Market in Italy, Historical Trends (Since 2021) and Forecasted Estimates (Till 2035)
- 22.2.2.5. Carbon Footprint Management Market in Spain, Historical Trends (Since 2021) and Forecasted Estimates (Till 2035)
- 22.2.2.6. Carbon Footprint Management Market for in Netherlands, Historical Trends (Since 2021) and Forecasted Estimates (Till 2035)
- 22.2.2.7. Carbon Footprint Management Market in Belgium, Historical Trends (Since 2021) and Forecasted Estimates (Till 2035)
- 22.2.2.8. Carbon Footprint Management Market in Austria, Historical Trends (Since 2021) and Forecasted Estimates (Till 2035)
- 22.2.2.9. Carbon Footprint Management Market in Rest of Europe, Historical Trends (Since 2021) and Forecasted Estimates (Till 2035)
- 22.2.3. Carbon Footprint Management Market for in Asia-Pacific, Historical Trends (Since 2021) and Forecasted Estimates (Till 2035)
- 22.2.3.1. Carbon Footprint Management Market in China, Historical Trends (Since 2021) and Forecasted Estimates (Till 2035)
- 22.2.3.2. Carbon Footprint Management Market in India, Historical Trends (Since 2021) and Forecasted Estimates (Till 2035)
- 22.2.3.3. Carbon Footprint Management Market for in Japan, Historical Trends (Since 2021) and Forecasted Estimates (Till 2035)
- 22.3.3.4. Carbon Footprint Management Market in the Indonesia, Historical Trends (Since 2021) and Forecasted Estimates (Till 2035)
- 22.3.3.5. Carbon Footprint Management Market in South Korea, Historical Trends (Since 2021) and Forecasted Estimates (Till 2035)
- 22.3.3.6. Carbon Footprint Management Market for in Rest of Asia-Pacific, Historical Trends (Since 2021) and Forecasted Estimates (Till 2035)
- 22.2.4. Carbon Footprint Management Market in Middle East and Africa, Historical Trends (Since 2021) and Forecasted Estimates (Till 2035)
- 22.2.4.1. Carbon Footprint Management Market in Iran, Historical Trends (Since 2021) and Forecasted Estimates (Till 2035)
- 22.2.4.2. Carbon Footprint Management Market in Saudi Arabia, Historical Trends (Since 2021) and Forecasted Estimates (Till 2035)
- 22.2.4.3. Carbon Footprint Management Market in South Africa, Historical Trends (Since 2021) and Forecasted Estimates (Till 2035)
- 22.2.4.4. Carbon Footprint Management Market in UAE, Historical Trends (Since 2021) and Forecasted Estimates (Till 2035)
- 22.2.4.5. Carbon Footprint Management Market in Kuwait, Historical Trends (Since 2021) and Forecasted Estimates (Till 2035)
- 22.2.4.6. Carbon Footprint Management Market in Oman, Historical Trends (Since 2021) and Forecasted Estimates (Till 2035)
- 22.2.4.7. Carbon Footprint Management Market in Israel, Historical Trends (Since 2021) and Forecasted Estimates (Till 2035)
- 22.2.4.8. Carbon Footprint Management Market in Rest of Middle East and Africa, Historical Trends (Since 2021) and Forecasted Estimates (Till 2035)
- 22.2.5. Carbon Footprint Management Market in Latin America, Historical Trends (Since 2021) and Forecasted Estimates (Till 2035)
- 22.2.5.1. Carbon Footprint Management Market in Brazil, Historical Trends (Since 2021) and Forecasted Estimates (Till 2035)
- 22.2.5.2. Carbon Footprint Management Market in Argentina, Historical Trends (Since 2021) and Forecasted Estimates (Till 2035)
- 22.2.5.3. Carbon Footprint Management Market in Rest of Latin America, Historical Trends (Since 2021) and Forecasted Estimates (Till 2035)
- 22.2.1. Carbon Footprint Management Market for in North America, Historical Trends (Since 2021) and Forecasted Estimates (Till 2035)
- 22.3. Market Movement Analysis
- 22.4. Penetration-Growth (P-G) Matrix
