
|
시장보고서
상품코드
2052140
통합 시각 증강 시스템 시장(-2035년) : 제품 유형별, 기술 유형별, 용도별, 최종사용자별, 지역별 - 업계 동향과 세계 예측Integrated Visual Augmentation Systems Market, Till 2035: Distribution by Type of Product, Type of Technology, Type of Application, Type of End User, and Geographical Regions: Industry Trends and Global Forecasts |
||||||
통합 시각 증강 시스템(IVAS) 시장 전망
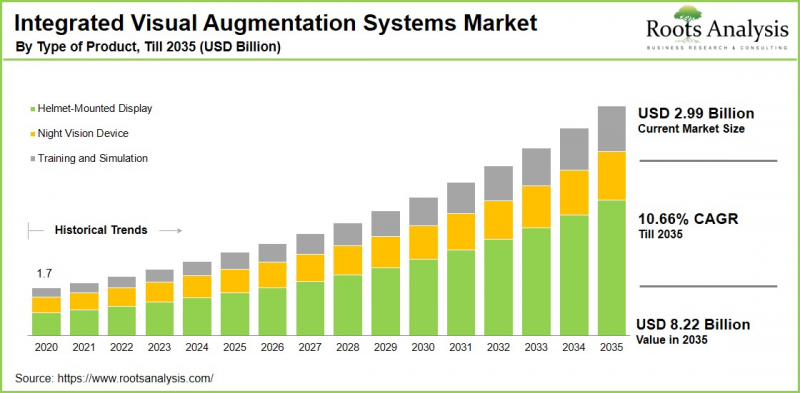
세계의 통합 시각 증강 시스템(IVAS) 시장 규모는 2035년까지 CAGR 10.66%로 확대되어 현재 29억 9,000만 달러에서 2035년에는 82억 2,000만 달러에 달할 것으로 추정됩니다.
통합 시각 증강 시스템(IVAS)은 군인의 상황 인식 능력, 의사결정 능력 및 전반적인 작전 효과를 향상시키기 위해 설계된 고급 군용 증강현실(AR) 플랫폼입니다. 국방 부대가 첨단 디지털 기술을 점점 더 많이 채택함에 따라 IVAS 시장은 전투 능력 향상에 중요한 역할을 하면서 괄목할 만한 성장세를 보이고 있습니다. 원래 마이크로소프트가 미 육군을 위해 개발한 IVAS는 내환경성이 뛰어난 마이크로소프트 홀로렌즈(Microsoft HoloLens) 기반 시스템을 기반으로 야간 투시 기능, 열화상, 실시간 전장 데이터 등의 기능을 통합한 헤드업 디스플레이를 구축했습니다. 이러한 통합은 임무 효율성, 생존성, 전장 인식 능력을 향상시켜 현대 전장 환경에서 병사들에게 결정적인 전술적 우위를 가져다줍니다.
최근 군인용 웨어러블 기술에 대한 정부의 투자 증가로 시장 확대가 가속화되고 있으며, 각국은 국방 분야에서 증강현실(AR) 및 혼합현실(MR) 활용에 많은 예산을 배정하고 있습니다. IVAS는 AI를 활용한 데이터 통합을 통해 실시간 의사결정과 작전 효율성을 향상시켜 군사 작전에 큰 영향을 미치고 있습니다. 또한, AI 및 실시간 시각화 도구의 도입을 포함한 상황 인식 기술의 지속적인 발전은 위협 감지 및 전장 가시성을 향상시킴으로써 군사 AR 시스템의 미래를 형성하고 있습니다. 전반적으로, 국방 분야에서의 AR 및 MR 기술 채택 확대는 예측 기간 동안 IVAS 시장의 강력한 성장을 지속할 것으로 예상됩니다.
통합 시각 증강 시스템(IVAS) 시장의 성장을 주도하는 주요 시장 촉진요인
통합 시각 증강 시스템(IVAS) 시장의 성장은 군사 현대화 프로그램의 확산, 전 세계 국방비 증가, 병사들을 위한 첨단 상황 인식 기술 채택 확대 등 몇 가지 주요 요인에 의해 주도되고 있습니다. 전 세계 정부는 군대 현대화를 최우선 과제로 삼고 있으며, 전투 준비태세를 강화하기 위해 차세대 군사 훈련 및 작전 기술에 많은 투자를 하고 있습니다. 전쟁이 점점 더 기술 중심이 되면서 전장에서 실시간 데이터 통합과 협업 강화를 지원할 수 있는 IVAS와 같은 통합 디지털 솔루션에 대한 수요가 증가하고 있습니다.
이러한 시스템은 향상된 상황 인식 능력, 통합된 야간 투시 및 열화상 기능, 증강현실(AR) 및 혼합현실(MR) 기능 등 다양한 이점을 제공하며, 이 모든 것이 전투 효율성과 신속한 의사결정에 기여하고 있습니다. 또한, 국방 기관이 작전 효율성을 강화하고 현대 전투 환경에서 전략적 우위를 유지하기 위한 혁신적인 솔루션을 모색하면서 웨어러블 군사 기술에 대한 관심이 높아지는 것은 시장 성장을 더욱 가속화할 것으로 예상됩니다.
통합 시각 증강 시스템(IVAS) 업계의 경쟁 환경의 변화
Microsoft, BAE Systems, Elbit Systems, Lockheed Martin 등 통합 시각 증강 시스템(IVAS) 시장의 주요 기업들은 지속적인 기술 혁신, 대규모 방산 계약, 전략적 제휴를 통해 업계의 성장을 적극적으로 주도하고 있습니다. 이들 주요 기업들은 역량 향상과 경쟁 우위 유지를 위해 연구개발에 많은 투자를 아끼지 않고 있습니다. 또한, 증강현실(AR) 기반 군사 시스템에 AI 및 클라우드 컴퓨팅과 같은 첨단 기술을 통합하기 위해 점점 더 많은 파트너십과 제휴 관계를 구축하고 있습니다. 이들 기업은 연구개발에 대한 대규모 투자를 통해 시스템 역량 향상과 경쟁 우위 유지를 목표로 하고 있습니다.
북미가 통합 시각 증강 시스템 시장에서 가장 큰 점유율을 차지
올해 북미는 전 세계 통합 시각 증강 시스템 시장에서 가장 큰 점유율을 차지하고 있습니다. 이러한 우위는 주로 미국의 막대한 국방 예산과 광범위한 군사 현대화 계획에 기인합니다. 이러한 계획에는 첨단 군사 기술에 대한 대규모 자금이 투입되고 있습니다. 미 육군은 국방 연구 기관 및 혁신 허브와 협력하여 IVAS 관련 프로그램을 적극적으로 지원하고 있으며, 지속적인 기술 발전을 촉진하고 시장 성장을 가속화하고 있습니다. 또한, 군사 훈련 시스템에 AI를 조기에 도입하고 통합하는 것과 더불어, 이 지역의 강력한 국방 조달 능력과 수출 잠재력은 세계 IVAS 시장에서 북미의 선도적 지위를 더욱 공고히 하고 있습니다.
통합 시각 증강 시스템(IVAS) 시장의 주요 과제
통합 시각 증강 시스템(IVAS) 도입의 주요 과제 중 하나는 기술적 제약과 다양한 규제 요건이며, 이 두 가지 모두 시장 확대를 저해할 수 있습니다. IVAS 플랫폼은 고성능 컴퓨팅, 실시간 데이터 처리, 증강현실(AR) 오버레이에 의존하고 있으며, 이는 모두 전력 소비에 큰 영향을 미치고 배터리를 빠르게 소모할 수 있습니다. 그 결과, 잦은 충전 없이 장시간 동안 지속적인 작동 성능을 보장하는 것은 여전히 중요한 관심사이며, 에너지 효율이 중요한 초점 영역이 되고 있습니다.
또한, 방산 분야에서의 IVAS 도입을 규정하는 규제 프레임워크는 지역마다 다르기 때문에 전 세계적으로 일관된 규정 준수를 유지하는 것은 쉽지 않습니다. 이러한 기술적, 규제적 문제는 광범위한 보급의 장벽이 되어 도입 속도를 늦추고 전체 시장의 성장을 제한할 수 있습니다.
통합 시각 증강 시스템(IVAS) 시장 : 주요 시장 세분화
제품 유형별
- 헬멧 마운트 디스플레이
- 암시 장치
- 훈련 및 시뮬레이션
기술별
- 증강현실(AR)
- 혼합현실(MR)
- 가상현실(VR)
용도별
- 전투 임무
- 시뮬레이션 및 훈련
최종사용자별
- 공군
- 육군
- 해군
지역별
- 북미
- 미국
- 캐나다
- 멕시코
- 기타 북미 국가
- 유럽
- 오스트리아
- 벨기에
- 덴마크
- 프랑스
- 독일
- 아일랜드
- 이탈리아
- 네덜란드
- 노르웨이
- 러시아
- 스페인
- 스웨덴
- 스위스
- 영국
- 기타 유럽 국가
- 아시아
- 중국
- 인도
- 일본
- 싱가포르
- 한국
- 기타 아시아 국가
- 라틴아메리카
- 브라질
- 칠레
- 콜롬비아
- 베네수엘라
- 기타 라틴아메리카
- 중동 및 북아프리카
- 이집트
- 이란
- 이라크
- 이스라엘
- 쿠웨이트
- 사우디아라비아
- 아랍에미리트
- 기타 중동 및 북아프리카 국가
- 세계 기타 지역
- 호주
- 뉴질랜드
- 기타 국가
세계의 통합 시각 증강 시스템(IVAS) 시장을 조사했으며, 시장 개요와 배경, 시장 영향요인 분석, 시장 규모 추정과 예측, 각종 부문별 상세 분석, 경쟁 상황, 주요 기업 개요 등의 정보를 정리하여 전해드립니다.
목차
제I부 : 보고서 개요
제1장 서문
제2장 조사 방법
제3장 시장 역학
제4장 거시경제 지표
제II부 : 정성적 인사이트
제5장 주요 요약
제6장 소개
제7장 규제 시나리오
제III부 : 시장 개요
제8장 주요 기업의 종합적 데이터베이스
제9장 경쟁 구도
제10장 화이트 스페이스 분석
제11장 기업 경쟁력 분석
제12장 통합 시각 증강 시스템(IVAS) 시장의 스타트업 생태계
제IV부 : 기업 개요
제13장 기업 개요
제V부 : 시장 동향
제14장 메가트렌드 분석
제15장 미충족 수요 분석
제16장 특허 분석
제17장 최근 동향
제VI부 : 시장 기회 분석
제18장 세계의 통합 시각 증강 시스템(IVAS) 시장
제19장 제품 유형별 시장 기회
제20장 기술 유형별 시장 기회
제21장 용도별 시장 기회
제22장 최종사용자별 시장 기회
제23장 북미의 시장 기회
제24장 유럽의 시장 기회
제25장 아시아의 시장 기회
제26장 중동 및 북아프리카의 시장 기회
제27장 인접 시장 분석
제VII부 : 전략적 툴
제28장 승리를 위한 중요한 전략
제29장 Porter's Five Forces 분석
제30장 SWOT 분석
제31장 밸류체인 분석
제32장 ROOTS에 의한 전략 제안
제VIII부 : 기타 독점적인 인사이트
제33장 1차 조사로부터의 인사이트
제34장 보고서 결론
제IX장 : 부록
제35장 표형식 데이터
제36장 기업 및 조직 리스트
제37장 맞춤화의 기회
제38장 ROOTS 구독 서비스
제39장 저자 정보
KSM 26.06.11Integrated Visual Augmentation Systems Market Outlook
As per Roots Analysis, the global integrated visual augmentation systems market size is estimated to grow from USD 2.99 billion in the current year to USD 8.22 billion by 2035, at a CAGR of 10.66% during the forecast period, till 2035.
The integrated visual augmentation system (IVAS) is an advanced, military-grade augmented reality (AR) platform designed to enhance soldiers' situational awareness, decision-making capabilities, and overall operational effectiveness. As defense forces increasingly adopt advanced digital technologies, the IVAS market is experiencing substantial growth, driven by its critical role in improving combat performance. Originally developed for the U.S. Army by Microsoft, IVAS integrates capabilities such as night vision, thermal imaging, and real-time battlefield data into a unified heads-up display, built on a ruggedized Microsoft HoloLens-based system. This integration enables enhanced mission efficiency, survivability, and battlefield awareness, providing soldiers with a decisive tactical advantage in modern warfare environments.
In recent years, increasing government investments in soldier-wearable technologies have accelerated market expansion, with countries allocating significant budgets toward augmented reality (AR) and mixed reality (MR) applications for defense. The impact of IVAS on military operations is significant, as it enhances real-time decision-making and operational efficiency through AI-driven data integration. Furthermore, ongoing advancements in situational awareness technologies, including the incorporation of artificial intelligence and real-time visualization tools, are shaping the future of military AR systems by improving threat detection and battlefield visibility. Collectively, the rising adoption of AR and MR technologies in the defense sector is expected to sustain strong growth in the IVAS market throughout the forecast period.

Strategic Insights for Senior Leaders
Key Drivers Propelling Growth of Integrated Visual Augmentation Systems Market
The growth of the integrated visual augmentation systems (IVAS) market is driven by several key factors, including the increasing prevalence of military modernization programs, rising global defense expenditures, and the growing adoption of advanced soldier situational awareness technologies. Governments worldwide are prioritizing the modernization of their armed forces and investing significantly in next-generation military training and operational technologies to enhance combat readiness. As warfare becomes increasingly technology-centric, there is a heightened demand for integrated digital solutions such as IVAS that can support real-time data integration and improved battlefield coordination.
These systems offer substantial advantages, including enhanced situational awareness, integrated night vision and thermal imaging capabilities, as well as augmented and mixed reality functionalities, all of which contribute to improved combat efficiency, faster decision-making. Furthermore, the increasing focus on wearable military technologies is expected to further accelerate market growth, as defense organizations seek innovative solutions to strengthen operational effectiveness and maintain a strategic advantage in modern combat environments.
Evolving Competitive Landscape of Integrated Visual Augmentation Systems Industry
Key players in the integrated visual augmentation systems (IVAS) market, including Microsoft, BAE Systems, Elbit Systems, and Lockheed Martin, are actively driving industry growth through continuous technological innovation, major defense contracts, and strategic collaborations. These leading organizations are focusing on substantial investments in research and development to advance capabilities and maintain a competitive edge. In addition, they are increasingly forming partnerships and alliances to integrate advanced technologies such as artificial intelligence and cloud computing into augmented reality-based military systems. By aligning their strategies with evolving industry trends and emphasizing innovation, these companies are strengthening their market position and effectively responding to intensifying competition within the sector.
North America Holding the Largest Share in the Integrated Visual Augmentation Systems Market
According to our analysis, in the current year, North America captures the highest share of the global integrated visual augmentation systems market. This dominance is driven by a combination of factors, primarily substantial defense budgets and extensive military modernization initiatives in the United States, which allocate significant funding toward advanced military technologies. The U.S. Army, along with defense research institutions and innovation hubs, actively supports IVAS-related programs, fostering continuous technological advancements and accelerating market growth. In addition, the early adoption and integration of artificial intelligence in military training systems, coupled with the region's strong defense procurement capabilities and export potential, further reinforce North America's leading position in the global IVAS market.
Key Challenges in the Integrated Visual Augmentation Systems Market
One of the primary challenges in the implementation of integrated visual augmentation systems (IVAS) lies in technical constraints and varying regulatory requirements, both of which can hinder market expansion. IVAS platforms depend on high-performance computing, real-time data processing, and augmented reality overlays, all of which place significant demands on power consumption and can lead to rapid battery depletion. Consequently, ensuring sustained operational performance over extended durations without frequent recharging remains a critical concern, making energy efficiency a key focus area.
In addition, regulatory frameworks governing IVAS deployment in the defense sector differ across regions, creating complexities in maintaining consistent compliance on a global scale. These technical and regulatory challenges collectively act as barriers to widespread adoption, potentially slowing the pace of deployment and limiting overall market growth.
Integrated Visual Augmentation Systems Market: Key Market Segmentation
By Type of Product
- Helmet-Mounted Display
- Night Vision Devices
- Training and Simulation
By Type of Technology
- Augmented Reality
- Mixed Reality
- Virtual Reality
By Type of Application
- Combat Mission
- Simulation and Training
By Type of End User
- Air Force
- Army
- Navy
By Geographical Regions
- North America
- US
- Canada
- Mexico
- Other North American countries
- Europe
- Austria
- Belgium
- Denmark
- France
- Germany
- Ireland
- Italy
- Netherlands
- Norway
- Russia
- Spain
- Sweden
- Switzerland
- UK
- Other European countries
- Asia
- China
- India
- Japan
- Singapore
- South Korea
- Other Asian countries
- Latin America
- Brazil
- Chile
- Colombia
- Venezuela
- Other Latin American countries
- Middle East and North Africa
- Egypt
- Iran
- Iraq
- Israel
- Kuwait
- Saudi Arabia
- UAE
- Other MENA countries
- Rest of the World
- Australia
- New Zealand
- Other countries
Example Players in Integrated Visual Augmentation Systems Market
- BAE Systems
- Digital Agents Interactive
- Elbit System
- General Atomics
- Inveris Training Solutions
- Lockheed Martin
- Magic Leap
- Microsoft
- NVIDIA
- Optex Systems Holding
- RTX
- Thales
- Vuzix
Integrated Visual Augmentation Systems Market: Report Coverage
The report on the integrated visual augmentation systems market features insights on various sections, including:
- Market Sizing and Opportunity Analysis: An in-depth analysis of the integrated visual augmentation systems market, focusing on key market segments, including [A] type of product, [B] type of technology, [C] type of application, [D] type of end user, and [E] geographical regions.
- Competitive Landscape: A comprehensive analysis of the companies engaged in the integrated visual augmentation systems market, based on several relevant parameters, such as [A] year of establishment, [B] company size, [C] location of headquarters and [D] ownership structure.
- Company Profiles: Elaborate profiles of prominent players engaged in the integrated visual augmentation systems market, providing details on [A] location of headquarters, [B] company size, [C] company mission, [D] company footprint, [E] management team, [F] contact details, [G] financial information, [H] operating business segments, [I] product / technology portfolio, [J] recent developments, and an informed future outlook.
- Megatrends: An evaluation of ongoing megatrends in the integrated visual augmentation systems industry.
- Patent Analysis: An insightful analysis of patents filed / granted in the integrated visual augmentation systems domain, based on relevant parameters, including [A] type of patent, [B] patent publication year, [C] patent age and [D] leading players.
- Recent Developments: An overview of the recent developments made in the integrated visual augmentation systems market, along with analysis based on relevant parameters, including [A] year of initiative, [B] type of initiative, [C] geographical distribution and [D] most active players.
- Porter's Five Forces Analysis: An analysis of five competitive forces prevailing in the integrated visual augmentation systems market, including threats of new entrants, bargaining power of buyers, bargaining power of suppliers, threats of substitute products and rivalry among existing competitors.
- SWOT Analysis: An insightful SWOT framework, highlighting the strengths, weaknesses, opportunities and threats in the domain. Additionally, it provides Harvey ball analysis, highlighting the relative impact of each SWOT parameter.
Key Questions Answered in this Report
- What is the current and future market size?
- Who are the leading companies in this market?
- What are the growth drivers that are likely to influence the evolution of this market?
- What are the key partnership and funding trends shaping this industry?
- Which region is likely to grow at higher CAGR till 2035?
- How is the current and future market opportunity likely to be distributed across key market segments?
Reasons to Buy this Report
- Detailed Market Analysis: The report provides a comprehensive market analysis, offering detailed revenue projections of the overall market and its specific sub-segments. This information is valuable to both established market leaders and emerging entrants.
- In-depth Analysis of Trends: Stakeholders can leverage the report to gain a deeper understanding of the competitive dynamics within the market. Each report maps ecosystem activity across partnerships, funding, and patent landscapes to reveal growth hotspots and white spaces in the industry.
- Opinion of Industry Experts: The report features extensive interviews and surveys with key opinion leaders and industry experts to validate market trends mentioned in the report.
- Decision-ready Deliverables: The report offers stakeholders with strategic frameworks (Porter's Five Forces, value chain, SWOT), and complimentary Excel / slide packs with customization support.
Additional Benefits
- Complimentary Dynamic Excel Dashboards for Analytical Modules
- Exclusive 15% Free Content Customization
- Personalized Interactive Report Walkthrough with Our Expert Research Team
- Free Report Updates for Versions Older than 6-12 Months
TABLE OF CONTENTS
SECTION I: REPORT OVERVIEW
1. PREFACE
- 1.1. Introduction
- 1.2. Market Share Insights
- 1.3. Key Market Insights
- 1.4. Report Coverage
- 1.5. Key Questions Answered
- 1.6. Chapter Outlines
2. RESEARCH METHODOLOGY
- 2.1. Chapter Overview
- 2.2. Research Assumptions
- 2.3. Database Building
- 2.3.1. Data Collection
- 2.3.2. Data Validation
- 2.3.3. Data Analysis
- 2.4. Project Methodology
- 2.4.1. Secondary Research
- 2.4.1.1. Annual Reports
- 2.4.1.2. Academic Research Papers
- 2.4.1.3. Company Websites
- 2.4.1.4. Investor Presentations
- 2.4.1.5. Regulatory Filings
- 2.4.1.6. White Papers
- 2.4.1.7. Industry Publications
- 2.4.1.8. Conferences and Seminars
- 2.4.1.9. Government Portals
- 2.4.1.10. Media and Press Releases
- 2.4.1.11. Newsletters
- 2.4.1.12. Industry Databases
- 2.4.1.13. Roots Proprietary Databases
- 2.4.1.14. Paid Databases and Sources
- 2.4.1.15. Social Media Portals
- 2.4.1.16. Other Secondary Sources
- 2.4.2. Primary Research
- 2.4.2.1. Introduction
- 2.4.2.2. Types
- 2.4.2.2.1. Qualitative
- 2.4.2.2.2. Quantitative
- 2.4.2.3. Advantages
- 2.4.2.4. Techniques
- 2.4.2.4.1. Interviews
- 2.4.2.4.2. Surveys
- 2.4.2.4.3. Focus Groups
- 2.4.2.4.4. Observational Research
- 2.4.2.4.5. Social Media Interactions
- 2.4.2.5. Stakeholders
- 2.4.2.5.1. Company Executives (CXOs)
- 2.4.2.5.2. Board of Directors
- 2.4.2.5.3. Company Presidents and Vice Presidents
- 2.4.2.5.4. Key Opinion Leaders
- 2.4.2.5.5. Research and Development Heads
- 2.4.2.5.6. Technical Experts
- 2.4.2.5.7. Subject Matter Experts
- 2.4.2.5.8. Scientists
- 2.4.2.5.9. Doctors and Other Healthcare Providers
- 2.4.2.6. Ethics and Integrity
- 2.4.2.6.1. Research Ethics
- 2.4.2.6.2. Data Integrity
- 2.4.3. Analytical Tools and Databases
- 2.4.1. Secondary Research
3. MARKET DYNAMICS
- 3.1. Forecast Methodology
- 3.1.1. Top-Down Approach
- 3.1.2. Bottom-Up Approach
- 3.1.3. Hybrid Approach
- 3.2. Market Assessment Framework
- 3.2.1. Total Addressable Market (TAM)
- 3.2.2. Serviceable Addressable Market (SAM)
- 3.2.3. Serviceable Obtainable Market (SOM)
- 3.2.4. Currently Acquired Market (CAM)
- 3.3. Forecasting Tools and Techniques
- 3.3.1. Qualitative Forecasting
- 3.3.2. Correlation
- 3.3.3. Regression
- 3.3.4. Time Series Analysis
- 3.3.5. Extrapolation
- 3.3.6. Convergence
- 3.3.7. Forecast Error Analysis
- 3.3.8. Data Visualization
- 3.3.9. Scenario Planning
- 3.3.10. Sensitivity Analysis
- 3.4. Key Considerations
- 3.4.1. Demographics
- 3.4.2. Market Access
- 3.4.3. Reimbursement Scenarios
- 3.4.4. Industry Consolidation
- 3.5. Robust Quality Control
- 3.6. Key Market Segmentations
- 3.7. Limitations
4. MACRO-ECONOMIC INDICATORS
- 4.1. Chapter Overview
- 4.2. Market Dynamics
- 4.2.1. Time Period
- 4.2.1.1. Historical Trends
- 4.2.1.2. Current and Forecasted Estimates
- 4.2.2. Currency Coverage
- 4.2.2.1. Overview of Major Currencies Affecting the Market
- 4.2.2.2. Impact of Currency Fluctuations on the Industry
- 4.2.3. Foreign Exchange Impact
- 4.2.3.1. Evaluation of Foreign Exchange Rates and Their Impact on Market
- 4.2.3.2. Strategies for Mitigating Foreign Exchange Risk
- 4.2.4. Recession
- 4.2.4.1. Historical Analysis of Past Recessions and Lessons Learnt
- 4.2.4.2. Assessment of Current Economic Conditions and Potential Impact on the Market
- 4.2.5. Inflation
- 4.2.5.1. Measurement and Analysis of Inflationary Pressures in the Economy
- 4.2.5.2. Potential Impact of Inflation on the Market Evolution
- 4.2.6. Interest Rates
- 4.2.6.1. Overview of Interest Rates and Their Impact on the Market
- 4.2.6.2. Strategies for Managing Interest Rate Risk
- 4.2.7. Commodity Flow Analysis
- 4.2.7.1. Type of Commodity
- 4.2.7.2. Origins and Destinations
- 4.2.7.3. Values and Weights
- 4.2.7.4. Modes of Transportation
- 4.2.8. Global Trade Dynamics
- 4.2.8.1. Import Scenario
- 4.2.8.2. Export Scenario
- 4.2.9. War Impact Analysis
- 4.2.9.1. Russian-Ukraine War
- 4.2.9.2. Israel-Hamas War
- 4.2.10. COVID Impact / Related Factors
- 4.2.10.1. Global Economic Impact
- 4.2.10.2. Industry-specific Impact
- 4.2.10.3. Government Response and Stimulus Measures
- 4.2.10.4. Future Outlook and Adaptation Strategies
- 4.2.11. Other Indicators
- 4.2.11.1. Fiscal Policy
- 4.2.11.2. Consumer Spending
- 4.2.11.3. Gross Domestic Product (GDP)
- 4.2.11.4. Employment
- 4.2.11.5. Taxes
- 4.2.11.6. R&D Innovation
- 4.2.11.7. Stock Market Performance
- 4.2.11.8. Supply Chain
- 4.2.11.9. Cross-Border Dynamics
- 4.2.1. Time Period
SECTION II: QUALITATIVE INSIGHTS
5. EXECUTIVE SUMMARY
6. INTRODUCTION
- 6.1. Chapter Overview
- 6.2. Overview of Integrated Visual Augmentation Systems Market
- 6.2.1. Type of Product
- 6.2.2. Type of Technology
- 6.2.3. Type of Application
- 6.2.4. Type of End User
- 6.3. Future Perspective
7. REGULATORY SCENARIO
SECTION III: MARKET OVERVIEW
8. COMPREHENSIVE DATABASE OF LEADING PLAYERS
9. COMPETITIVE LANDSCAPE
- 9.1. Chapter Overview
- 9.2. Integrated Visual Augmentation System: Overall Market Landscape
- 9.2.1. Analysis by Year of Establishment
- 9.2.2. Analysis by Company Size
- 9.2.3. Analysis by Location of Headquarters
- 9.2.4. Analysis by Ownership Structure
10. WHITE SPACE ANALYSIS
11. COMPANY COMPETITIVENESS ANALYSIS
12. STARTUP ECOSYSTEM IN THE INTEGRATED VISUAL AUGMENTATION SYSTEMS MARKET
- 12.1. Integrated Visual Augmentation Systems: Market Landscape of Startups
- 12.1.1. Analysis by Year of Establishment
- 12.1.2. Analysis by Company Size
- 12.1.3. Analysis by Company Size and Year of Establishment
- 12.1.4. Analysis by Location of Headquarters
- 12.1.5. Analysis by Company Size and Location of Headquarters
- 12.1.6. Analysis by Ownership Structure
- 12.2. Key Findings
SECTION IV: COMPANY PROFILES
13. COMPANY PROFILES
- 13.1. Chapter Overview
- 13.2. BAE Systems*
- 13.2.1. Company Overview
- 13.2.2. Company Mission
- 13.2.3. Company Footprint
- 13.2.4. Management Team
- 13.2.5. Contact Details
- 13.2.6. Financial Performance
- 13.2.7. Operating Business Segments
- 13.2.8. Service / Product Portfolio (project specific)
- 13.2.9. MOAT Analysis
- 13.2.10. Recent Developments and Future Outlook
- 13.3. Digital Agents Interactive
- 13.4. Elbit Systems
- 13.5. General Atomics
- 13.6. InVeris Training Solutions
- 13.7. Lockheed Martin
- 13.8. Magic Leap
- 13.9. Microsoft
- 13.10. NVIDIA
- 13.11. Optex Systems Holding
- 13.12. RTX
- 13.13. Thales
- 13.14. Vuzix
SECTION V: MARKET TRENDS
14. MEGA TRENDS ANALYSIS
15. UNMET NEED ANALYSIS
16. PATENT ANALYSIS
17. RECENT DEVELOPMENTS
- 17.1. Chapter Overview
- 17.2. Recent Funding
- 17.3. Recent Partnerships
- 17.4. Other Recent Initiatives
SECTION VI: MARKET OPPORTUNITY ANALYSIS
18. GLOBAL INTEGRATED VISUAL AUGMENTATION SYSTEMS MARKET
- 18.1. Chapter Overview
- 18.2. Key Assumptions and Methodology
- 18.3. Trends Disruption Impacting Market
- 18.4. Demand Side Trends
- 18.5. Supply Side Trends
- 18.6. Global Integrated Visual Augmentation Systems Market, Historical Trends (Since 2020) and Forecasted Estimates (Till 2035)
- 18.7. Multivariate Scenario Analysis
- 18.7.1. Conservative Scenario
- 18.7.2. Optimistic Scenario
- 18.8. Investment Feasibility Index
- 18.9. Key Market Segmentations
19. MARKET OPPORTUNITIES BASED ON TYPE OF PRODUCT
- 19.1. Chapter Overview
- 19.2. Key Assumptions and Methodology
- 19.3. Revenue Shift Analysis
- 19.4. Market Movement Analysis
- 19.5. Penetration-Growth (P-G) Matrix
- 19.6. Integrated Visual Augmentation Systems Market for Helmet-Mounted Display: Historical Trends (Since 2020) and Forecasted Estimates (Till 2035)
- 19.7. Integrated Visual Augmentation Systems Market for Night Vision Devices: Historical Trends (Since 202) and Forecasted Estimates (Till 2035)
- 19.8. Integrated Visual Augmentation Systems Market for Training and Simulation: Historical Trends (Since 202) and Forecasted Estimates (Till 2035)
- 19.9. Data Triangulation and Validation
- 19.9.1. Secondary Sources
- 19.9.2. Primary Sources
- 19.9.3. Statistical Modeling
20. MARKET OPPORTUNITIES BASED ON TYPE OF TECHNOLOGY
- 20.1. Chapter Overview
- 20.2. Key Assumptions and Methodology
- 20.3. Revenue Shift Analysis
- 20.4. Market Movement Analysis
- 20.5. Penetration-Growth (P-G) Matrix
- 20.6. Integrated Visual Augmentation Systems Market for Augmented Reality: Historical Trends (Since 2020) and Forecasted Estimates (Till 2035)
- 20.7. Integrated Visual Augmentation Systems Market for Mixed Reality: Historical Trends (Since 2020) and Forecasted Estimates (Till 2035)
- 20.8. Integrated Visual Augmentation Systems Market for Virtual Reality: Historical Trends (Since 2020) and Forecasted Estimates (Till 2035)
- 20.9. Data Triangulation and Validation
- 20.9.1. Secondary Sources
- 20.9.2. Primary Sources
- 20.9.3. Statistical Modeling
21. MARKET OPPORTUNITIES BASED ON TYPE OF APPLICATION
- 21.1. Chapter Overview
- 21.2. Key Assumptions and Methodology
- 21.3. Revenue Shift Analysis
- 21.4. Market Movement Analysis
- 21.5. Penetration-Growth (P-G) Matrix
- 21.6. Integrated Visual Augmentation Systems Market for Combat Mission: Historical Trends (Since 2020) and Forecasted Estimates (Till 2035)
- 21.7. Integrated Visual Augmentation Systems Market for Simulation and Training: Historical Trends (Since 2020) and Forecasted Estimates (Till 2035)
- 21.8. Data Triangulation and Validation
- 21.8.1. Secondary Sources
- 21.8.2. Primary Sources
- 21.8.3. Statistical Modeling
22. MARKET OPPORTUNITIES BASED ON TYPE OF END USER
- 22.1. Chapter Overview
- 22.2. Key Assumptions and Methodology
- 22.3. Revenue Shift Analysis
- 22.4. Market Movement Analysis
- 22.5. Penetration-Growth (P-G) Matrix
- 22.6. Integrated Visual Augmentation Systems Market for Air Force: Historical Trends (Since 2020) and Forecasted Estimates (Till 2035)
- 22.7. Integrated Visual Augmentation Systems Market for Army: Historical Trends (Since 2020) and Forecasted Estimates (Till 2035)
- 22.8. Integrated Visual Augmentation Systems Market for Navy: Historical Trends (Since 2020) and Forecasted Estimates (Till 2035)
- 22.9. Data Triangulation and Validation
- 22.9.1. Secondary Sources
- 22.9.2. Primary Sources
- 22.9.3. Statistical Modeling
23. MARKET OPPORTUNITIES FOR INTEGRATED VISUAL AUGMENTATION SYSTEMS IN NORTH AMERICA
- 23.1. Chapter Overview
- 23.2. Key Assumptions and Methodology
- 23.3. Revenue Shift Analysis
- 23.4. Market Movement Analysis
- 23.5. Penetration-Growth (P-G) Matrix
- 23.6. Integrated Visual Augmentation Systems Market in North America: Historical Trends (Since 2020) and Forecasted Estimates (Till 2035)
- 23.6.1. Integrated Visual Augmentation Systems Market in the US: Historical Trends (Since 2020) and Forecasted Estimates (Till 2035)
- 23.6.2. Integrated Visual Augmentation Systems Market in Canada: Historical Trends (Since 2020) and Forecasted Estimates (Till 2035)
- 23.6.3. Integrated Visual Augmentation Systems Market in Mexica: Historical Trends (Since 2020) and Forecasted Estimates (Till 2035)
- 23.6.4. Integrated Visual Augmentation Systems Market in Other North American Countries: Historical Trends (Since 2020) and Forecasted Estimates (Till 2035)
- 23.7. Data Triangulation and Validation
24. MARKET OPPORTUNITIES FOR INTEGRATED VISUAL AUGMENTATION SYSTEMS IN EUROPE
- 24.1. Chapter Overview
- 24.2. Key Assumptions and Methodology
- 24.3. Revenue Shift Analysis
- 24.4. Market Movement Analysis
- 24.5. Penetration-Growth (P-G) Matrix
- 24.6. Integrated Visual Augmentation Systems Market in Europe: Historical Trends (Since 2020) and Forecasted Estimates (Till 2035)
- 24.6.1. Integrated Visual Augmentation Systems Market in Austria: Historical Trends (Since 2020) and Forecasted Estimates (Till 2035)
- 24.6.2. Integrated Visual Augmentation Systems Market in Belgium: Historical Trends (Since 2020) and Forecasted Estimates (Till 2035)
- 24.6.3. Integrated Visual Augmentation Systems Market in Denmark: Historical Trends (Since 2020) and Forecasted Estimates (Till 2035)
- 24.6.4. Integrated Visual Augmentation Systems Market in France: Historical Trends (Since 2020) and Forecasted Estimates (Till 2035)
- 24.6.5. Integrated Visual Augmentation Systems Market in Germany: Historical Trends (Since 2020) and Forecasted Estimates (Till 2035)
- 24.6.6. Integrated Visual Augmentation Systems Market in Ireland: Historical Trends (Since 2020) and Forecasted Estimates (Till 2035)
- 24.6.7. Integrated Visual Augmentation Systems Market in Italy: Historical Trends (Since 2020) and Forecasted Estimates (Till 2035)
- 24.6.8. Integrated Visual Augmentation Systems Market in Netherlands: Historical Trends (Since 2020) and Forecasted Estimates (Till 2035)
- 24.6.9. Integrated Visual Augmentation Systems Market in Norway: Historical Trends (Since 2020) and Forecasted Estimates (Till 2035)
- 24.6.10. Integrated Visual Augmentation Systems Market in Russia: Historical Trends (Since 2020) and Forecasted Estimates (Till 2035)
- 24.6.11. Integrated Visual Augmentation Systems Market in Spain: Historical Trends (Since 2020) and Forecasted Estimates (Till 2035)
- 24.6.12. Integrated Visual Augmentation Systems Market in Sweden: Historical Trends (Since 2020) and Forecasted Estimates (Till 2035)
- 24.6.13. Integrated Visual Augmentation Systems Market in Switzerland: Historical Trends (Since 2020) and Forecasted Estimates (Till 2035)
- 24.6.14. Integrated Visual Augmentation Systems Market in the UK: Historical Trends (Since 2020) and Forecasted Estimates (Till 2035)
- 24.6.15. Integrated Visual Augmentation Systems Market in Other European Countries: Historical Trends (Since 2020) and Forecasted Estimates (Till 2035)
- 24.7. Data Triangulation and Validation
25. MARKET OPPORTUNITIES FOR INTEGRATED VISUAL AUGMENTATION SYSTEMS IN ASIA
- 25.1. Chapter Overview
- 25.2. Key Assumptions and Methodology
- 25.3. Revenue Shift Analysis
- 25.4. Market Movement Analysis
- 25.5. Penetration-Growth (P-G) Matrix
- 25.6. Integrated Visual Augmentation Systems Market in Asia: Historical Trends (Since 2020) and Forecasted Estimates (Till 2035)
- 25.6.1. Integrated Visual Augmentation Systems Market in China: Historical Trends (Since 2020) and Forecasted Estimates (Till 2035)
- 25.6.2. Integrated Visual Augmentation Systems Market in India: Historical Trends (Since 2020) and Forecasted Estimates (Till 2035)
- 25.6.3. Integrated Visual Augmentation Systems Market in Japan: Historical Trends (Since 2020) and Forecasted Estimates (Till 2035)
- 25.6.4. Integrated Visual Augmentation Systems Market in Singapore: Historical Trends (Since 2020) and Forecasted Estimates (Till 2035)
- 25.6.5. Integrated Visual Augmentation Systems Market in South Korea: Historical Trends (Since 2020) and Forecasted Estimates (Till 2035)
- 25.6.6. Integrated Visual Augmentation Systems Market in Other Asian Countries: Historical Trends (Since 2020) and Forecasted Estimates (Till 2035)
- 25.7. Data Triangulation and Validation
26. MARKET OPPORTUNITIES FOR INTEGRATED VISUAL AUGMENTATION SYSTEMS IN MIDDLE EAST AND NORTH AFRICA (MENA)
- 26.1. Chapter Overview
- 26.2. Key Assumptions and Methodology
- 26.3. Revenue Shift Analysis
- 26.4. Market Movement Analysis
- 26.5. Penetration-Growth (P-G) Matrix
- 26.6. Integrated Visual Augmentation Systems Market in Middle East and North Africa (MENA): Historical Trends (Since 2020) and Forecasted Estimates (Till 2035)
- 26.6.1. Integrated Visual Augmentation Systems Market in Egypt: Historical Trends (Since 2020) and Forecasted Estimates (Till 205)
- 26.6.2. Integrated Visual Augmentation Systems Market in Iran: Historical Trends (Since 2020) and Forecasted Estimates (Till 2035)
- 26.6.3. Integrated Visual Augmentation Systems Market in Iraq: Historical Trends (Since 2020) and Forecasted Estimates (Till 2035)
- 26.6.4. Integrated Visual Augmentation Systems Market in Israel: Historical Trends (Since 2020) and Forecasted Estimates (Till 2035)
- 26.6.5. Integrated Visual Augmentation Systems Market in Kuwait: Historical Trends (Since 2020) and Forecasted Estimates (Till 2035)
- 26.6.6. Integrated Visual Augmentation Systems Market in Saudi Arabia: Historical Trends (Since 2020) and Forecasted Estimates (Till 2035)
- 26.6.7. Neuromorphic Computing Marke in United Arab Emirates (UAE): Historical Trends (Since 2020) and Forecasted Estimates (Till 2035)
- 26.6.8. Integrated Visual Augmentation Systems Market in Other MENA Countries: Historical Trends (Since 2020) and Forecasted Estimates (Till 2035)
- 26.7. Data Triangulation and Validation
