
|
시장보고서
상품코드
2072254
광역학 치료 시장(제2판) : 대상 질환별, 치료 분야별, 주요 지역별 - 동향과 예측(-2035년)Photodynamic Therapy Market (2nd Edition) by Target Indication, Therapeutic Area, and Key Geographical Regions - Trends and Forecast, Till 2035 |
||||||
광역학 치료 시장 : 개요
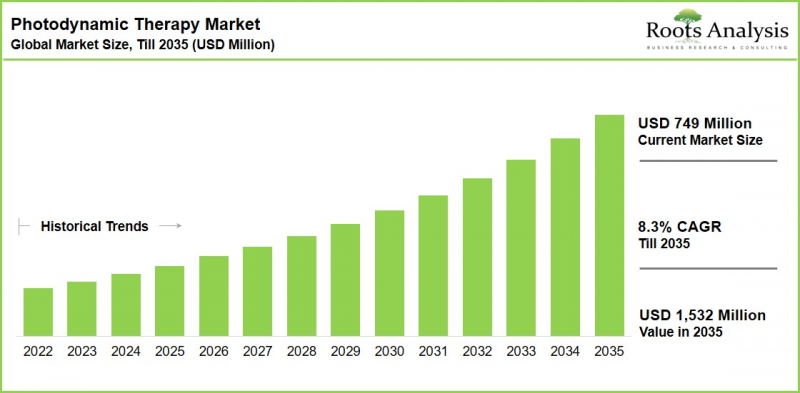
Roots Analysis의 조사에 따르면, 세계의 광역학 치료 시장 규모는 현재 7억 4,900만 달러에서 2035년에는 15억 3,200만 달러로 성장할 것으로 추정되며, 2035년까지 예측 기간 동안 CAGR 8.3%를 기록할 전망입니다.
광역학 치료 시장 : 성장 및 동향
일반적으로 광역학 치료(PDT)라고 불리는 광활성화 치료는 특정 파장의 빛에 의해 활성화되는 광감작 물질을 이용하는, 표적을 정확히 겨냥한 최소침습적 치료법입니다. 활성화되면, 이러한 물질들은 세포 독성을 지닌 활성산소종(ROS)을 생성하여 암 조직이나 기타 병변 조직을 선택적으로 파괴할 수 있게 합니다. 20세기 초에 시작된 PDT는 수십 년에 걸친 임상 연구와 기술의 발전을 통해 지속적으로 대폭적인 개선이 이루어져 왔습니다. 시간이 흐르면서 PDT는 종양 치료 분야에서 다목적 치료법으로 발전했으며, 기존의 화학요법이나 방사선 치료에 비해 전신 독성이 낮다는 중요한 이점을 제공하고 있습니다. 또한, 포르피린 복합체나 나노입자 제제 등 광감작 물질의 설계에 있어 지속적인 혁신과 첨단 정밀 광조명 시스템의 결합을 통해, PDT의 적용 범위는 종양을 넘어 항균 및 피부과 분야로 확대되고 있습니다.
광역학 치료에서는 일반적으로 광감작 물질을 종양 부위에 국소적으로 투여하기 때문에 전신에 미치는 영향을 최소화하고, 장기간에 걸친 피부 광과민성이나 표적 외 독성과 같은 부작용을 줄일 수 있습니다. 또한, PDT는 광선각화증, 여드름, 사마귀, 미세 수포성 병변 등 다양한 피부 질환의 치료에서 우수한 임상 결과를 보여주고 있어, 광범위한 피부 질환의 관리에 적합하다는 사실이 입증되었습니다.
광활성화 요법이 지닌 치료상의 이점에 힘입어, 많은 관계자들이 여러 질환에 적용 가능한 새로운 광면역요법 및 광역학요법 개발을 위한 노력을 적극적으로 추진하고 있습니다. 현재 70가지 이상의 치료법이 임상 개발 단계에 있으며, 이미 몇 가지 PDT 기반 치료법이 규제 당국의 승인을 획득했다는 점은 주목할 만합니다. 또한, 주요 기업들은 피부암 치료를 위한 차세대 광감응 물질로서 양자점 등의 나노기술 플랫폼을 점점 더 많이 활용하고 있습니다. 지속적인 기술 발전, 임상 연구의 확대, 표적 치료에 대한 관심 증가로 인해 광역학 치료 시장은 예측 기간 동안 상당한 성장을 이룰 것으로 전망됩니다.
성장 요인 : 시장 확대를 전략적으로 촉진하는 요인
광역학 치료(PDT) 시장의 성장은 주로 전 세계적으로 암 및 피부 질환의 유병률이 증가함에 따라 주도되고 있으며, 이로 인해 표적화된 최소침습 치료법에 대한 수요가 높아지고 있습니다. PDT는 특정 파장의 빛에 의해 활성화되는 광감작 물질을 활용하여, 기존 치료법에 비해 전신 독성을 최소화하면서 종양을 정밀하게 절제할 수 있게 해줍니다. 또한, 광감작 물질의 제제 및 고성능 다이오드 레이저와 광섬유 시스템을 포함한 광조명 기술의 지속적인 발전으로 인해 광역학 치료의 유효성이 크게 향상되고 있습니다. 이러한 혁신을 통해 조직 내로의 더 깊은 침투가 가능해졌으며, 종양 분야에서의 치료 성과 최적화에 기여하고 있습니다. 또한, 항균 적응증 및 노화성 황반변성(AMD)에 대한 PDT 승인 건수의 증가와 더불어 유리한 보험 급여 체계가 맞물리면서, 광활성화 요법의 임상 도입이 가속화되고 있습니다.
시장의 과제 : 진전을 가로막는 중대한 장벽
광역학 치료(PDT) 시장은 그 보급을 저해할 수 있는 몇 가지 과제에 직면해 있습니다. 활성화 광원의 조직 침투 깊이가 제한적이기 때문에 심부 종양이나 내장 악성 종양의 치료에는 제약이 있습니다. 또한, 치료 후의 광과민성이나 광조사의 관리가 필요하다는 점도 환자의 치료 순응도에 영향을 미칠 수 있습니다. 고도의 광감응 물질, 전용 광조사 시스템, 치료 비용 등은 특히 신흥 시장에서 치료 접근성을 더욱 제한하고 있습니다. 게다가 전용 인프라와 훈련을 받은 전문가의 필요성뿐만 아니라, PDT의 장점에 대한 인식 부족 또한 임상 도입을 계속해서 가로막고 있습니다. 엄격한 규제 요건과 면역요법, 표적요법 등 대체 요법과의 경쟁도 시장에 있어 큰 과제가 되고 있습니다.
본 보고서에서는 전 세계 광역학 치료 시장을 조사하여, 시장 및 대상 질환에 대한 개요, 시장 성장에 영향을 미치는 다양한 요인에 대한 분석, 시장 규모 추정 및 전망, 각종 분류 및 지역별 상세 분석, 기술 및 제품 동향, 사례 연구, 자금 조달 동향, 경쟁 구도, 주요 기업 개요 등을 정리하고 있습니다.
목차
제1장 서문
제2장 조사 방법
제3장 시장 역학
제4장 거시경제 지표
제5장 주요 요약
제6장 소개
제7장 시장 구도
제8장 기업 및 약제 프로파일
제9장 임상시험 분석
제10장 특허 분석
제11장 시장 영향 분석
제12장 세계의 광역학 치료 시장
제13장 광역학 치료 시장 : 대상 질환별
제14장 광역학 치료 시장 : 치료 분야별
제15장 광역학 치료 시장 : 주요 지역별
제16장 결론
제17장 경영진 인사이트
제18장 부록 I : 표형식 데이터
제19장 부록 II : 기업 및 조직 리스트
지역별 시장 기회 분석
제20장 시장 기회 분석 : 북미
제21장 시장 기회 분석 : 유럽
제22장 시장 기회 분석 : 아시아태평양
제23장 시장 기회 분석 : 중동 및 북아프리카
KSMPhotodynamic Therapy Market: Overview
As per Roots Analysis, the global photodynamic therapy market is estimated to grow from USD 749 million in the current year to USD 1,532 million by 2035, at a CAGR of 8.3% during the forecast period, till 2035.

Photodynamic Therapy Market: Growth and Trends
Light-activated therapy, commonly referred to as photodynamic therapy (PDT), is a targeted and minimally invasive treatment modality that utilizes photosensitizing agents activated by specific wavelengths of light. Upon activation, these agents generate cytotoxic reactive oxygen species (ROS), enabling the selective destruction of cancerous and other pathological tissues. Originating in the early 20th century, PDT has undergone substantial refinement through decades of clinical research and technological advancements. Over time, it has emerged as a versatile therapeutic approach for oncological indications, offering key advantages such as reduced systemic toxicity compared to conventional chemotherapy and radiotherapy. In addition, continuous innovations in photosensitizer design, including porphyrin-based conjugates and nanoparticle-based formulations, coupled with advanced precision light-delivery systems, have broadened the scope of PDT beyond oncology into antimicrobial and dermatological applications.
In photodynamic therapy, photosensitizers are typically administered locally at the tumor site, thereby minimizing systemic exposure and reducing adverse effects such as prolonged skin photosensitivity and off-target toxicity. Furthermore, PDT has demonstrated favorable clinical outcomes in the treatment of various dermatological conditions, including actinic keratosis, acne, warts, and microvesicular lesions, underscoring its suitability for managing a broad spectrum of skin disorders.
Driven by the therapeutic advantages associated with light-activated therapies, several industry stakeholders are actively undertaking initiatives to develop novel photo immunotherapies and photodynamic therapies targeting multiple disease indications. It is noteworthy that more than 70 therapies are currently under clinical development, while several PDT-based therapies have already received regulatory approval. Moreover, leading companies are increasingly leveraging nanotechnology platforms, such as quantum dots, as next-generation photosensitizers for the treatment of skin cancer. Owing to ongoing technological advancements, expanding clinical research efforts, and increasing interest in targeted therapeutic modalities, the photodynamic therapy market is anticipated to witness significant growth during the forecast period.
Growth Drivers: Strategic Enablers of Market Expansion
The growth of the photodynamic therapy (PDT) market is primarily driven by the increasing global prevalence of cancer and dermatological disorders, which has intensified the demand for targeted and minimally invasive treatment approaches. PDT leverages photosensitizing agents activated by specific light wavelengths to enable precise tumor ablation while minimizing systemic toxicity compared to conventional therapeutic modalities. In addition, ongoing advancements in photosensitizer formulations and light-delivery technologies, including enhanced diode lasers and fiber-optic systems, have significantly improved the efficacy of photodynamic therapy. These innovations enable deeper tissue penetration and contribute to optimized treatment outcomes in oncology applications. Furthermore, the growing number of regulatory approvals for PDT across antimicrobial indications and age-related macular degeneration (AMD), coupled with favorable reimbursement frameworks, has accelerated the clinical adoption of light-activated therapies.
Market Challenges: Critical Barriers Impeding Progress
The photodynamic therapy (PDT) market faces several challenges that may hinder its widespread adoption. Limited tissue penetration of activating light sources restricts the treatment of deep-seated tumors and internal malignancies. Additionally, post-treatment photosensitivity and the need for controlled light exposure can impact patient compliance. The high cost of advanced photosensitizers, specialized light-delivery systems, and treatment procedures further limits accessibility, particularly in emerging markets. Moreover, the requirement for specialized infrastructure and trained professionals, coupled with limited awareness regarding PDT benefits, continues to constrain clinical adoption. Stringent regulatory requirements and competition from alternative therapies such as immunotherapy and targeted therapeutics also pose significant market challenges.
Photodynamic Therapy Market Segments
The market sizing and opportunity analysis has been segmented across the following parameters:
By Target Indication
- Actinic Keratosis
- Prostate Cancer
- Age-related Macular Degeneration
- Head and Neck Squamous Cell Carcinoma
- Basal Cell Carcinoma
- Port Wine Stain
- Barrett's Esophagus
- Esophageal Cancer
- Endobronchial Cancer
- Lung Cancer
- Bowen's Disease
- Brain Cancer
- Bladder Cancer
- T-cell Lymphoma
- Urothelial Cancer
By Therapeutic Area
- Oncological Disorders
- Dermatological Disorders
- Ophthalmic Disorders
By Key Geographical Regions
- North America
- US
- Canada
- Europe
- Germany
- UK
- France
- Italy
- Spain
- Rest of Europe
- Asia-Pacific
- China
- Japan
- India
- Middle East and North Africa
- Israel
Photodynamic Therapy Market: Key Segment Insights
Will the Oncological Disorders Segment Continue to Hold the Largest Market Share?
In the current year, the oncological disorders segment is expected to account for the largest share of the photodynamic therapy market (approximately 50%) and is projected to witness a relatively higher CAGR (11%) during the forecast period. This growth is primarily driven by the increasing global incidence of cancers, particularly skin, lung, esophageal, and head-and-neck cancers, which has accelerated the demand for PDT, owing to its targeted mechanism of selectively eliminating malignant cells through light-activated photosensitizers.
Which Target Indication Accounts for the Largest Photodynamic Therapy Market Share?
In the current year, the actinic keratosis segment is anticipated to capture the largest share of the light-activated therapy market (over 35%). This dominance can be attributed to the growing prevalence of actinic keratosis, a precancerous skin condition associated with prolonged ultraviolet (UV) exposure, along with the superior cosmetic outcomes offered by PDT compared to conventional treatment approaches such as cryotherapy.
It is worth highlighting that the head and neck squamous cell carcinoma segment is projected to grow at a comparatively higher CAGR during the forecast period. This growth is likely to be driven by the increasing global disease burden and ongoing clinical advancements, including the use of PDT in combination with immunotherapies, which have demonstrated promising response rates and reduced severe toxicities.
Regional Analysis: Which Regions are Expected to Witness the Fastest Growth in the Light-Activated Therapy Industry?
Europe: The Largest Regional Market
According to our photodynamic therapy market forecast, Europe is expected to account for the largest market share (nearly 50%) in the current year. The region's dominance can be attributed to the high prevalence of non-melanoma skin cancers, including actinic keratosis and basal cell carcinoma, which affect a significant portion of the population and continue to drive demand for PDT. Additionally, well-established healthcare systems across countries such as Germany, France, and the UK support the widespread adoption of outpatient PDT procedures through favorable reimbursement frameworks, national treatment guidelines, and ongoing clinical research focused on oncological and dermatological indications.
North America: The Fastest Growing Regional Market
The North American market is anticipated to witness the highest CAGR (14%) during the forecast period through 2035, according to our photodynamic therapy market analysis. modalities across the region. This growth is driven by increasing investments in pharmaceutical research and development, rapid technological advancements in light-based therapeutic systems, and strong government initiatives aimed at modernizing healthcare infrastructure. It is also supported by efforts to promote the adoption of advanced treatment modalities across the region.
Example Players in Photodynamic Therapy Market
- ADVANZ PHARMA
- Biofrontera
- Biolitec Pharma
- Galderma
- Luzitin
- Nanospectra Biosciences
- Novartis
- Rakuten Medical
- Impact Biotech
- Theralase
Photodynamic Therapy Market: Research Coverage
- Market Sizing and Opportunity Analysis: The report features an in-depth analysis of the photodynamic therapy market, focusing on key market segments, including [A] target indication, [B] therapeutic area, and [C] geographical regions.
- Photodynamic Therapy Market Landscape: A detailed assessment of the overall photodynamic therapy market landscape, along with information on several relevant parameters, such as [A] stage of development, [B] type of light used, [C] type of therapy, [A] target indication, [B] Therapeutic area, [C] type of therapy, [D] company size, [E] year of establishment and [F] location of headquarters.
- Company Profiles: In-depth profiles of key companies based in North America, Europe and Asia-Pacific based on several parameters such as [A] year of establishment, [B] location of headquarters, [C] product portfolio, [D] recent developments and [E] an informed future outlook.
- Clinical Trial Analysis: An in-depth analysis of completed and ongoing clinical trials investigating cancer metabolism-based therapies, based on several relevant parameters, such as [A] trial registration year, [B] trial status, [C] trial phase, [D] patients enrolled, [E] trial study design, [F] type of sponsor, [G] patient gender, [H] most active industry, and non-industry players and [I] geographical distribution.
- Patent Analysis: A detailed analysis of the patents that have been filed / granted based on important parameters such as, [A] type of patent, [B] publication year, [C] application year, [D] number of granted patents and patent applications, [E] patent jurisdiction, [F] CPC symbols, [G] patent age, [H] type of applicant, and [I] individual patent assignees (in terms of size of intellectual property portfolio).
- Market Impact Analysis: An in-depth analysis of the factors that can impact the growth of the market. It also features identification and analysis of key drivers, potential restraints, emerging opportunities, and existing challenges in this domain.
Key Questions Answered in this Report
- Which are the leading companies in the photodynamic therapy market?
- Which region dominates the photodynamic therapy market?
- What are the key trends observed in photodynamic therapy market?
- What factors are likely to influence the evolution of this market?
- What are the primary challenges faced by photodynamic therapy developers?
- What is the current and future market size?
- What is the CAGR of this market?
- How is the current and future market opportunity likely to be distributed across key market segments?
Reasons to Buy this Report
- The report provides a comprehensive market analysis, offering detailed revenue projections of the overall market and its specific sub-segments. This information is valuable to both established market leaders and emerging entrants.
- The report offers stakeholders a comprehensive overview of the market, including key drivers, barriers, opportunities, and challenges. This information empowers stakeholders to stay abreast of market trends and make data-driven decisions to capitalize on growth prospects.
- The report can aid businesses in identifying future opportunities in any sector. It also helps in understanding if those opportunities are worth pursuing.
- The report helps in identifying customer demand by understanding the needs, preferences, and behavior of the target audience in order to tailor products or services effectively.
- The report equips new entrants with requisite information regarding a particular market to help them build successful business strategies.
- The report allows for more effective communication with the audience and in building strong business relations.
Additional Benefits
- Complementary PPT Insights Pack
- Complimentary Excel Data Packs for all Analytical Modules in the Report
- 15% Free Content Customization
- Detailed Report Walkthrough Session with Research Team
- Free Updated report if the report is 6-12 months old or older
TABLE OF CONTENTS
1. PREFACE
- 1.1. Introduction
- 1.2. Market Share Insights
- 1.3. Key Market Insights
- 1.4. Report Coverage
- 1.5. Key Questions Answered
- 1.6. Chapter Outlines
2. RESEARCH METHODOLOGY
- 2.1. Chapter Overview
- 2.2. Research Assumptions
- 2.2.1. Market Landscape and Market Trends
- 2.2.2. Market Forecast and Opportunity Analysis
- 2.2.3. Comparative Analysis
- 2.3. Database Building
- 2.3.1. Data Collection
- 2.3.2. Data Validation
- 2.3.3. Data Analysis
- 2.4. Project Methodology
- 2.4.1. Secondary Research
- 2.4.1.1. Annual Reports
- 2.4.1.2. Academic Research Papers
- 2.4.1.3. Company Websites
- 2.4.1.4. Investor Presentations
- 2.4.1.5. Regulatory Filings
- 2.4.1.6. White Papers
- 2.4.1.7. Industry Publications
- 2.4.1.8. Conferences and Seminars
- 2.4.1.9. Government Portals
- 2.4.1.10. Media and Press Releases
- 2.4.1.11. Newsletters
- 2.4.1.12. Industry Databases
- 2.4.1.13. Roots Proprietary Databases
- 2.4.1.14. Paid Databases and Sources
- 2.4.1.15. Social Media Portals
- 2.4.1.16. Other Secondary Sources
- 2.4.2. Primary Research
- 2.4.2.1. Types of Primary Research
- 2.4.2.1.1. Qualitative Research
- 2.4.2.1.2. Quantitative Research
- 2.4.2.1.3. Hybrid Approach
- 2.4.2.2. Advantages of Primary Research
- 2.4.2.3. Techniques for Primary Research
- 2.4.2.3.1. Interviews
- 2.4.2.3.2. Surveys
- 2.4.2.3.3. Focus Groups
- 2.4.2.3.4. Observational Research
- 2.4.2.3.5. Social Media Interactions
- 2.4.2.4. Key Opinion Leaders Considered in Primary Research
- 2.4.2.4.1. Company Executives (CXOs)
- 2.4.2.4.2. Board of Directors
- 2.4.2.4.3. Company Presidents and Vice Presidents
- 2.4.2.4.4. Research and Development Heads
- 2.4.2.4.5. Technical Experts
- 2.4.2.4.6. Subject Matter Experts
- 2.4.2.4.7. Scientists
- 2.4.2.4.8. Doctors and Other Healthcare Providers
- 2.4.2.5. Ethics and Integrity
- 2.4.2.5.1. Research Ethics
- 2.4.2.5.2. Data Integrity
- 2.4.2.1. Types of Primary Research
- 2.4.3. Analytical Tools and Databases
- 2.4.1. Secondary Research
- 2.5. Robust Quality Control
3. MARKET DYNAMICS
- 3.1. Chapter Overview
- 3.2. Forecast Methodology
- 3.2.1. Top-down Approach
- 3.2.2. Bottom-up Approach
- 3.2.3. Hybrid Approach
- 3.3. Market Assessment Framework
- 3.3.1. Total Addressable Market (TAM)
- 3.3.2. Serviceable Addressable Market (SAM)
- 3.3.3. Serviceable Obtainable Market (SOM)
- 3.3.4. Currently Acquired Market (CAM)
- 3.4. Forecasting Tools and Techniques
- 3.4.1. Qualitative Forecasting
- 3.4.2. Correlation
- 3.4.3. Regression
- 3.4.4. Extrapolation
- 3.4.5. Convergence
- 3.4.6. Sensitivity Analysis
- 3.4.7. Scenario Planning
- 3.4.8. Data Visualization
- 3.4.9. Time Series Analysis
- 3.4.10. Forecast Error Analysis
- 3.5. Key Considerations
- 3.5.1. Demographics
- 3.5.2. Government Regulations
- 3.5.3. Reimbursement Scenarios
- 3.5.4. Market Access
- 3.5.5. Supply Chain
- 3.5.6. Industry Consolidation
- 3.5.7. Pandemic / Unforeseen Disruptions Impact
- 3.6. Limitations
4. MACRO-ECONOMIC INDICATORS
- 4.1. Chapter Overview
- 4.2. Market Dynamics
- 4.2.1. Time Period
- 4.2.1.1. Historical Trends
- 4.2.1.2. Current and Forecasted Estimates
- 4.2.2. Currency Coverage
- 4.2.2.1. Major Currencies Affecting the Market
- 4.2.2.2. Factors Affecting Currency Fluctuations on the Industry
- 4.2.2.3. Impact of Currency Fluctuations on the Industry
- 4.2.3. Foreign Currency Exchange Rate
- 4.2.3.1. Impact of Foreign Exchange Rate Volatility on the Market
- 4.2.3.2. Strategies for Mitigating Foreign Exchange Risk
- 4.2.4. Recession
- 4.2.4.1. Assessment of Current Economic Conditions and Potential Impact on the Market
- 4.2.4.2. Historical Analysis of Past Recessions and Lessons Learnt
- 4.2.5. Inflation
- 4.2.5.1. Measurement and Analysis of Inflationary Pressures in the Economy
- 4.2.5.2. Potential Impact of Inflation on the Market Evolution
- 4.2.6. Interest Rates
- 4.2.6.1. Interest Rates and Their Impact on the Market
- 4.2.6.2. Strategies for Managing Interest Rate Risk
- 4.2.7. Commodity Flow Analysis
- 4.2.7.1. Type of Commodity
- 4.2.7.2. Origins and Destinations
- 4.2.7.3. Values and Weights
- 4.2.7.4. Modes of Transportation
- 4.2.8. Global Trade Dynamics
- 4.2.8.1. Import Scenario
- 4.2.8.2. Export Scenario
- 4.2.8.3. Trade Policies
- 4.2.8.4. Strategies for Mitigating the Risks Associated with Trade Barriers
- 4.2.8.5. Impact of Trade Barriers on the Market
- 4.2.9. War Impact Analysis
- 4.2.9.1. Russian-Ukraine War
- 4.2.9.2. Israel-Hamas War
- 4.2.10. COVID Impact / Related Factors
- 4.2.10.1. Global Economic Impact
- 4.2.10.2. Industry-specific Impact
- 4.2.10.3. Government Response and Stimulus Measures
- 4.2.10.4. Future Outlook and Adaptation Strategies
- 4.2.11. Other Indicators
- 4.2.11.1. Fiscal Policy
- 4.2.11.2. Consumer Spending
- 4.2.11.3. Gross Domestic Product
- 4.2.11.4. Employment
- 4.2.11.5. Taxes
- 4.2.11.6. Stock Market Performance
- 4.2.11.7. Cross Border Dynamics
- 4.2.1. Time Period
- 4.3. Conclusion
5. EXECUTIVE SUMMARY
6. INTRODUCTION
- 6.1. Overview of Light Activated Therapies
- 6.2. Types of Light Activated Therapies
- 6.3. Components of Light Activated Therapies
- 6.3.1. Photosensitizing Substance
- 6.3.2. Light Source and Device
- 6.4. Type of Light Activated Therapy
- 6.4.1. Photoimmunotherapy
- 6.4.1.1 Mechanism of Action of Photoimmunotherapies
- 6.4.2. Photodynamic Therapy
- 6.4.2.1. Mechanism of Action of Photodynamic Therapy
- 6.4.2.2. Advantages and Challenges Associated with Photodynamic Therapy
- 6.4.3. Photothermal Therapy
- 6.4.3.1. Mechanism of Action of Photothermal Therapy
- 6.4.1. Photoimmunotherapy
- 6.5. Difference between Photodynamic and Photothermal Therapy
- 6.6. Advantages of Light Activated Therapies
7. MARKET LANDSCAPE
- 7.1 Chapter Overview
- 7.2. Light Activated Therapies: Overall Market Landscape
- 7.2.1. Analysis by Type of Light Activated Therapy
- 7.2.2. Analysis by Stage of Development
- 7.2.3. Analysis by Type of Light Used
- 7.2.4. Analysis by Type of Therapy
- 7.2.5. Analysis by Dosing Frequency
- 7.2.6. Analysis by Target Indication
- 7.2.7. Analysis by Therapeutic Area
- 7.2.8. Analysis by Therapeutic Area and Stage of Development
- 7.3. Light Activated Therapy Developers: Overall Market Landscape
- 7.3.1. Analysis by Year of Establishment
- 7.3.2. Analysis by Company Size
- 7.3.3. Analysis by Location of Headquarters (Region)
- 7.3.4. Analysis by Location of Headquarters (Country)
8. COMPANY AND DRUG PROFILES
- 8.1. Chapter Overview
- 8.2 ADVANZ PHARMA
- 8.2.1. Company Overview
- 8.2.2. Financial Information
- 8.2.3. Product Portfolio
- 8.2.4. Recent Developments and Future Outlook
- 8.3. Biofrontera
- 8.4. biolitec Pharma
- 8.5 Luzitin
- 8.6 Nanospectra Biosciences
- 8.7. photoatomic
- 8.8. Rakuten Medical
- 8.9. Impact Biotech
- 8.10. Theralase
- 8.11. Cetuximab Sarotalocan(R)
- 8.11.1. Company Overview
- 8.11.2. Drug Overview
- 8.11.3. Clinical Development Status
- 8.11.4. Clinical Trial Endpoints
- 8.11.5. Dosage Regimen
- 8.11.6. Key Insights
- 8.11.7. Sales Revenue
- 8.12. Alacare(R)
- 8.12.1. Company Overview
- 8.12.2. Drug Overview
- 8.12.3. Clinical Development Status
- 8.12.4. Clinical Trial Endpoints
- 8.12.5. Dosage Regimen
- 8.12.6. Key Insights
- 8.12.7. Sales Revenue
- 8.13. Ameluz(R)
- 8.13.1. Company Overview
- 8.13.2. Drug Overview
- 8.13.3. Clinical Development Status
- 8.13.4. Dosage Regimen
- 8.13.5. Key Insights
- 8.13.6. Sales Revenue
- 8.14. Aminolevulinic Acid
- 8.14.1. Company Overview
- 8.14.2. Drug Overview
- 8.14.3. Clinical Development Status
- 8.14.4. Key Insights
- 8.14.5. Sales Revenue
- 8.15. Foscan(R) (Temoporfin)
- 8.15.1. Company Overview
- 8.15.2. Drug Overview
- 8.15.3. Clinical Development Status
- 8.15.4. Clinical Trial Endpoints
- 8.15.5. Dosage Regimen
- 8.15.6. Key Insights
- 8.15.7. Sales Revenue
- 8.16. FuMeiDa(R) (Hemoporfin)
- 8.16.1. Company Overview
- 8.16.2. Drug Overview
- 8.16.3. Clinical Development Status
- 8.16.4. Clinical Trial Endpoints
- 8.16.5. Dosage Regimen
- 8.16.6. Key Insights
- 8.16.16. Sales Revenue
- 8.17. Levulan Kerastick(R)
- 8.17.1. Company Overview
- 8.17.2. Drug Overview
- 8.17.3. Clinical Development Status
- 8.17.4. Dosage Regimen
- 8.17.5. Key Insights
- 8.17.6. Sales Revenue
- 8.18. Metvixia(R) (Metvix)
- 8.18.1. Company Overview
- 8.18.2. Drug Overview
- 8.18.3. Clinical Development Status
- 8.18.4. Clinical Trial Endpoints
- 8.18.5. Dosage Regimen
- 8.18.6. Key Insights
- 8.18.7. Sales Revenue
- 8.19. Porfimer Sodium / Photofrin(R)
- 8.19.1. Company Overview
- 8.19.2. Drug Overview
- 8.19.3. Clinical Development Status
- 8.19.4. Clinical Trial Endpoints
- 8.19.5. Dosage Regimen
- 8.19.6. Sales Revenue
- 8.20. Verteporfin(R) (Visudyne)
- 8.20.1. Company Overview
- 8.20.2. Drug Overview
- 8.20.3. Clinical Development Status
- 8.20.4. Clinical Trial Endpoints
- 8.20.5. Dosage Regimen
- 8.20.6. Key Insights
- 8.20.7. Sales Revenue
9. CLINICAL TRIAL ANALYSIS
- 9.1. Chapter Overview
- 9.2. Scope and Methodology
- 9.3. Light Activated Therapies: Clinical Trial Analysis
- 9.3.1. Analysis by Trial Registration Year
- 9.3.2. Analysis of Patients Enrolled by Trial Registration Year
- 9.3.3. Analysis by Trial Phase
- 9.3.4. Analysis of Patients Enrolled by Trial Phase
- 9.3.5. Analysis by Trial Status
- 9.3.6. Analysis by Trial Registration Year and Trial Status
- 9.3.7. Analysis of Patients Enrolled by Trial Status
- 9.3.8. Analysis by Target Patient Population
- 9.3.9. Analysis by Patient Gender
- 9.3.10. Analysis by Type of Sponsor / Collaborator
- 9.3.11. Analysis by Study Design
- 9.3.11.1. Analysis by Type of Patient Allocation Model Used
- 9.3.11.2. Analysis by Type of Trial Masking Adopted
- 9.3.11.3. Analysis by Type of Trial Intervention Model
- 9.3.11.4. Analysis by Trial Purpose
- 9.3.12. Most Active Players: Analysis by Number of Clinical Trials
- 9.3.13. Analysis by Geography
- 9.3.13.1. Analysis of Clinical Trials by Geography
- 9.3.13.2. Analysis of Clinical Trials by Geography and Trial Status
- 9.3.13.3. Analysis of Clinical Trials by Geography and Trial Phase
- 9.3.13.4. Analysis of Patients Enrolled by Geography
- 9.3.13.5. Analysis of Patients Enrolled by Geography and Trial Status
10. PATENT ANALYSIS
- 10.1 Chapter Overview
- 10.2. Scope and Methodology
- 10.3. Light Activated Therapies: Patent Analysis
- 10.3.1. Analysis by Type of Patent
- 10.3.2. Analysis by Publication Year
- 10.3.3. Analysis by Type of Patent and Publication Year
- 10.3.4. Analysis by Application Year
- 10.3.5. Analysis by Jurisdiction
- 10.3.6. Analysis by Type of Applicant
- 10.3.7. Analysis by Patent Age
- 10.3.8. Analysis by CPC Symbols
- 10.3.9. Leading Industry Players: Analysis by Number of Patents
- 10.3.10. Leading Non-Industry Players: Analysis by Number of Patents
- 10.3.11. Leading Inventors: Analysis by Number of Patents
- 10.4. Light Activated Therapies: Patent Benchmarking Analysis
- 10.4.1. Analysis by Patent Characteristics
- 10.4.2. Analysis by Leading Industry Players
- 10.5. Patent Valuation Analysis
11. MARKET IMPACT ANALYSIS
- 11.1. Chapter Overview
- 11.2. Market Drivers
- 11.3. Market Restraints
- 11.4. Market Opportunities
- 11.5. Market Challenges
- 11.6. Conclusion
12. GLOBAL PHOTODYNAMIC THERAPY MARKET
- 12.1. Chapter Overview
- 12.2. Key Assumptions and Methodology
- 12.3. Global Photodynamic Therapy Market, Historical Trends (since 2022) and Forecasted Estimates (till 2035)
- 12.3.1. Roots Analysis Perspective on Market Growth
- 12.3.2. Scenario Analysis
- 12.3.2.1. Conservative Scenario
- 12.3.2.2. Optimistic Scenario
- 12.4. Key Market Segmentations
13. PHOTODYNAMIC THERAPY MARKET, BY TARGET INDICATION
- 13.1. Chapter Overview
- 13.2. Key Assumptions and Methodology
- 13.3. Photodynamic Therapy Market: Distribution by Target Indication
- 13.3.1. Photodynamic Therapy Market for Actinic Keratosis, Historical Trends (since 2022) and Forecasted Estimates (till 2035)
- 13.3.2. Photodynamic Therapy Market for Prostate Cancer, Historical Trends (since 2022) and Forecasted Estimates (till 2035)
- 13.3.3. Photodynamic Therapy Market for Age-related Macular Degeneration, Historical Trends (since 2022) and Forecasted Estimates (till 2035)
- 13.3.4. Photodynamic Therapy Market for Head and Neck Squamous Cell Carcinoma, Historical Trends (since 2022) and Forecasted Estimates (till 2035)
- 13.3.5. Photodynamic Therapy Market for Basal Cell Carcinoma, Historical Trends (since 2022) and Forecasted Estimates (till 2035)
- 13.3.6. Photodynamic Therapy Market for Port Wine Stain, Historical Trends (since 2022) and Forecasted Estimates (till 2035)
- 13.3.7. Photodynamic Therapy Market for Barrett's Esophagus, Historical Trends (since 2022) and Forecasted Estimates (till 2035)
- 13.3.8. Photodynamic Therapy Market for Esophageal Cancer, Historical Trends (since 2022) and Forecasted Estimates (till 2035)
- 13.3.9. Photodynamic Therapy Market for Endobronchial Cancer, Historical Trends (since 2022) and Forecasted Estimates (till 2035)
- 13.3.10. Photodynamic Therapy Market for Lung Cancer, Historical Trends (since 2022) and Forecasted Estimates (till 2035)
- 13.3.11. Photodynamic Therapy Market for Bowen's Disease, Historical Trends (since 2022) and Forecasted Estimates (till 2035)
- 13.3.11. Photodynamic Therapy Market for Brain Cancer, Historical Trends (since 2022) and Forecasted Estimates (till 2035)
- 13.3.12. Photodynamic Therapy Market for Bladder Cancer, Historical Trends (since 2022) and Forecasted Estimates (till 2035)
- 13.3.13. Photodynamic Therapy Market for T-cell Lymphoma, Historical Trends (since 2022) and Forecasted Estimates (till 2035)
- 13.3.14. Photodynamic Therapy Market for Urothelial Cancer, Historical Trends (since 2022) and Forecasted Estimates (till 2035)
- 13.4. Data Triangulation and Validation
14. PHOTODYNAMIC THERAPY MARKET, BY THERAPEUTIC AREA
- 14.1. Chapter Overview
- 14.2. Key Assumptions and Methodology
- 14.3. Photodynamic Therapy Market: Distribution by Therapeutic Area
- 14.3.1. Photodynamic Therapy Market for Oncological Disorders, Historical Trends (since 2022) and Forecasted Estimates (till 2035)
- 14.3.2. Photodynamic Therapy Market for Dermatological Disorders, Historical Trends (since 2022) and Forecasted Estimates (till 2035)
- 14.3.3. Photodynamic Therapy Market for Ophthalmic Disorders, Historical Trends (since 2022) and Forecasted Estimates (till 2035)
- 14.4. Data Triangulation and Validation
15. PHOTODYNAMIC THERAPY MARKET, BY KEY GEOGRAPHICAL REGIONS
- 15.1. Chapter Overview
- 15.2. Key Assumptions and Methodology
- 15.3. Photodynamic Therapy Market: Distribution by Key Geographical Regions
- 15.3.1. Photodynamic Therapy Market in North America, Historical Trends (since 2022) and Forecasted Estimates (till 2035)
- 15.3.1.1. Photodynamic Therapy Market in the US, Historical Trends (since 2022) and Forecasted Estimates (till 2035)
- 15.3.1.2. Photodynamic Therapy Market in Canada, Historical Trends (since 2022) and Forecasted Estimates (till 2035)
- 15.3.2. Photodynamic Therapy Market in Europe, Historical Trends (since 2022) and Forecasted Estimates (till 2035)
- 15.3.2.1. Photodynamic Therapy Market in the UK, Historical Trends (since 2022) and Forecasted Estimates (till 2035)
- 15.3.2.2. Photodynamic Therapy Market in Germany, Historical Trends (since 2022) and Forecasted Estimates (till 2035)
- 15.3.2.3. Photodynamic Therapy Market in France, Historical Trends (since 2022) and Forecasted Estimates (till 2035)
- 15.3.2.4. Photodynamic Therapy Market in Italy, Historical Trends (since 2022) and Forecasted Estimates (till 2035)
- 15.3.2.5. Photodynamic Therapy Market in Spain, Historical Trends (since 2022) and Forecasted Estimates (till 2035)
- 15.3.2.6. Photodynamic Therapy Market in Rest of Europe, Historical Trends (since 2022) and Forecasted Estimates (till 2035)
- 15.3.3. Photodynamic Therapy Market in Asia-Pacific, Historical Trends (since 2022) and Forecasted Estimates (till 2035)
- 15.3.3.1. Photodynamic Therapy Market in India, Forecasted Estimates (till 2035)
- 15.3.3.2. Photodynamic Therapy Market in China, Historical Trends (since 2022) and Forecasted Estimates (till 2035)
- 15.3.3.3. Photodynamic Therapy Market in Japan, Historical Trends (since 2022) and Forecasted Estimates (till 2035)
- 15.3.4. Photodynamic Therapy Market in Middle East and North Africa, Historical Trends (since 2022) and Forecasted Estimates (till 2035)
- 15.3.4.1. Photodynamic Therapy Market in Israel, Forecasted Estimates (till 2035)
- 15.3.1. Photodynamic Therapy Market in North America, Historical Trends (since 2022) and Forecasted Estimates (till 2035)
- 15.4. Market Dynamics Assessment: Key Geographical Regions
- 15.4.1. Penetration Growth (P-G) Matrix
- 15.4.2. Market Movement Analysis
- 15.5. Data Triangulation and Validation
16. CONCLUDING REMARKS
17. EXECUTIVE INSIGHTS
18. APPENDIX I: TABULATED DATA
19. APPENDIX II: LIST OF COMPANIES AND ORGANIZATIONS
MARKET OPPORTUNITY ANALYSIS WITHIN GEOGRAPHY
20. MARKET OPPORTUNITY ANALYSIS: NORTH AMERICA
- 20.1. Photodynamic Therapy Market in North America: Distribution by Target Indication
- 20.1.1. Photodynamic Therapy Market in North America for Actinic Keratosis, Historical Trends (since 2022) and Forecasted Estimates (Till 2035)
- 20.1.2. Photodynamic Therapy Market in North America for Prostate Cancer, Historical Trends (since 2022) and Forecasted Estimates (Till 2035)
- 20.1.3. Photodynamic Therapy Market in North America for Age-related Macular Degeneration, Historical Trends (since 2022) and Forecasted Estimates (Till 2035)
- 20.1.4. Photodynamic Therapy Market in North America for Head and Neck Squamous Cell Carcinoma, Historical Trends (since 2022) and Forecasted Estimates (Till 2035)
- 20.1.5. Photodynamic Therapy Market in North America for Basal Cell Carcinoma, Historical Trends (since 2022) and Forecasted Estimates (Till 2035)
- 20.1.6. Photodynamic Therapy Market in North America for Port Wine Stain, Historical Trends (since 2022) and Forecasted Estimates (Till 2035)
- 20.1.7. Photodynamic Therapy Market in North America for Barrett's Esophagus, Historical Trends (since 2022) and Forecasted Estimates (Till 2035)
- 20.1.8. Photodynamic Therapy Market in North America for Esophageal Cancer, Historical Trends (since 2022) and Forecasted Estimates (Till 2035)
- 20.1.9. Photodynamic Therapy Market in North America for Endobronchial Cancer, Historical Trends (since 2022) and Forecasted Estimates (Till 2035)
- 20.1.10. Photodynamic Therapy Market in North America for Lung Cancer, Historical Trends (since 2022) and Forecasted Estimates (Till 2035)
- 20.1.11. Photodynamic Therapy Market in North America for Bowen's Cancer, Historical Trends (since 2022) and Forecasted Estimates (Till 2035)
- 20.1.12. Photodynamic Therapy Market in North America for Brain Cancer, Historical Trends (since 2022) and Forecasted Estimates (Till 2035)
- 20.1.13. Photodynamic Therapy Market in North America for Bladder Cancer, Historical Trends (since 2022) and Forecasted Estimates (Till 2035)
- 20.1.14. Photodynamic Therapy Market in North America for T-cell Lymphoma Cancer, Historical Trends (since 2022) and Forecasted Estimates (Till 2035)
- 20.1.15. Photodynamic Therapy Market in North America for Urothelial Cancer, Historical Trends (since 2022) and Forecasted Estimates (Till 2035)
- 20.2. Photodynamic Therapy Market in North America: Distribution by Therapeutic Area
- 20.2.1. Photodynamic Therapy Market in North America for Oncological Disorders, Historical Trends (since 2022) and Forecasted Estimates (Till 2035)
- 20.2.2. Photodynamic Therapy Market in North America for Dermatological Disorders, Historical Trends (since 2022) and Forecasted Estimates (Till 2035)
- 20.2.3. Photodynamic Therapy Market in North America for Ophthalmic Disorders, Historical Trends (since 2022) and Forecasted Estimates (Till 2035)
21. MARKET OPPORTUNITY ANALYSIS: EUROPE
- 21.1. Photodynamic Therapy Market in Europe: Distribution by Target Indication
- 21.1.1. Photodynamic Therapy Market in Europe for Actinic Keratosis, Historical Trends (since 2022) and Forecasted Estimates (Till 2035)
- 21.1.2. Photodynamic Therapy Market in Europe for Prostate Cancer, Historical Trends (since 2022) and Forecasted Estimates (Till 2035)
- 21.1.3. Photodynamic Therapy Market in Europe for Age-related Macular Degeneration, Historical Trends (since 2022) and Forecasted Estimates (Till 2035)
- 21.1.4. Photodynamic Therapy Market in Europe for Head and Neck Squamous Cell Carcinoma, Historical Trends (since 2022) and Forecasted Estimates (Till 2035)
- 21.1.5. Photodynamic Therapy Market in Europe for Basal Cell Carcinoma, Historical Trends (since 2022) and Forecasted Estimates (Till 2035)
- 21.1.6. Photodynamic Therapy Market in Europe for Port Wine Stain, Historical Trends (since 2022) and Forecasted Estimates (Till 2035)
- 21.1.7. Photodynamic Therapy Market in Europe for Barrett's Esophagus, Historical Trends (since 2022) and Forecasted Estimates (Till 2035)
- 21.1.8. Photodynamic Therapy Market in Europe for Esophageal Cancer, Historical Trends (since 2022) and Forecasted Estimates (Till 2035)
- 21.1.9. Photodynamic Therapy Market in Europe for Endobronchial Cancer, Historical Trends (since 2022) and Forecasted Estimates (Till 2035)
- 21.1.10. Photodynamic Therapy Market in Europe for Lung Cancer, Historical Trends (since 2022) and Forecasted Estimates (Till 2035)
- 21.1.11. Photodynamic Therapy Market in Europe for Bowen's Cancer, Historical Trends (since 2022) and Forecasted Estimates (Till 2035)
- 21.1.12. Photodynamic Therapy Market in Europe for Brain Cancer, Historical Trends (since 2022) and Forecasted Estimates (Till 2035)
- 21.1.13. Photodynamic Therapy Market in Europe for Bladder Cancer, Historical Trends (since 2022) and Forecasted Estimates (Till 2035)
- 21.1.14. Photodynamic Therapy Market in Europe for T-cell Lymphoma Cancer, Historical Trends (since 2022) and Forecasted Estimates (Till 2035)
- 21.1.15. Photodynamic Therapy Market in Europe for Urothelial Cancer, Historical Trends (since 2022) and Forecasted Estimates (Till 2035)
- 21.2. Photodynamic Therapy Market in Europe: Distribution by Therapeutic Area
- 21.2.1. Photodynamic Therapy Market in Europe for Oncological Disorders, Historical Trends (since 2022) and Forecasted Estimates (Till 2035)
- 21.2.2. Photodynamic Therapy Market in Europe for Dermatological Disorders, Historical Trends (since 2022) and Forecasted Estimates (Till 2035)
- 21.2.3. Photodynamic Therapy Market in Europe for Ophthalmic Disorders, Historical Trends (since 2022) and Forecasted Estimates (Till 2035)
22. MARKET OPPORTUNITY ANALYSIS: ASIA-PACIFIC
- 22.1. Photodynamic Therapy Market in Asia-Pacific: Distribution by Target Indication
- 22.1.1. Photodynamic Therapy Market in Asia-Pacific for Actinic Keratosis, Historical Trends (since 2022) and Forecasted Estimates (Till 2035)
- 22.1.2. Photodynamic Therapy Market in Asia-Pacific for Prostate Cancer, Historical Trends (since 2022) and Forecasted Estimates (Till 2035)
- 22.1.3. Photodynamic Therapy Market in Asia-Pacific for Age-related Macular Degeneration, Historical Trends (since 2022) and Forecasted Estimates (Till 2035)
- 22.1.4. Photodynamic Therapy Market in Asia-Pacific for Head and Neck Squamous Cell Carcinoma, Historical Trends (since 2022) and Forecasted Estimates (Till 2035)
- 22.1.5. Photodynamic Therapy Market in Asia-Pacific for Basal Cell Carcinoma, Historical Trends (since 2022) and Forecasted Estimates (Till 2035)
- 22.1.6. Photodynamic Therapy Market in Asia-Pacific for Port Wine Stain, Historical Trends (since 2022) and Forecasted Estimates (Till 2035)
- 22.1.7. Photodynamic Therapy Market in Asia-Pacific for Barrett's Esophagus, Historical Trends (since 2022) and Forecasted Estimates (Till 2035)
- 22.1.8. Photodynamic Therapy Market in Asia-Pacific for Esophageal Cancer, Historical Trends (since 2022) and Forecasted Estimates (Till 2035)
- 22.1.9. Photodynamic Therapy Market in Asia-Pacific for Endobronchial Cancer, Historical Trends (since 2022) and Forecasted Estimates (Till 2035)
- 22.1.10. Photodynamic Therapy Market in Asia-Pacific for Lung Cancer, Historical Trends (since 2022) and Forecasted Estimates (Till 2035)
- 22.1.11. Photodynamic Therapy Market in Asia-Pacific for Bowen's Cancer, Historical Trends (since 2022) and Forecasted Estimates (Till 2035)
- 22.1.12. Photodynamic Therapy Market in Asia-Pacific for Brain Cancer, Historical Trends (since 2022) and Forecasted Estimates (Till 2035)
- 22.1.13. Photodynamic Therapy Market in Asia-Pacific for Bladder Cancer, Historical Trends (since 2022) and Forecasted Estimates (Till 2035)
- 22.1.14. Photodynamic Therapy Market in Asia-Pacific for T-cell Lymphoma Cancer, Historical Trends (since 2022) and Forecasted Estimates (Till 2035)
- 22.1.15. Photodynamic Therapy Market in Asia-Pacific for Urothelial Cancer, Historical Trends (since 2022) and Forecasted Estimates (Till 2035)
- 22.2. Photodynamic Therapy Market in Asia-Pacific: Distribution by Therapeutic Area
- 22.2.1. Photodynamic Therapy Market in Asia-Pacific for Oncological Disorders, Historical Trends (since 2022) and Forecasted Estimates (Till 2035)
- 22.2.2. Photodynamic Therapy Market in Asia-Pacific for Dermatological Disorders, Historical Trends (since 2022) and Forecasted Estimates (Till 2035)
- 22.2.3. Photodynamic Therapy Market in Asia-Pacific for Ophthalmic Disorders, Historical Trends (since 2022) and Forecasted Estimates (Till 2035)
23. MARKET OPPORTUNITY ANALYSIS: MIDDLE EAST AND NORTH AFRICA
- 23.1. Photodynamic Therapy Market in Middle East and North Africa: Distribution by Target Indication
- 23.1.1. Photodynamic Therapy Market in Middle East and North Africa for Actinic Keratosis, Historical Trends (since 2022) and Forecasted Estimates (Till 2035)
- 23.1.2. Photodynamic Therapy Market in Middle East and North Africa for Prostate Cancer, Historical Trends (since 2022) and Forecasted Estimates (Till 2035)
- 23.1.3. Photodynamic Therapy Market in Middle East and North Africa for Age-related Macular Degeneration, Historical Trends (since 2022) and Forecasted Estimates (Till 2035)
- 23.1.4. Photodynamic Therapy Market in Middle East and North Africa for Head and Neck Squamous Cell Carcinoma, Historical Trends (since 2022) and Forecasted Estimates (Till 2035)
- 23.1.5. Photodynamic Therapy Market in Middle East and North Africa for Basal Cell Carcinoma, Historical Trends (since 2022) and Forecasted Estimates (Till 2035)
- 23.1.6. Photodynamic Therapy Market in Middle East and North Africa for Port Wine Stain, Historical Trends (since 2022) and Forecasted Estimates (Till 2035)
- 23.1.7. Photodynamic Therapy Market in Middle East and North Africa for Barrett's Esophagus, Historical Trends (since 2022) and Forecasted Estimates (Till 2035)
- 23.1.8. Photodynamic Therapy Market in Middle East and North Africa for Esophageal Cancer, Historical Trends (since 2022) and Forecasted Estimates (Till 2035)
- 23.1.9. Photodynamic Therapy Market in Middle East and North Africa for Endobronchial Cancer, Historical Trends (since 2022) and Forecasted Estimates (Till 2035)
- 23.1.10. Photodynamic Therapy Market in Middle East and North Africa for Lung Cancer, Historical Trends (since 2022) and Forecasted Estimates (Till 2035)
- 23.1.11. Photodynamic Therapy Market in Middle East and North Africa for Bowen's Cancer, Historical Trends (since 2022) and Forecasted Estimates (Till 2035)
- 23.1.12. Photodynamic Therapy Market in Middle East and North Africa for Brain Cancer, Historical Trends (since 2022) and Forecasted Estimates (Till 2035)
- 23.1.13. Photodynamic Therapy Market in Middle East and North Africa for Bladder Cancer, Historical Trends (since 2022) and Forecasted Estimates (Till 2035)
- 23.1.14. Photodynamic Therapy Market in Middle East and North Africa for T-cell Lymphoma Cancer, Historical Trends (since 2022) and Forecasted Estimates (Till 2035)
- 23.1.15. Photodynamic Therapy Market in Middle East and North Africa for Urothelial Cancer, Historical Trends (since 2022) and Forecasted Estimates (Till 2035)
- 23.2. Photodynamic Therapy Market in Middle East and North Africa: Distribution by Therapeutic Area
- 23.2.1. Photodynamic Therapy Market in Middle East and North Africa for Oncological Disorders, Historical Trends (since 2022) and Forecasted Estimates (Till 2035)
- 23.2.2. Photodynamic Therapy Market in Middle East and North Africa for Dermatological Disorders, Historical Trends (since 2022) and Forecasted Estimates (Till 2035)
- 23.2.3. Photodynamic Therapy Market in Middle East and North Africa for Ophthalmic Disorders, Historical Trends (since 2022) and Forecasted Estimates (Till 2035)
*Detailed information on Chapter 20-23 is available in the Excel Data Packs shared along with the report**
