|
시장보고서
상품코드
1424481
가상 데스크톱 인프라(VDI) 시장 : 컴포넌트별, 조직 규모별, VDI 유형별, 딜리버리 모델별, 최종사용자별, 지역별Virtual Desktop Infrastructure Market, By Component, By Organization Size, By VDI Type, By Delivery Model, By End User, By Geography |
||||||
가상 데스크톱 인프라(VDI) 시장 규모는 2023년 64억 2,000만 달러에서 2030년에는 166억 6,000만 달러에 달할 것으로 예측되며, 예측 기간 중 CAGR은 14.6%입니다.
| 리포트 범위 | 리포트 상세 | ||
|---|---|---|---|
| 기준년 | 2022년 | 2023/2024년 시장 규모 | 64억 2,000만 달러 |
| 실적 데이터 | 2017-2021년 | 예측 기간 | 2023-2030 |
| 예측 기간 2023년/2024-2030년/2031년 CAGR : | 14.60% | 2030/2031년 가치 예측 | 166억 6,000만 달러 |

가상 데스크톱 인프라(VDI)는 사용자가 데스크톱 및 애플리케이션에 리모트로 액세스할 수 있도록 하는 혁신적인 기술이며, 현대 비즈니스에 유연하고 안전한 솔루션을 제공합니다. 원격근무가 급증하고, 데이터에 대한 심리스 액세스가 요구되는 가운데 VDI는 최근 더욱 더 보급되고 있습니다. 이 기술에 의해 직원은 모든 디바이스로부터 효율적으로 작업할 수 있게 되며, 물리적인 데스크톱 컴퓨터의 필요성을 없애고, IT 관리의 복잡성도 경감됩니다.
시장 역학 :
가상 데스크톱 인프라(VDI) 시장은 몇 가지 요인으로 인해 향후 수년간 크게 성장할 것으로 예상됩니다. 주요 요인 중 하나는 유연한 업무 환경에 대한 수요 증가입니다. 원격 근무의 등장으로 기업은 직원들이 어디서든 데스크톱과 용도에 액세스하여 생산성과 워라밸을 향상시킬 수 있는 솔루션을 찾고 있습니다.
VDI 시장의 또 다른 중요한 촉진요인은 데이터 보안에 대한 요구가 증가하고 있다는 점입니다. VDI는 데스크톱과 용도을 안전한 서버 환경에 집중시킴으로써 데이터 유출을 방지하고 민감한 정보를 보호할 수 있습니다. 이 기능은 다양한 분야의 기업, 특히 금융, 의료, 정부 기관 등 민감한 데이터를 다루는 기업에서 매우 중요해지고 있습니다.
그러나 VDI 시장에는 일정한 억제요인도 존재합니다. 그 중 하나는 VDI 인프라 구축에 필요한 초기 자본 투자입니다. 필요한 서버, 스토리지 시스템, 가상화 소프트웨어 설치는 많은 조직, 특히 중소기업의 경우 많은 비용이 소요됩니다. 또한 VDI를 원활하게 운영하기 위해서는 강력한 네트워크 인프라와 고속 인터넷 연결이 필수적이며, 이는 인터넷 접속이 제한적인 지역의 기업에게는 문제가 될 수 있습니다.
본 조사의 주요 특징
- 세계의 가상 데스크톱 인프라(VDI) 시장을 상세히 분석하고, 2022년을 기준년으로 한 예측 기간(2023-2030년)의 시장 규모 및 CAGR을 제공합니다.
- 또한 다양한 부문에서 잠재적 매출 성장 기회를 설명하고, 이 시장에 대한 매력적인 투자 제안 매트릭스에 대해 해설하고 있습니다.
- 또한 시장 촉진요인, 억제요인, 기회, 신제품의 발매 및 승인, 시장 동향, 지역별 전망, 주요 기업이 채택하는 경쟁 전략 등에 관한 주요 인사이트도 제공하고 있습니다.
- 기업 하이라이트, 제품 포트폴리오, 주요 하이라이트, 실적, 전략 등의 파라미터에 기반하여 세계의 가상 데스크톱 인프라 스트럭쳐 시장의 주요 기업을 프로파일링하고 있습니다.
- 본 리포트로부터의 인사이트에 의해 마케팅 담당자 및 기업의 경영진은 향후 제품 발매, 유형 업그레이드, 시장 확대, 마케팅 전술에 관하여 정보에 기반한 의사결정을 시행할 수 있습니다.
- 이 조사 리포트는 투자자, 공급업체, 제품 제조업체, 유통업체, 신규 참여업체, 재무 애널리스트 등 이 업계의 다양한 이해관계자를 대상으로 하고 있습니다.
- 이해관계자는 세계의 가상 데스크톱 인프라(VDI) 시장 분석에 사용되는 다양한 전략 매트릭스를 통해 의사결정을 용이하게 할 수 있습니다.
목차
제1장 조사의 목적과 전제조건
- 조사 목적
- 전제조건
- 약어
제2장 시장 전망
- 리포트 설명
- 시장의 정의와 범위
- 주요 요약
- Coherent Opportunity Map(COM)
제3장 시장 역학, 규제, 동향 분석
- 시장 역학
- 원격근무 도입의 증가
- 높은 도입 비용
- 클라우드 기반 VDI 솔루션의 도입
- 영향 분석
- 주요 하이라이트
- 규제 시나리오
- 제품의 발매/승인
- PEST 분석
- Porter의 산업 분석
- 합병과 인수 시나리오
제4장 가상 데스크톱 인프라(VDI) 시장 - 코로나바이러스(COVID-19) 팬데믹의 영향
- 신종 코로나바이러스 감염증(COVID-19)의 역학
- 공급측과 수요측 분석
- 경제적 영향
제5장 가상 데스크톱 인프라(VDI) 시장, 컴포넌트별, 2023-2030년
- 소프트웨어
- 하드웨어
- 서비스
제6장 가상 데스크톱 인프라(VDI) 시장, 조직 규모별, 2023-2030년
- 대기업
- 중소기업
제7장 가상 데스크톱 인프라(VDI) 시장, VDI 유형별, 2023-2030년
- 영속적 VDI
- 비영속적 VDI
- 리모트 데스크톱 서비스
제8장 가상 데스크톱 인프라(VDI) 시장, 딜리버리 모델별, 2023-2030년
- 온프레미스 VDI
- 클라우드 기반 VDI
- 하이브리드 VDI
제9장 가상 데스크톱 인프라(VDI) 시장, 최종사용자별, 2023-2030년
- IT & 통신
- BFSI
- 교육
- 헬스케어
- 정부
- 기타
제10장 가상 데스크톱 인프라(VDI) 시장, 지역별, 2023-2030년
- 북미
- 미국
- 캐나다
- 유럽
- 독일
- 영국
- 스페인
- 프랑스
- 이탈리아
- 러시아
- 기타 유럽
- 아시아태평양
- 중국
- 인도
- 일본
- 호주
- 한국
- ASEAN
- 라틴아메리카
- 브라질
- 아르헨티나
- 멕시코
- 기타 라틴아메리카
- 중동 및 아프리카
- 이스라엘
- 남아프리카
- 북아프리카
- 중앙아프리카
- 기타 중동
제11장 경쟁 구도
- VMware
- Citrix Systems
- Microsoft
- Cisco Systems
- Oracle
- Red Hat
- Huawei
- Hewlett Packard Enterprise
- Parallels International
- Others
제12장 섹션
- 조사 방법
- 출판사 소개
The Virtual Desktop Infrastructure (VDI) market size is expected to reach US$ 16.66 Bn by 2030, from US$ 6.42 Bn in 2023, at a CAGR of 14.6% during the forecast period.
| Report Coverage | Report Details | ||
|---|---|---|---|
| Base Year: | 2022 | Market Size in 2023/2024: | US$ 6.42 Bn |
| Historical Data for: | 2017 to 2021 | Forecast Period: | 2023 - 2030 |
| Forecast Period 2023/2024 to 2030/2031 CAGR: | 14.60% | 2030/2031 Value Projection: | US$ 16.66 Bn |
Virtual Desktop Infrastructure (VDI) is an innovative technology that enables users to access their desktops and applications remotely, providing a flexible and secure solution for modern businesses. With the rapid growth of remote workforces and the need for seamless access to data, VDI has become increasingly popular in recent years. This technology allows employees to work efficiently from any device, eliminating the need for physical desktop computers and reducing IT management complexities.
Market Dynamics:
The Virtual Desktop Infrastructure (VDI) market is poised for substantial growth in the coming years, driven by several factors. One of the primary drivers is the rising demand for flexible working environments. With the advent of remote work arrangements, businesses are seeking solutions that enable employees to access their desktops and applications from any location, enhancing productivity and work-life balance.
Another significant driver of the VDI market is the increasing need for data security. By centralizing desktops and applications in a secure server environment, VDI helps prevent data breaches and protects sensitive information. This feature has become crucial for businesses across various sectors, particularly those dealing with confidential data such as finance, healthcare, and government institutions.
However, the VDI market also faces certain restraints. One such restraint is the initial capital investment required to implement the VDI infrastructure. Setting up the necessary servers, storage systems, and virtualization software can be costly for many organizations, especially small and medium-sized enterprises. Additionally, the need for robust network infrastructure and high-speed internet connectivity is essential to ensure smooth VDI operations, which may pose challenges for companies in regions with limited internet access.
Key Features of the Study:
- This report provides an in-depth analysis of the global virtual desktop infrastructure market, and provides market size (US$ Billion) and compound annual growth rate (CAGR%) for the forecast period (2023-2030), considering 2022 as the base year
- It elucidates potential revenue growth opportunities across different segments and explains attractive investment proposition matrices for this market
- This study also provides key insights about market drivers, restraints, opportunities, new product launches or approvals, market trends, regional outlook, and competitive strategies adopted by key players
- It profiles key players in the global virtual desktop infrastructure market based on the following parameters - company highlights, products portfolio, key highlights, financial performance, and strategies
- Key companies covered as a part of this study include VMware, Citrix Systems, Microsoft, Cisco Systems, Oracle, Red Hat, Huawei, Hewlett Packard Enterprise, Parallels International, Dynabook Americas, Dell Technologies, IGEL Technology, Amazon Web Services, Nutanix, 10ZiG Technology, Splashtop, Nerdio, HiveIO, SherWeb, and Login VSI
- Insights from this report would allow marketers and the management authorities of the companies to make informed decisions regarding their future product launches, type up-gradation, market expansion, and marketing tactics
- The global virtual desktop infrastructure market report caters to various stakeholders in this industry including investors, suppliers, product manufacturers, distributors, new entrants, and financial analysts
- Stakeholders would have ease in decision-making through various strategy matrices used in analyzing the global virtual desktop infrastructure market
Detailed Segmentation:
- By Component
- Software
- Hardware
- Services
- By Organization Size
- Large Enterprises
- Small & Medium Enterprises
- By VDI Type
- Persistent VDI
- Non-Persistent VDI
- Remote Desktop Services
- By Delivery Model
- On-Premise VDI
- Cloud-Based VDI
- Hybrid VDI
- By End User
- IT & Telecom
- BFSI
- Education
- Healthcare
- Government
- Others
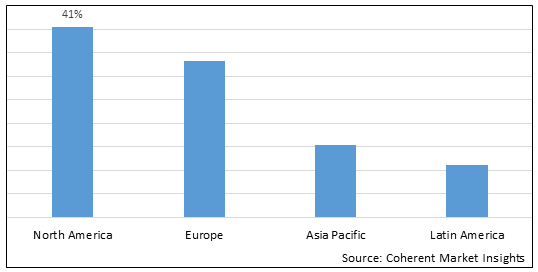
- By Region
- North America
- Asia Pacific
- Europe
- Latin America
- Middle East & Africa
- Company Profile
- VMware
- Citrix Systems
- Microsoft
- Cisco Systems
- Oracle
- Red Hat
- Huawei
- Hewlett Packard Enterprise
- Parallels International
- Dynabook Americas
- Dell Technologies
- IGEL Technology
- Amazon Web Services
- Nutanix
- 10ZiG Technology
- Splashtop
- Nerdio
- HiveIO
- SherWeb
- Login VSI
Table of Contents
1. Research Objectives and Assumptions
- Research Objectives
- Assumptions
- Abbreviations
2. Market Purview
- Report Description
- Market Definition and Scope
- Executive Summary
- Market Virtual Desktop Infrastructure (VDI, By Component
- Market Virtual Desktop Infrastructure (VDI, By Organization Size
- Market Virtual Desktop Infrastructure (VDI, By VDI Type
- Market Virtual Desktop Infrastructure (VDI, By Delivery Model
- Market Virtual Desktop Infrastructure (VDI, By End User
- Market Virtual Desktop Infrastructure (VDI, By Region
- Coherent Opportunity Map (COM)
3. Market Dynamics, Regulations, and Trends Analysis
- Market Dynamics
- Increasing remote work adoption
- High deployment costs
- Adoption of Cloud-Based VDI Solutions
- Impact Analysis
- Key Highlights
- Regulatory Scenario
- Product launch/Approvals
- PEST Analysis
- PORTER's Analysis
- Merger and Acquisition Scenario
4. Virtual Desktop Infrastructure (VDI Market - Impact of Coronavirus (COVID-19) Pandemic
- COVID-19 Epidemiology
- Supply Side and Demand Side Analysis
- Economic Impact
5. Virtual Desktop Infrastructure (VDI Market , By Component, 2023-2030, (US$ Bn)
- Introduction
- Market Share Analysis, 2023 and 2030 (%)
- Y-o-Y Growth Analysis, 2018 - 2030
- Segment Trends
- Software
- Introduction
- Market Size and Forecast, and Y-o-Y Growth, 2017-2030,(US$ Bn)
- Hardware
- Introduction
- Market Size and Forecast, and Y-o-Y Growth, 2017-2030,(US$ Bn)
- Services
- Introduction
- Market Size and Forecast, and Y-o-Y Growth, 2017-2030,(US$ Bn)
6. Virtual Desktop Infrastructure (VDI Market , By Organization Size, 2023-2030, (US$ Bn)
- Introduction
- Market Share Analysis, 2023 and 2030 (%)
- Y-o-Y Growth Analysis, 2018 - 2030
- Segment Trends
- Large Enterprises
- Introduction
- Market Size and Forecast, and Y-o-Y Growth, 2017-2030,(US$ Billion)
- Small & Medium Enterprises
- Introduction
- Market Size and Forecast, and Y-o-Y Growth, 2017-2030,(US$ Billion)
7. Virtual Desktop Infrastructure (VDI Market , By VDI Type, 2023-2030, (US$ Bn)
- Introduction
- Market Share Analysis, 2023 and 2030 (%)
- Y-o-Y Growth Analysis, 2018 - 2030
- Segment Trends
- Persistent VDI
- Introduction
- Market Size and Forecast, and Y-o-Y Growth, 2017-2030,(US$ Billion)
- Non-Persistent VDI
- Introduction
- Market Size and Forecast, and Y-o-Y Growth, 2017-2030,(US$ Billion)
- Remote Desktop Services
- Introduction
- Market Size and Forecast, and Y-o-Y Growth, 2017-2030,(US$ Billion)
8. Virtual Desktop Infrastructure (VDI Market , By Delivery Model, 2023-2030, (US$ Bn)
- Introduction
- Market Share Analysis, 2023 and 2030 (%)
- Y-o-Y Growth Analysis, 2018 - 2030
- Segment Trends
- On-Premise VDI
- Introduction
- Market Size and Forecast, and Y-o-Y Growth, 2017-2030,(US$ Billion)
- Cloud-Based VDI
- Introduction
- Market Size and Forecast, and Y-o-Y Growth, 2017-2030,(US$ Billion)
- Hybrid VDI
- Introduction
- Market Size and Forecast, and Y-o-Y Growth, 2017-2030,(US$ Billion)
9. Virtual Desktop Infrastructure (VDI Market , By End-User, 2023-2030, (US$ Bn)
- Introduction
- Market Share Analysis, 2023 and 2030 (%)
- Y-o-Y Growth Analysis, 2018 - 2030
- Segment Trends
- IT & Telecom
- Introduction
- Market Size and Forecast, and Y-o-Y Growth, 2017-2030,(US$ Billion)
- BFSI
- Introduction
- Market Size and Forecast, and Y-o-Y Growth, 2017-2030,(US$ Billion)
- Education
- Introduction
- Market Size and Forecast, and Y-o-Y Growth, 2017-2030,(US$ Billion)
- Healthcare
- Introduction
- Market Size and Forecast, and Y-o-Y Growth, 2017-2030,(US$ Billion)
- Government
- Introduction
- Market Size and Forecast, and Y-o-Y Growth, 2017-2030,(US$ Billion)
- Others
- Introduction
- Market Size and Forecast, and Y-o-Y Growth, 2017-2030,(US$ Billion)
10. Virtual Desktop Infrastructure (VDI Market , By Region, 2023-2030, (US$ Bn)
- Introduction
- Market Share Analysis, By Country, 2023 and 2030 (%)
- Y-o-Y Growth Analysis, For Country 2018 -2030
- Country Trends
- North America
- Introduction
- Market Size and Forecast, and Y-o-Y Growth, By Component, 2023-2030,(US$ Bn)
- Market Size and Forecast, and Y-o-Y Growth, By Organization Size, 2023-2030,(US$ Bn)
- Market Size and Forecast, and Y-o-Y Growth, By VDI Type, 2023-2030,(US$ Bn)
- Market Size and Forecast, and Y-o-Y Growth, By Delivery Model, 2023-2030,(US$ Bn)
- Market Size and Forecast, and Y-o-Y Growth, By End User, 2023-2030,(US$ Bn)
- U.S.
- Canada
- Europe
- Introduction
- Market Size and Forecast, and Y-o-Y Growth, By Component, 2023-2030,(US$ Bn)
- Market Size and Forecast, and Y-o-Y Growth, By Organization Size, 2023-2030,(US$ Bn)
- Market Size and Forecast, and Y-o-Y Growth, By VDI Type, 2023-2030,(US$ Bn)
- Market Size and Forecast, and Y-o-Y Growth, By Delivery Model, 2023-2030,(US$ Bn)
- Market Size and Forecast, and Y-o-Y Growth, By End User, 2023-2030,(US$ Bn)
- Germany
- U.K.
- Spain
- France
- Italy
- Russia
- Rest of Europe
- Asia Pacific
- Introduction
- Market Size and Forecast, and Y-o-Y Growth, By Component, 2023-2030,(US$ Bn)
- Market Size and Forecast, and Y-o-Y Growth, By Organization Size, 2023-2030,(US$ Bn)
- Market Size and Forecast, and Y-o-Y Growth, By VDI Type, 2023-2030,(US$ Bn)
- Market Size and Forecast, and Y-o-Y Growth, By Delivery Model, 2023-2030,(US$ Bn)
- Market Size and Forecast, and Y-o-Y Growth, By End User, 2023-2030,(US$ Bn)
- China
- India
- Japan
- Australia
- South Korea
- ASEAN
- Latin America
- Introduction
- Market Size and Forecast, and Y-o-Y Growth, By Component, 2023-2030,(US$ Bn)
- Market Size and Forecast, and Y-o-Y Growth, By Organization Size, 2023-2030,(US$ Bn)
- Market Size and Forecast, and Y-o-Y Growth, By VDI Type, 2023-2030,(US$ Bn)
- Market Size and Forecast, and Y-o-Y Growth, By Delivery Model, 2023-2030,(US$ Bn)
- Market Size and Forecast, and Y-o-Y Growth, By End User, 2023-2030,(US$ Bn)
- Brazil
- Argentina
- Mexico
- Rest of Latin America
- Middle East & Africa
- Introduction
- Market Size and Forecast, and Y-o-Y Growth, By Component, 2023-2030,(US$ Bn)
- Market Size and Forecast, and Y-o-Y Growth, By Organization Size, 2023-2030,(US$ Bn)
- Market Size and Forecast, and Y-o-Y Growth, By VDI Type, 2023-2030,(US$ Bn)
- Market Size and Forecast, and Y-o-Y Growth, By Delivery Model, 2023-2030,(US$ Bn)
- Market Size and Forecast, and Y-o-Y Growth, By End User, 2023-2030,(US$ Bn)
- Israel
- South Africa
- North Africa
- Central Africa
- Rest of Middle East
11. Competitive Landscape
- VMware
- Company Highlights
- Product Portfolio
- Key Developments
- Financial Performance
- Strategies
- Citrix Systems
- Microsoft
- Cisco Systems
- Oracle
- Red Hat
- Huawei
- Hewlett Packard Enterprise
- Parallels International
- Others
- Analyst Views
12. Section
- Research Methodology
- About us