|
시장보고서
상품코드
1672709
OLED 디스플레이 시장 : 디스플레이 유형별, 용도별, 최종 사용자별, 지역별OLED Displays Market, By Display Type, By Application, By End User, By Geography |
||||||
세계의 OLED 디스플레이 시장은 2025년에는 471억 7,000만 달러를 기록할 것으로 추정됩니다. 2032년에는 1,210억 4,000만 달러에 이를 것으로 예측되며, 2025-2032년의 CAGR은 14.4%를 나타낼 것으로 전망됩니다.
| 보고 범위 | 보고서 세부정보 | ||
|---|---|---|---|
| 기준 연도 | 2024년 | 2025년 시장 규모 | 471억 7,000만 달러 |
| 실적 데이터 | 2020-2024년 | 예측 기간 | 2025-2032년 |
| 예측 기간(2025-2032년) CAGR | 14.40% | 2032년 금액 예측 | 1,210억 4,000만 달러 |

OLED 디스플레이 시장은 세계적으로 큰 성장을 이루고 있습니다. OLED(유기 LED)는 전류를 흘리면 발광하는 유기 화합물의 박막을 사용한 발광 기술입니다. OLED 디스플레이는 높은 대비, 넓은 시야각, 선명한 색상, 얇은 크기, 유연성 등의 우수한 특성으로 LCD 디스플레이를 대체합니다. OLED 기술의 진보로 스마트폰, TV, 노트북, 간판·조명, 웨어러블 등 다양한 산업에서의 사용이 가능하게 되었습니다. OLED 디스플레이 시장의 미래는 지속적으로 견고하며 분석가들은 다양화되는 최종 이용 산업에서의 수요 증가를 배경으로 향후 10년간 2자리 성장률을 기록할 것으로 예측됩니다.
시장 역학
세계의 OLED 디스플레이 시장은 OLED TV 등장, 대형 및 연질 디스플레이 수요 증가, 전자 기기의 소형화, 새로운 폼 팩터를 가능하게 하는 기술 혁신 등의 요인에 의해 견인되고 있습니다. 그러나 높은 제조 비용, 한정된 수명, 대량 생산에 있어서의 과제 등이 시장 성장의 발판이 되고 있습니다. 호기는 디지털 사이니지에서 투명 OLED 디스플레이를 채택하고 증강현실(AR) 용도을 위한 투명 및 웨어러블 디스플레이를 개발하는 데 있습니다.
본 조사의 주요 특징
본 보고서에서는 세계의 OLED 디스플레이 시장을 상세하게 분석하여 2024년을 기준연도로 한 예측기간(2025-2032년) 시장 규모(10억 달러)와 복합연간 성장률(CAGR%)을 제공합니다.
또한 다양한 부문에서 잠재적인 수익 기회를 밝히고 이 시장의 매력적인 투자 제안 매트릭스를 설명합니다.
또한 시장 성장 촉진요인, 억제요인, 기회, 신제품의 출시 및 승인, 시장 동향, 지역에 의한 전망, 주요 기업이 채용하는 경쟁 전략 등에 관한 주요 인사이트도 제공합니다.
이 조사의 대상이 되는 주요 기업은 AU Optronics, BOE Technology Group, Canon Inc., LG Display, Mitsubishi Electric Corporation, Panasonic Corporation, Samsung Display, Sharp Corporation, Sony Corporation, Sumitomo Chemical Co., Ltd., Tianma Microelectronics, Universal Display Corporation, Visionox Technology Inc., Wistron NeWeb Corporation, and JOLED Inc. 등이 있습니다.
이 보고서의 인사이트를 통해 마케팅 담당자와 기업 경영진은 향후 제품 출시, 타이핑, 시장 확대, 마케팅 전술에 대한 정보를 바탕으로 의사 결정을 내릴 수 있습니다.
세계의 OLED 디스플레이 시장 보고서는 투자자, 공급업체, 제품 제조업체, 유통업체, 신규 참가자, 재무 분석가 등 이 산업의 다양한 이해관계자를 대상으로 합니다.
이해관계자는 세계의 OLED 디스플레이 시장 분석에 사용되는 다양한 전략 매트릭스를 통해 의사결정을 용이하게 할 수 있습니다.
목차
제1장 조사의 목적과 전제조건
- 조사 목적
- 전제조건
- 약어
제2장 시장 전망
- 보고서 설명
- 시장 정의와 범위
- 주요 요약
제3장 시장 역학, 규제, 동향 분석
- 시장 역학
- 영향 분석
- 규제 시나리오
- 제품 출시/승인
- PEST 분석
- Porter's Five Forces 분석
- 합병과 인수 시나리오
제4장 세계의 OLED 디스플레이 시장, 디스플레이 유형별(2025-2032년), 10억 달러
- 서론
- 플렉시블 OLED 디스플레이
- 리지드 OLED 디스플레이
- 투명 OLED 디스플레이
- 폴더블 OLED 디스플레이
제5장 세계의 OLED 디스플레이 시장, 용도별(2025-2032년), 10억 달러
- 서론
- 스마트폰 및 태블릿
- TV
- 노트북과 데스크톱
- 웨어러블
- 자동차용 디스플레이
- 기타(공업, 표지 등)
제6장 세계의 OLED 디스플레이 시장, 최종 사용자별(2025-2032년), 10억 달러
- 서론
- 소비자용 전자 기기
- 자동차
- 항공우주 및 방위
- 의료
- 기타(공업, 소매 등)
제7장 세계의 OLED 디스플레이 시장, 지역별(2020-2032년), 10억 달러
- 서론
- 북미
- 라틴아메리카
- 유럽
- 아시아태평양
- 중동
- 아프리카
제8장 경쟁 구도
- AU Optronics
- BOE Technology Group
- Canon Inc.
- LG Display
- Mitsubishi Electric Corporation
- Panasonic Corporation
- Samsung Display
- Sharp Corporation
- Sony Corporation
- Sumitomo Chemical Co., Ltd.
- Tianma Microelectronics
- Universal Display Corporation
- Visionox Technology Inc.
- Wistron NeWeb Corporation
- JOLED Inc.
제9장 애널리스트 추천
- 융성과 쇠퇴
- 일관형 기회 맵
제10장 참고문헌과 조사 방법
- 참고문헌
- 조사 방법
- 출판사에 대해
Global Oled Displays Market is estimated to be valued at USD 47.17 Bn in 2025 and is expected to reach USD 121.04 Bn by 2032, growing at a compound annual growth rate (CAGR) of 14.4% from 2025 to 2032.
| Report Coverage | Report Details | ||
|---|---|---|---|
| Base Year: | 2024 | Market Size in 2025: | USD 47.17 Bn |
| Historical Data for: | 2020 To 2024 | Forecast Period: | 2025 To 2032 |
| Forecast Period 2025 to 2032 CAGR: | 14.40% | 2032 Value Projection: | USD 121.04 Bn |
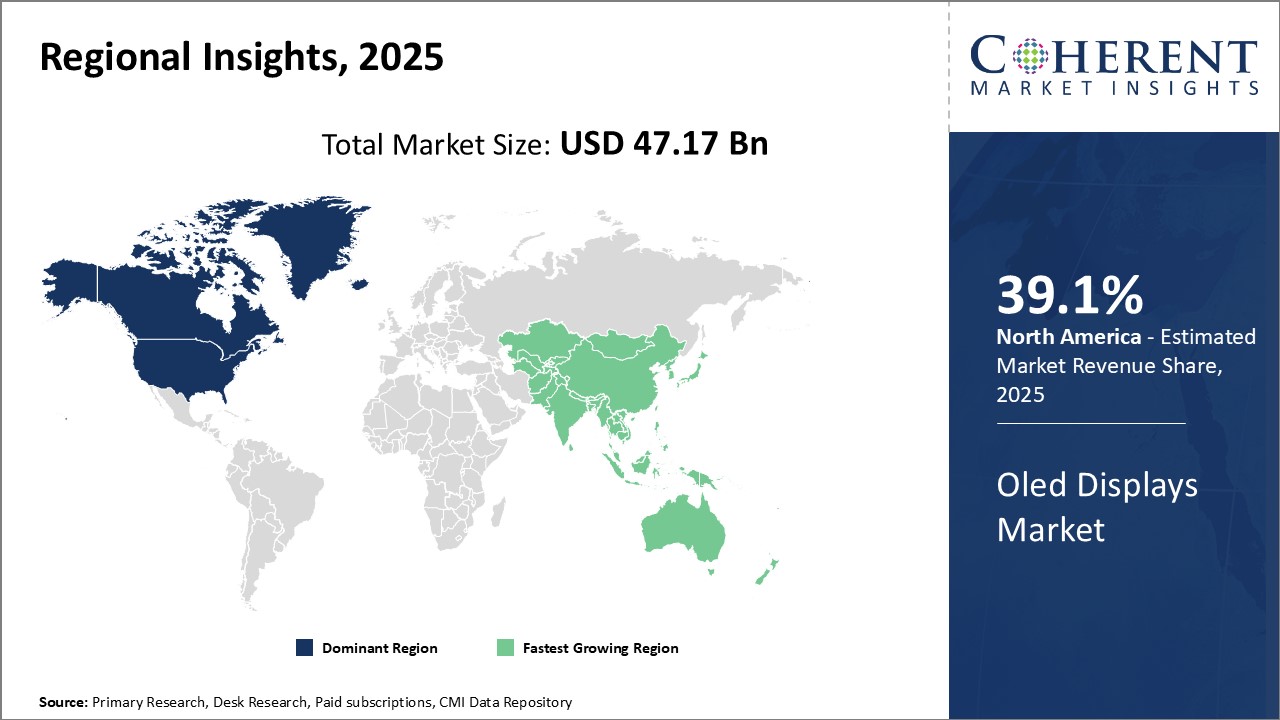
The OLED displays market is witnessing significant growth globally. OLED or organic light-emitting diode is a light-emitting technology that uses thin films made of organic compounds that emit light when electric current is applied. OLED displays are increasingly replacing LCD displays owing to their superior properties such as high contrast, wide viewing angles, vivid colors, thin size, and flexibility. Advancements in OLED technology have enabled their use across various industries including smartphones, televisions, laptops, signs & lighting, wearables, and others. The future prospects for the OLED display market remain bullish with analysts predicting double-digit growth rates over the next decade on the back of rising demand from diversifying end-use industries.
Market Dynamics:
The global OLED displays market is being driven by factors such as the advent of OLED televisions, increasing demand for large-size & flexible displays, miniaturization of electronic devices, and innovations enabling new form factors. However, high manufacturing costs, limited lifespans, and challenges in mass production are some challenges dampening market growth. Opportunities lie in the adoption of transparent OLED displays in digital signage and development of transparent & wearable displays for augmented reality applications.
Key features of the study:
This report provides in-depth analysis of the global OLED displays market, and provides market size (US$ Bn) and compound annual growth rate (CAGR%) for the forecast period (2025-2032), considering 2024 as the base year
It elucidates potential revenue opportunities across different segments and explains attractive investment proposition matrices for this market
This study also provides key insights about market drivers, restraints, opportunities, new product launches or approval, market trends, regional outlook, and competitive strategies adopted by key players
Key companies covered as a part of this study include AU Optronics, BOE Technology Group, Canon Inc., LG Display, Mitsubishi Electric Corporation, Panasonic Corporation, Samsung Display, Sharp Corporation, Sony Corporation, Sumitomo Chemical Co., Ltd., Tianma Microelectronics, Universal Display Corporation, Visionox Technology Inc., Wistron NeWeb Corporation, and JOLED Inc.
Insights from this report would allow marketers and the management authorities of the companies to make informed decisions regarding their future product launches, type up-gradation, market expansion, and marketing tactics
The global OLED displays market report caters to various stakeholders in this industry including investors, suppliers, product manufacturers, distributors, new entrants, and financial analysts
Stakeholders would have ease in decision-making through various strategy matrices used in analyzing the global OLED displays market.
Detailed Segmentation:
- Display Type Insights (Revenue, USD Bn, 2020 - 2032)
- Flexible OLED Displays
- Rigid OLED Displays
- Transparent OLED Displays
- Foldable OLED Displays
- Application Insights (Revenue, USD Bn, 2020 - 2032)
- Smartphones and Tablets
- Televisions
- Laptops and Desktops
- Wearables
- Automotive Displays
- Others (Industrial, Signage, etc.)
- End User Insights (Revenue, USD Bn, 2020 - 2032)
- Consumer Electronics
- Automotive
- Aerospace and Defense
- Healthcare
- Others (Industrial, Retail, etc.)
- By Regional Insights (Revenue, USD Bn, 2020 - 2032)
- North America
- U.S.
- Canada
- Latin America
- Brazil
- Argentina
- Mexico
- Rest of Latin America
- Europe
- Germany
- U.K.
- Spain
- France
- Italy
- Russia
- Rest of Europe
- Asia Pacific
- China
- India
- Japan
- Australia
- South Korea
- ASEAN
- Rest of Asia Pacific
- Middle East
- GCC Countries
- Israel
- Rest of Middle East
- Africa
- South Africa
- North Africa
- Central Africa
- Key Players Insights
- AU Optronics
- BOE Technology Group
- Canon Inc.
- LG Display
- Mitsubishi Electric Corporation
- Panasonic Corporation
- Samsung Display
- Sharp Corporation
- Sony Corporation
- Sumitomo Chemical Co., Ltd.
- Tianma Microelectronics
- Universal Display Corporation
- Visionox Technology Inc.
- Wistron NeWeb Corporation
- JOLED Inc.
Table of Contents
1. RESEARCH OBJECTIVES AND ASSUMPTIONS
- Research Objectives
- Assumptions
- Abbreviations
2. MARKET PURVIEW
- Report Description
- Market Definition and Scope
- Executive Summary
- Global OLED Displays Market, By Display Type
- Global OLED Displays Market, By Application
- Global OLED Displays Market, By End User
- Global OLED Displays Market, By Region
3. MARKET DYNAMICS, REGULATIONS, AND TRENDS ANALYSIS
- Market Dynamics
- Impact Analysis
- Key Highlights
- Regulatory Scenario
- Product Launches/Approvals
- PEST Analysis
- PORTER's Analysis
- Merger and Acquisition Scenario
4. Global OLED Displays Market, By Display Type, 2025-2032, (USD Bn)
- Introduction
- Market Share Analysis, 2025 and 2032 (%)
- Y-o-Y Growth Analysis, 2020 - 2032
- Segment Trends
- Flexible OLED Displays
- Introduction
- Market Size and Forecast, and Y-o-Y Growth, 2020-2032, (USD Bn)
- Rigid OLED Displays
- Introduction
- Market Size and Forecast, and Y-o-Y Growth, 2020-2032, (USD Bn)
- Transparent OLED Displays
- Introduction
- Market Size and Forecast, and Y-o-Y Growth, 2020-2032, (USD Bn)
- Foldable OLED Displays
- Introduction
- Market Size and Forecast, and Y-o-Y Growth, 2020-2032, (USD Bn)
5. Global OLED Displays Market, By Application, 2025-2032, (USD Bn)
- Introduction
- Market Share Analysis, 2025 and 2032 (%)
- Y-o-Y Growth Analysis, 2020 - 2032
- Segment Trends
- Smartphones and Tablets
- Introduction
- Market Size and Forecast, and Y-o-Y Growth, 2020-2032, (USD Bn)
- Televisions
- Introduction
- Market Size and Forecast, and Y-o-Y Growth, 2020-2032, (USD Bn)
- Laptops and Desktops
- Introduction
- Market Size and Forecast, and Y-o-Y Growth, 2020-2032, (USD Bn)
- Wearables
- Introduction
- Market Size and Forecast, and Y-o-Y Growth, 2020-2032, (USD Bn)
- Automotive Displays
- Introduction
- Market Size and Forecast, and Y-o-Y Growth, 2020-2032, (USD Bn)
- Others (Industrial, Signage, etc.)
- Introduction
- Market Size and Forecast, and Y-o-Y Growth, 2020-2032, (USD Bn)
6. Global OLED Displays Market, By End User, 2025-2032, (USD Bn)
- Introduction
- Market Share Analysis, 2025 and 2032 (%)
- Y-o-Y Growth Analysis, 2020 - 2032
- Segment Trends
- Consumer Electronics
- Introduction
- Market Size and Forecast, and Y-o-Y Growth, 2020-2032, (USD Bn)
- Automotive
- Introduction
- Market Size and Forecast, and Y-o-Y Growth, 2020-2032, (USD Bn)
- Aerospace and Defense
- Introduction
- Market Size and Forecast, and Y-o-Y Growth, 2020-2032, (USD Bn)
- Healthcare
- Introduction
- Market Size and Forecast, and Y-o-Y Growth, 2020-2032, (USD Bn)
- Others (Industrial, Retail, etc.)
- Introduction
- Market Size and Forecast, and Y-o-Y Growth, 2020-2032, (USD Bn)
7. Global OLED Displays Market, By Region, 2020 - 2032, Value (USD Bn)
- Introduction
- Market Share (%) Analysis, 2025,2028 & 2032, Value (USD Bn)
- Market Y-o-Y Growth Analysis (%), 2020 - 2032, Value (USD Bn)
- Regional Trends
- North America
- Introduction
- Market Size and Forecast, By Display Type, 2020 - 2032, Value (USD Bn)
- Market Size and Forecast, By Application, 2020 - 2032, Value (USD Bn)
- Market Size and Forecast, By End User, 2020 - 2032, Value (USD Bn)
- Market Size and Forecast, By Country, 2020 - 2032, Value (USD Bn)
- U.S.
- Canada
- Latin America
- Introduction
- Market Size and Forecast, By Display Type, 2020 - 2032, Value (USD Bn)
- Market Size and Forecast, By Application, 2020 - 2032, Value (USD Bn)
- Market Size and Forecast, By End User, 2020 - 2032, Value (USD Bn)
- Market Size and Forecast, By Country, 2020 - 2032, Value (USD Bn)
- Brazil
- Argentina
- Mexico
- Rest of Latin America
- Europe
- Introduction
- Market Size and Forecast, By Display Type, 2020 - 2032, Value (USD Bn)
- Market Size and Forecast, By Application, 2020 - 2032, Value (USD Bn)
- Market Size and Forecast, By End User, 2020 - 2032, Value (USD Bn)
- Market Size and Forecast, By Country, 2020 - 2032, Value (USD Bn)
- Germany
- U.K.
- Spain
- France
- Italy
- Russia
- Rest of Europe
- Asia Pacific
- Introduction
- Market Size and Forecast, By Display Type, 2020 - 2032, Value (USD Bn)
- Market Size and Forecast, By Application, 2020 - 2032, Value (USD Bn)
- Market Size and Forecast, By End User, 2020 - 2032, Value (USD Bn)
- Market Size and Forecast, By Country, 2020 - 2032, Value (USD Bn)
- China
- India
- Japan
- Australia
- South Korea
- ASEAN
- Rest of Asia Pacific
- Middle East
- Introduction
- Market Size and Forecast, By Display Type, 2020 - 2032, Value (USD Bn)
- Market Size and Forecast, By Application, 2020 - 2032, Value (USD Bn)
- Market Size and Forecast, By End User, 2020 - 2032, Value (USD Bn)
- Market Size and Forecast, By Country, 2020 - 2032, Value (USD Bn)
- GCC Countries
- Israel
- Rest of Middle East
- Africa
- Introduction
- Market Size and Forecast, By Display Type, 2020 - 2032, Value (USD Bn)
- Market Size and Forecast, By Application, 2020 - 2032, Value (USD Bn)
- Market Size and Forecast, By End User, 2020 - 2032, Value (USD Bn)
- Market Size and Forecast, By Country, 2020 - 2032, Value (USD Bn)
- South Africa
- North Africa
- Central Africa
8. COMPETITIVE LANDSCAPE
- AU Optronics
- Company Highlights
- Product Portfolio
- Key Developments
- Financial Performance
- Strategies
- BOE Technology Group
- Company Highlights
- Product Portfolio
- Key Developments
- Financial Performance
- Strategies
- Canon Inc.
- Company Highlights
- Product Portfolio
- Key Developments
- Financial Performance
- Strategies
- LG Display
- Company Highlights
- Product Portfolio
- Key Developments
- Financial Performance
- Strategies
- Mitsubishi Electric Corporation
- Company Highlights
- Product Portfolio
- Key Developments
- Financial Performance
- Strategies
- Panasonic Corporation
- Company Highlights
- Product Portfolio
- Key Developments
- Financial Performance
- Strategies
- Samsung Display
- Company Highlights
- Product Portfolio
- Key Developments
- Financial Performance
- Strategies
- Sharp Corporation
- Company Highlights
- Product Portfolio
- Key Developments
- Financial Performance
- Strategies
- Sony Corporation
- Company Highlights
- Product Portfolio
- Key Developments
- Financial Performance
- Strategies
- Sumitomo Chemical Co., Ltd.
- Company Highlights
- Product Portfolio
- Key Developments
- Financial Performance
- Strategies
- Tianma Microelectronics
- Universal Display Corporation
- Visionox Technology Inc.
- Wistron NeWeb Corporation
- JOLED Inc.
9. Analyst Recommendations
- Wheel of Fortune
- Analyst View
- Coherent Opportunity Map
10. References and Research Methodology
- References
- Research Methodology
- About us