
|
시장보고서
상품코드
1699527
고객 여정 분석 시장 : 데이터 소스별, 용도별, 지역별Customer Journey Analytics Market, By Data Source, By Application, By Geography |
||||||
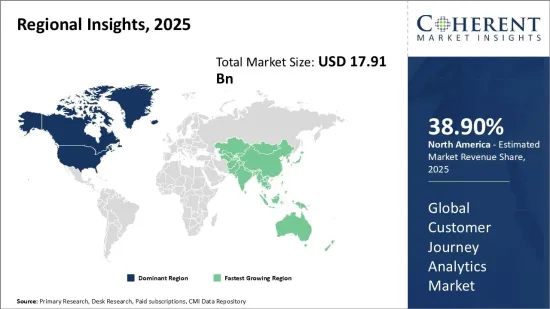
세계 고객 여정 분석 시장의 2025년 시장 규모는 179억 1,000만 달러로 추정되고, 2032년에는 470억 6,000만 달러에 달할 것으로 예상되며, 2025년부터 2032년까지 연평균 14.8%의 성장률을 보일 것으로 예측됩니다.
| 보고 범위 | 보고서 상세 내용 | ||
|---|---|---|---|
| 기준 연도 | 2024년 | 2025년 시장 규모 | 179억 1,000만 달러 |
| 실적 데이터 | 2020-2024년 | 예측 기간 | 2025-2032년 |
| 예측 기간(2025-2032년) CAGR | 14.80% | 2032년 가치 예측 | 470억 6,000만 달러 |

세계 고객 여정 분석 시장은 지난 몇 년 동안 큰 활기를 띠고 있습니다. 고객 여정 분석은 여러 채널에서 고객의 행동과 상호 작용을 매핑하여 고객이 구매 프로세스를 진행하는 방식에 대한 귀중한 통찰력을 얻는 것을 의미합니다. 디지털 기술의 도입으로 사용 가능한 고객 데이터의 양과 유형이 기하급수적으로 증가하고 있습니다. 기업들은 고객 여정 분석 솔루션을 활용하여 이 방대한 데이터를 수집하고 분석함으로써 고객을 중앙에서 파악하고 만족도를 향상시킬 수 있는 기회를 파악하고 있습니다. 고객 경험 향상에 대한 요구 증가, 옴니채널 참여 전략의 중요성, 마케팅 비용의 투자수익률(ROI)을 측정할 수 있다는 점 등이 이 시장 수요를 촉진하는 주요 요인으로 작용하고 있습니다. 그러나 데이터 프라이버시 규제는 애널리틱스 솔루션 제공업체들에게 어느 정도 과제를 던져주고 있습니다.
시장 역학:
각 산업의 급속한 디지털화로 인해 고도의 기술을 활용하여 처리 및 분석해야 하는 고객 데이터가 대량으로 생성되고 있습니다. 고객의 행동 패턴을 파악하고 개인화된 인게이지먼트를 추진하기 위한 분석 도구의 채택이 증가하고 있는 것이 큰 성장 요인으로 작용하고 있습니다. 그러나 데이터 보안에 대한 우려와 숙련된 전문가 부족이 문제점으로 지적되고 있습니다. 시장 개척 기업들은 소셜 미디어와의 상호작용과 모바일 앱 이용 패턴을 중심으로 한 새로운 기능 개발에 집중하고 있습니다. 인공지능, 머신러닝과 같은 신기술을 여행 분석 플랫폼에 통합함으로써 비즈니스 기회도 확대되고 있습니다. 북미는 현재 다양한 애널리틱스 벤더가 존재하고, 기업들의 도입이 빨라 매출 점유율에서 시장을 독식하고 있습니다. 그러나 아시아태평양의 고객 여정 분석 시장은 디지털 전환에 대한 노력이 활발해지면서 빠르게 성장하고 있습니다.
본 조사의 주요 특징
세계의 고객 여정 분석(Customer Journey Analysis) 시장에 대해 조사 분석했으며, 2024년을 기준 연도로 하여 예측 기간(2025-2032년) 시장 규모와 연평균 성장률(CAGR)에 대해 조사 분석하여 전해드립니다.
또한, 다양한 부문에 걸친 잠재적 수익 기회를 밝히고, 이 시장의 매력적인 투자 제안 매트릭스를 설명합니다.
또한 시장 성장 촉진요인, 억제요인, 기회, 신제품 출시 및 승인, 시장 동향, 지역별 전망, 주요 기업의 경쟁 전략 등에 대한 중요한 고찰을 제공합니다.
이 보고서는 기업 하이라이트, 제품 포트폴리오, 주요 하이라이트, 재무 성과, 전략 등의 매개 변수를 기반으로 세계 고객 여정 분석 시장의 주요 기업을 프로파일링합니다.
조사 대상 주요 기업으로는 Adobe Inc., Salesforce.com, Inc, IBM Corporation, SAP SE, Microsoft Corporation, Oracle Corporation, NICE Ltd. Pointillist, ClickFox, Kitewheel, Quadient, Thunderhead, Genesys, Servion Global Solutions 등이 있습니다.
이 보고서의 통찰력을 통해 마케팅 담당자와 기업 경영진은 향후 제품 출시, 유형화, 시장 확대, 마케팅 전략에 대한 정보에 입각한 의사결정을 내릴 수 있습니다.
세계 고객 여정 분석 시장 보고서는 투자자, 공급업체, 제품 제조업체, 유통업체, 신규 시장 진출기업, 재무 분석가 등 업계의 다양한 이해관계자를 대상으로 합니다.
이해관계자들은 세계 고객 여정 분석 시장 분석에 사용되는 다양한 전략 매트릭스를 통해 의사결정을 쉽게 내릴 수 있습니다.
목차
제1장 조사 목적과 전제조건
- 조사 목적
- 전제조건
- 약어
제2장 시장 전망
- 보고서 설명
- 시장 정의와 범위
- 주요 요약
제3장 시장 역학, 규제, 동향 분석
- 시장 역학
- 영향 분석
- 주요 하이라이트
- 규제 시나리오
- 제품 발매/승인
- PEST 분석
- PORTER 분석
- 시장 기회
- 규제 시나리오
- 주요 발전
- 업계 동향
제4장 세계의 고객 여정 분석 시장, 데이터 소스별, 2020년-2032년
- 웹
- 소셜미디어
- 모바일
- 메일
제5장 세계의 고객 여정 분석 시장, 용도별, 2020년-2032년
- 고객 경험 관리
- 고객 세분화 및 타겟팅
- 브랜드 관리
- 기타
제6장 세계의 고객 여정 분석 시장, 지역별, 2020년-2032년
- 북미
- 라틴아메리카
- 유럽
- 아시아태평양
- 중동
- 아프리카
제7장 경쟁 구도
- Adobe Inc.
- Salesforce.com, Inc.
- IBM Corporation
- SAP SE
- Microsoft Corporation
- Oracle Corporation
- NICE Ltd.
- Verint Systems Inc.
- Pointillist
- ClickFox
- Kitewheel
- Quadient
- Thunderhead
- Genesys
- Servion Global Solutions
제8장 애널리스트 추천 사항
- Wheel of Fortune
- 애널리스트의 견해
- COM(Coherent Opportunity Map)
제9장 참고 문헌과 조사 방법
- 참고 문헌
- 조사 방법
- 출판사에 대해
Global Customer Journey Analytics Market is estimated to be valued at US$ 17.91 Bn in 2025 and is expected to reach US$ 47.06 Bn by 2032, growing at a compound annual growth rate (CAGR) of 14.8% from 2025 to 2032.
| Report Coverage | Report Details | ||
|---|---|---|---|
| Base Year: | 2024 | Market Size in 2025: | USD 17.91 Bn |
| Historical Data for: | 2020 To 2024 | Forecast Period: | 2025 To 2032 |
| Forecast Period 2025 to 2032 CAGR: | 14.80% | 2032 Value Projection: | USD 47.06 Bn |
The global customer journey analytics market has been gaining significant traction over the past few years. Customer journey analytics refers to mapping out customer behavior and interactions across multiple channels to gain valuable insights into how customers move through the buying process. Rising adoption of digital technologies has dramatically increased the volume and variety of customer data available. Businesses are leveraging customer journey analytics solutions to collect and analyze this huge trove of data to gain a unified view of the customer and identify opportunities to improve satisfaction levels. Growing need for enhanced customer experience, focus on omni-channel engagement strategies, and ability to measure Return on Investment (ROI) of marketing spend are some of the key factors fueling demand in this market. However, data privacy regulations pose challenges for analytics solution providers to some extent.
Market Dynamics:
Rapid digitalization across industries has created an abundance of customer data that need to be processed and analyzed using advanced technologies. Rising adoption of analytics tools to tap into customer behavioral patterns and drive personalized engagements is a major growth driver. However, data security concerns and lack of skilled professionals pose challenges. Market players are focusing on developing new capabilities around social media interactions and mobile apps usage patterns. Integration of emerging technologies, such as artificial intelligence and machine learning into journey analytics platforms, is also expanding business opportunities. North America currently dominates the market in terms of revenue share owing to a wide presence of analytics vendors and early adoption by businesses. However, the Asia Pacific customer journey analytics market is gaining traction rapidly with growing digital transformation initiatives.
Key Features of the Study:
This report provides in-depth analysis of the global customer journey analytics market, and provides market size (US$ Billion) and compound annual growth rate (CAGR%) for the forecast period (2025-2032), considering 2024 as the base year
It elucidates potential revenue opportunities across different segments and explains attractive investment proposition matrices for this market
This study also provides key insights about market drivers, restraints, opportunities, new product launches or approvals, market trends, regional outlook, and competitive strategies adopted by key players
It profiles key players in the global customer journey analytics market based on the following parameters - company highlights, products portfolio, key highlights, financial performance, and strategies
Key companies covered as a part of this study include Adobe Inc., Salesforce.com, Inc., IBM Corporation, SAP SE, Microsoft Corporation, Oracle Corporation, NICE Ltd., Verint Systems Inc., Pointillist, ClickFox, Kitewheel, Quadient, Thunderhead, Genesys, and Servion Global Solutions
Insights from this report would allow marketers and the management authorities of the companies to make informed decisions regarding their future product launches, type up-gradation, market expansion, and marketing tactics
The global customer journey analytics market report caters to various stakeholders in this industry including investors, suppliers, product manufacturers, distributors, new entrants, and financial analysts
Stakeholders would have ease in decision-making through various strategy matrices used in analyzing the global customer journey analytics market
Market Segmentation
- Data Source Insights (Revenue, USD Bn, 2020 - 2032)
- Web
- Social Media
- Mobile
- Application Insights (Revenue, USD Bn, 2020 - 2032)
- Customer Experience Management
- Customer Segmentation and Targeting
- Brand Management
- Others
- Regional Insights (Revenue, USD Bn, 2020 - 2032)
- North America
- U.S.
- Canada
- Latin America
- Brazil
- Argentina
- Mexico
- Rest of Latin America
- Europe
- Germany
- U.K.
- Spain
- France
- Italy
- Russia
- Rest of Europe
- Asia Pacific
- China
- India
- Japan
- Australia
- South Korea
- ASEAN
- Rest of Asia Pacific
- Middle East
- GCC Countries
- Israel
- Rest of Middle East
- Africa
- South Africa
- North Africa
- Central Africa
- Key Players Insights
- Adobe Inc.
- Salesforce.com, Inc.
- IBM Corporation
- SAP SE
- Microsoft Corporation
- Oracle Corporation
- NICE Ltd.
- Verint Systems Inc.
- Pointillist
- ClickFox
- Kitewheel
- Quadient
- Thunderhead
- Genesys
- Servion Global Solutions
Table of Contents
1. Research Objectives and Assumptions
- Research Objectives
- Assumptions
- Abbreviations
2. Market Purview
- Report Description
- Market Definition and Scope
- Executive Summary
- Global Customer Journey Analytics Market, By Data Source
- Global Customer Journey Analytics Market, By Application
- Global Customer Journey Analytics Market, By Region
3. Market Dynamics, Regulations, and Trends Analysis
- Market Dynamics
- Impact Analysis
- Key Highlights
- Regulatory Scenario
- Product Launches/Approvals
- PEST Analysis
- PORTER's Analysis
- Market Opportunities
- Regulatory Scenario
- Key Developments
- Industry Trends
4. Global Customer Journey Analytics Market, By Data Source, 2020-2032, (USD Bn)
- Introduction
- Market Share Analysis, 2025 and 2032 (%)
- Y-o-Y Growth Analysis, 2021 - 2032
- Segment Trends
- Web
- Introduction
- Market Size and Forecast, and Y-o-Y Growth, 2020-2032, (USD Bn)
- Social Media
- Introduction
- Market Size and Forecast, and Y-o-Y Growth, 2020-2032, (USD Bn)
- Mobile
- Introduction
- Market Size and Forecast, and Y-o-Y Growth, 2020-2032, (USD Bn)
- Email
- Introduction
- Market Size and Forecast, and Y-o-Y Growth, 2020-2032, (USD Bn)
5. Global Customer Journey Analytics Market, By Application, 2020-2032, (USD Bn)
- Introduction
- Market Share Analysis, 2025 and 2032 (%)
- Y-o-Y Growth Analysis, 2021 - 2032
- Segment Trends
- Customer Experience Management
- Introduction
- Market Size and Forecast, and Y-o-Y Growth, 2020-2032, (USD Bn)
- Customer Segmentation and Targeting
- Introduction
- Market Size and Forecast, and Y-o-Y Growth, 2020-2032, (USD Bn)
- Brand Management
- Introduction
- Market Size and Forecast, and Y-o-Y Growth, 2020-2032, (USD Bn)
- Others
- Introduction
- Market Size and Forecast, and Y-o-Y Growth, 2020-2032, (USD Bn)
6. Global Customer Journey Analytics Market, By Region, 2020 - 2032, Value (USD Bn)
- Introduction
- Market Share (%) Analysis, 2025, 2028 & 2032, Value (USD Bn)
- Market Y-o-Y Growth Analysis (%), 2021 - 2032, Value (USD Bn)
- Regional Trends
- North America
- Introduction
- Market Size and Forecast, By Data Source, 2020 - 2032, Value (USD Bn)
- Market Size and Forecast, By Application, 2020 - 2032, Value (USD Bn)
- Market Size and Forecast, By Country, 2020 - 2032, Value (USD Bn)
- U.S.
- Canada
- Latin America
- Introduction
- Market Size and Forecast, By Data Source, 2020 - 2032, Value (USD Bn)
- Market Size and Forecast, By Application, 2020 - 2032, Value (USD Bn)
- Market Size and Forecast, By Country, 2020 - 2032, Value (USD Bn)
- Brazil
- Argentina
- Mexico
- Rest of Latin America
- Europe
- Introduction
- Market Size and Forecast, By Data Source, 2020 - 2032, Value (USD Bn)
- Market Size and Forecast, By Application, 2020 - 2032, Value (USD Bn)
- Market Size and Forecast, By Country, 2020 - 2032, Value (USD Bn)
- Germany
- U.K.
- Spain
- France
- Italy
- Russia
- Rest of Europe
- Asia Pacific
- Introduction
- Market Size and Forecast, By Data Source, 2020 - 2032, Value (USD Bn)
- Market Size and Forecast, By Application, 2020 - 2032, Value (USD Bn)
- Market Size and Forecast, By Country, 2020 - 2032, Value (USD Bn)
- China
- India
- Japan
- Australia
- South Korea
- ASEAN
- Rest of Asia Pacific
- Middle East
- Introduction
- Market Size and Forecast, By Data Source, 2020 - 2032, Value (USD Bn)
- Market Size and Forecast, By Application, 2020 - 2032, Value (USD Bn)
- Market Size and Forecast, By Country, 2020 - 2032, Value (USD Bn)
- GCC Countries
- Israel
- Rest of Middle East
- Africa
- Introduction
- Market Size and Forecast, By Data Source, 2020 - 2032, Value (USD Bn)
- Market Size and Forecast, By Application, 2020 - 2032, Value (USD Bn)
- Market Size and Forecast, By Country/Region, 2020 - 2032, Value (USD Bn)
- South Africa
- North Africa
- Central Africa
7. Competitive Landscape
- Adobe Inc.
- Company Highlights
- Product Portfolio
- Key Developments
- Financial Performance
- Strategies
- Salesforce.com, Inc.
- Company Highlights
- Product Portfolio
- Key Developments
- Financial Performance
- Strategies
- IBM Corporation
- Company Highlights
- Product Portfolio
- Key Developments
- Financial Performance
- Strategies
- SAP SE
- Company Highlights
- Product Portfolio
- Key Developments
- Financial Performance
- Strategies
- Microsoft Corporation
- Company Highlights
- Product Portfolio
- Key Developments
- Financial Performance
- Strategies
- Oracle Corporation
- Company Highlights
- Product Portfolio
- Key Developments
- Financial Performance
- Strategies
- NICE Ltd.
- Company Highlights
- Product Portfolio
- Key Developments
- Financial Performance
- Strategies
- Verint Systems Inc.
- Company Highlights
- Product Portfolio
- Key Developments
- Financial Performance
- Strategies
- Pointillist
- ClickFox
- Kitewheel
- Quadient
- Thunderhead
- Genesys
- Servion Global Solutions
8. Analyst Recommendations
- Wheel of Fortune
- Analyst View
- Coherent Opportunity Map
9. References and Research Methodology
- References
- Research Methodology
- About us
