


|
시장보고서
상품코드
1729690
유틸리티 차량 시장 : 엔진 용량별, 차종별, 지역별Utility Vehicles Market, By Engine Capacity, By Vehicle Type, By Geography |
||||||
유틸리티 차량 세계 시장은 2025년에 349억 1,000만 달러로 추정되며, 2032년에는 675억 9,000만 달러에 달할 것으로 예상되며, 2025년부터 2032년까지 9.9%의 CAGR을 보일 것으로 예상됩니다.
| 보고서 범위 | 보고서 상세 | ||
|---|---|---|---|
| 기준 연도 | 2024년 | 2025년 시장 규모 | 349억 1,000만 달러 |
| 실적 데이터 | 2020-2024년 | 예측 기간 | 2025-2032년 |
| 예측 기간 : 2025-2032년 CAGR | 9.90% | 2032년 가치 예측 | 675억 9,000만 달러 |
세계 유틸리티 차량 시장은 최근 몇 년 동안 꾸준히 성장하고 있습니다. 유틸리티 차량은 개인용과 상업용 모두에서 다목적 운송 수단을 제공합니다. 무거운 짐을 운반하거나 기존 승용차의 용량을 초과하는 작업을 수행하도록 설계되었습니다. 신흥 경제국의 급속한 산업화와 인프라 개발 등의 요인으로 인해 건설 및 운송 산업에서 유틸리티 차량에 대한 수요가 증가하고 있습니다. 또한, 소비자들 사이에서 레저 활동에 대한 선호도가 높아짐에 따라 레저용 유틸리티 차량의 판매도 증가하고 있습니다. 그러나 규제 당국의 엄격한 배기가스 규제는 전기 모빌리티의 증가 추세와 함께 전통적인 가솔린/디젤 엔진 유틸리티 차량의 성장에 영향을 미칠 수 있습니다.
시장 역학:
세계 유틸리티 차량 시장은 건설, 광업, 농업, 운송과 같은 최종 이용 산업의 견고한 성장에 의해 주도되고 있습니다. 도로, 교량, 건물 개발을 위한 인프라 투자가 증가하면서 유틸리티 차량을 포함한 건설기계에 대한 수요가 증가하고 있습니다. 또한, 신흥국의 급속한 도시화와 농업 및 광업 생산량 증가도 유틸리티 차량 판매를 촉진하고 있습니다. 기존 교통 인프라의 지속적인 업그레이드도 시장 확대의 중요한 요인입니다. 그러나 당국이 기존 차량에 부과하는 엄격한 배기가스 규제가 문제가 되고 있습니다. 한편, 레크리에이션 활동에 대한 선호도 증가는 새로운 기회를 제공하고 있습니다. 제조사들은 변화하는 규제를 준수하고 그린 모빌리티 트렌드를 수용하기 위해 하이브리드 및 전기자동차를 출시하고 있습니다.
본 조사의 주요 특징
세계의 유틸리티 차량 시장을 상세히 분석했으며, 2024년을 기준 연도로 하여 예측 기간(2025-2032년)의 시장 규모(10억 달러)와 연평균 성장률(CAGR)을 조사하여 전해드립니다.
또한, 다양한 부문에 걸친 잠재적 수익 기회를 밝히고, 이 시장의 매력적인 투자 제안 매트릭스를 설명합니다.
또한 시장 촉진요인, 억제요인, 기회, 신제품 출시 및 승인, 시장 동향, 지역별 전망, 주요 기업의 경쟁 전략 등에 대한 중요한 인사이트를 제공합니다.
이 보고서는 기업 하이라이트, 제품 포트폴리오, 주요 하이라이트, 재무 성과, 전략 등의 매개 변수를 기반으로 세계 유틸리티 차량 시장의 주요 기업을 프로파일링합니다.
이 보고서의 인사이트를 통해 마케팅 담당자와 기업 경영진은 향후 제품 출시, 유형화, 시장 확대, 마케팅 전략에 대한 정보에 입각한 의사결정을 내릴 수 있습니다.
이 보고서는 투자자, 공급업체, 제품 제조업체, 유통업체, 신규 진입자, 재무 분석가 등 업계의 다양한 이해관계자를 대상으로 합니다.
이해관계자들은 세계 유틸리티 차량 시장 분석에 사용되는 다양한 전략 매트릭스를 통해 의사결정을 쉽게 내릴 수 있습니다.
목차
제1장 조사 목적과 가정
- 조사 목적
- 가정
- 약어
제2장 시장 전망
- 보고서 설명
- 시장 정의와 범위
- 주요 요약
제3장 시장 역학, 규제, 동향 분석
- 시장 역학
- 영향 분석
- 주요 하이라이트
- 규제 시나리오
- 제품 발매/승인
- PEST 분석
- PORTER의 분석
- 시장 기회
- 규제 시나리오
- 주요 발전
- 업계 동향
제4장 세계의 유틸리티 차량 시장, 엔진 용량별, 2020-2032년
- 800cc 이상
- 400 cc-800cc
- 400cc 이하
제5장 세계의 유틸리티 차량 시장, 차종별, 2020-2032년
- 스포츠 유틸리티 차량(SUV)
- 다목적 지형 차량(UTV)
- 전지형차(ATV)
제6장 세계의 유틸리티 차량 시장, 지역별, 2020-2032년
- 북미
- 미국
- 캐나다
- 라틴아메리카
- 브라질
- 아르헨티나
- 멕시코
- 기타 라틴아메리카
- 유럽
- 독일
- 영국
- 스페인
- 프랑스
- 이탈리아
- 러시아
- 기타 유럽
- 아시아태평양
- 중국
- 인도
- 일본
- 호주
- 한국
- ASEAN
- 기타 아시아태평양
- 중동
- GCC 국가
- 이스라엘
- 기타 중동
- 아프리카
- 남아프리카공화국
- 북아프리카
- 중앙아프리카
제7장 경쟁 구도
- Polaris Inc.
- BRP Inc.(Can-Am)
- John Deere
- Mahindra & Mahindra
- Kubota Corporation
- Honda Motor Co., Ltd.
- Yamaha Motor Co., Ltd.
- Kawasaki Heavy Industries, Ltd.
- Textron Inc.
- Suzuki Motor Corporation
- Great Wall Motor Company Limited
- CFMOTO
- Arctic Cat Inc.
- Kymco
- Linhai Group
제8장 애널리스트의 추천사항
- Wheel of Fortune
- 애널리스트의 견해
- Coherent Opportunity Map
제9장 참고문헌과 조사 방법
- 참고문헌
- 조사 방법
- 출판사 소개
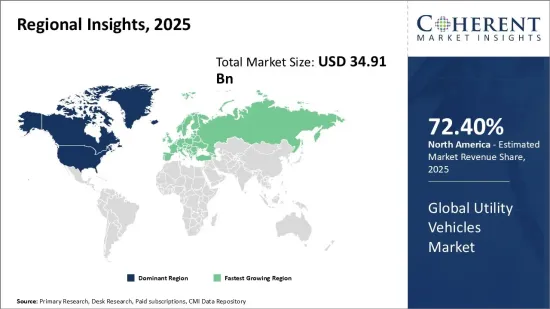
The Global Utility Vehicles Market is estimated to be valued at USD 34.91 Bn in 2025 and is expected to reach USD 67.59 Bn by 2032, exhibiting a compound annual growth rate (CAGR) of 9.9% from 2025 to 2032.
| Report Coverage | Report Details | ||
|---|---|---|---|
| Base Year: | 2024 | Market Size in 2025: | USD 34.91 Bn |
| Historical Data for: | 2020 To 2024 | Forecast Period: | 2025 To 2032 |
| Forecast Period 2025 to 2032 CAGR: | 9.90% | 2032 Value Projection: | USD 67.59 Bn |

The global utility vehicles market has been witnessing steady growth in the recent years. Utility vehicles provide multi-purpose transportation for both personal and commercial applications. They are designed to carry a heavy load and perform tasks beyond the capability of conventional passenger vehicles. Factors, such as rapid industrialization and infrastructure development across developing economies, have augmented the demand for utility vehicles from the construction and transport industries. Additionally, increasing preference for recreational activities among consumers is boosting the sales of utility vehicles for leisure applications. However, stringent emission norms imposed by regulatory authorities coupled with rising electric mobility trend may challenge the growth of conventional gasoline/diesel-powered utility vehicles.
Market Dynamics:
The global utility vehicles market is driven by robust growth in end-use industries such as construction, mining, agriculture, and transportation. Rising infrastructure investments for developing roads, bridges, and buildings is bolstering the demand for construction equipment including utility vehicles. Rapid urbanization and growing agriculture & mining output in emerging nations are also propelling utility vehicle sales. Ongoing upgrade of existing transport infrastructure is another key factor augmenting the market. However, stringent emission regulations imposed by authorities on conventional vehicles pose a challenge. On the other hand, growing preference for recreational activities is providing new opportunities. Manufacturers are introducing hybrid and electric variants to comply with changing norms and tap the green mobility trend.
Key Features of the Study:
This report provides in-depth analysis of the global utility vehicles market, and provides market size (USD Billion) and compound annual growth rate (CAGR%) for the forecast period (2025-2032), considering 2024 as the base year
It elucidates potential revenue opportunities across different segments and explains attractive investment proposition matrices for this market
This study also provides key insights about market drivers, restraints, opportunities, new product launches or approvals, market trends, regional outlook, and competitive strategies adopted by key players
It profiles key players in the global utility vehicles market based on the following parameters - company highlights, products portfolio, key highlights, financial performance, and strategies
Key companies covered as a part of this study include Polaris Inc., BRP Inc. (Can-Am), John Deere, Mahindra & Mahindra, Kubota Corporation, Honda Motor Co., Ltd., Yamaha Motor Co., Ltd., Kawasaki Heavy Industries, Ltd., Textron Inc., Suzuki Motor Corporation, Great Wall Motor Company Limited, CFMOTO, Arctic Cat Inc., Kymco, and Linhai Group
Insights from this report would allow marketers and the management authorities of the companies to make informed decisions regarding their future product launches, type up-gradation, market expansion, and marketing tactics
The global utility vehicles market report caters to various stakeholders in this industry including investors, suppliers, product manufacturers, distributors, new entrants, and financial analysts
Stakeholders would have ease in decision-making through various strategy matrices used in analyzing the global utility vehicles market
Market Segmentation
- Engine Capacity Insights (Revenue, USD Bn, 2020 - 2032)
- Above 800cc
- 400cc to 800cc
- Below 400cc
- Vehicle Type Insights (Revenue, USD Bn, 2020 - 2032)
- Sport Utility Vehicles (SUVs)
- Utility Terrain Vehicles (UTVs)
- All-Terrain Vehicles (ATVs)
- Regional Insights (Revenue, USD Bn, 2020 - 2032)
- North America
- U.S.
- Canada
- Latin America
- Brazil
- Argentina
- Mexico
- Rest of Latin America
- Europe
- Germany
- U.K.
- Spain
- France
- Italy
- Russia
- Rest of Europe
- Asia Pacific
- China
- India
- Japan
- Australia
- South Korea
- ASEAN
- Rest of Asia Pacific
- Middle East
- GCC Countries
- Israel
- Rest of Middle East
- Africa
- South Africa
- North Africa
- Central Africa
- Company Profiles:
- Polaris Inc.
- BRP Inc. (Can-Am)
- John Deere
- Mahindra & Mahindra
- Kubota Corporation
- Honda Motor Co., Ltd.
- Yamaha Motor Co., Ltd.
- Kawasaki Heavy Industries, Ltd.
- Textron Inc.
- Suzuki Motor Corporation
- Great Wall Motor Company Limited
- CFMOTO
- Arctic Cat Inc.
- Kymco
- Linhai Group
Table of Contents
1. Research Objectives and Assumptions
- Research Objectives
- Assumptions
- Abbreviations
2. Market Purview
- Report Description
- Market Definition and Scope
- Executive Summary
- Global Utility Vehicles Market, By Engine Capacity
- Global Utility Vehicles Market, By Vehicle Type
- Global Utility Vehicles Market, By Region
3. Market Dynamics, Regulations, and Trends Analysis
- Market Dynamics
- Impact Analysis
- Key Highlights
- Regulatory Scenario
- Product Launches/Approvals
- PEST Analysis
- PORTER's Analysis
- Market Opportunities
- Regulatory Scenario
- Key Developments
- Industry Trends
4. Global Utility Vehicles Market, By Engine Capacity, 2020-2032, (USD Bn)
- Introduction
- Market Share Analysis, 2025 and 2032 (%)
- Y-o-Y Growth Analysis, 2021- 2032
- Segment Trends
- Above 800cc
- Introduction
- Market Size and Forecast, and Y-o-Y Growth, 2020-2032, (USD Bn)
- 400cc to 800cc
- Introduction
- Market Size and Forecast, and Y-o-Y Growth, 2020-2032, (USD Bn)
- Below 400cc
- Introduction
- Market Size and Forecast, and Y-o-Y Growth, 2020-2032, (USD Bn)
5. Global Utility Vehicles Market, By Vehicle Type, 2020-2032, (USD Bn)
- Introduction
- Market Share Analysis, 2025 and 2032 (%)
- Y-o-Y Growth Analysis, 2021 - 2032
- Segment Trends
- Sport Utility Vehicles (SUVs)
- Introduction
- Market Size and Forecast, and Y-o-Y Growth, 2020-2032, (USD Bn)
- Utility Terrain Vehicles (UTVs)
- Introduction
- Market Size and Forecast, and Y-o-Y Growth, 2020-2032, (USD Bn)
- All-Terrain Vehicles (ATVs)
- Introduction
- Market Size and Forecast, and Y-o-Y Growth, 2020-2032, (USD Bn)
6. Global Utility Vehicles Market, By Region, 2020 - 2032, Value (USD Bn)
- Introduction
- Market Share (%) Analysis, 2025, 2028 & 2032, Value (USD Bn)
- Market Y-o-Y Growth Analysis (%), 2021 - 2032, Value (USD Bn)
- Regional Trends
- North America
- Introduction
- Market Size and Forecast, By Engine Capacity, 2020 - 2032, Value (USD Bn)
- Market Size and Forecast, By Vehicle Type, 2020 - 2032, Value (USD Bn)
- Market Size and Forecast, By Country, 2020 - 2032, Value (USD Bn)
- U.S.
- Canada
- Latin America
- Introduction
- Market Size and Forecast, By Engine Capacity, 2020 - 2032, Value (USD Bn)
- Market Size and Forecast, By Vehicle Type, 2020 - 2032, Value (USD Bn)
- Market Size and Forecast, By Country, 2020 - 2032, Value (USD Bn)
- Brazil
- Argentina
- Mexico
- Rest of Latin America
- Europe
- Introduction
- Market Size and Forecast, By Engine Capacity, 2020 - 2032, Value (USD Bn)
- Market Size and Forecast, By Vehicle Type, 2020 - 2032, Value (USD Bn)
- Market Size and Forecast, By Country, 2020 - 2032, Value (USD Bn)
- Germany
- U.K.
- Spain
- France
- Italy
- Russia
- Rest of Europe
- Asia Pacific
- Introduction
- Market Size and Forecast, By Engine Capacity, 2020 - 2032, Value (USD Bn)
- Market Size and Forecast, By Vehicle Type, 2020 - 2032, Value (USD Bn)
- Market Size and Forecast, By Country, 2020 - 2032, Value (USD Bn)
- China
- India
- Japan
- Australia
- South Korea
- ASEAN
- Rest of Asia Pacific
- Middle East
- Introduction
- Market Size and Forecast, By Engine Capacity, 2020 - 2032, Value (USD Bn)
- Market Size and Forecast, By Vehicle Type, 2020 - 2032, Value (USD Bn)
- Market Size and Forecast, By Country, 2020 - 2032, Value (USD Bn)
- GCC Countries
- Israel
- Rest of Middle East
- Africa
- Introduction
- Market Size and Forecast, By Engine Capacity, 2020 - 2032, Value (USD Bn)
- Market Size and Forecast, By Vehicle Type, 2020 - 2032, Value (USD Bn)
- Market Size and Forecast, By Country/Region, 2020 - 2032, Value (USD Bn)
- South Africa
- North Africa
- Central Africa
7. Competitive Landscape
- Polaris Inc.
- Company Highlights
- Product Portfolio
- Key Developments
- Financial Performance
- Strategies
- BRP Inc. (Can-Am)
- Company Highlights
- Product Portfolio
- Key Developments
- Financial Performance
- Strategies
- John Deere
- Company Highlights
- Product Portfolio
- Key Developments
- Financial Performance
- Strategies
- Mahindra & Mahindra
- Company Highlights
- Product Portfolio
- Key Developments
- Financial Performance
- Strategies
- Kubota Corporation
- Company Highlights
- Product Portfolio
- Key Developments
- Financial Performance
- Strategies
- Honda Motor Co., Ltd.
- Company Highlights
- Product Portfolio
- Key Developments
- Financial Performance
- Strategies
- Yamaha Motor Co., Ltd.
- Company Highlights
- Product Portfolio
- Key Developments
- Financial Performance
- Strategies
- Kawasaki Heavy Industries, Ltd.
- Company Highlights
- Product Portfolio
- Key Developments
- Financial Performance
- Strategies
- Textron Inc.
- Company Highlights
- Product Portfolio
- Key Developments
- Financial Performance
- Strategies
- Suzuki Motor Corporation
- Company Highlights
- Product Portfolio
- Key Developments
- Financial Performance
- Strategies
- Great Wall Motor Company Limited
- Company Highlights
- Product Portfolio
- Key Developments
- Financial Performance
- Strategies
- CFMOTO
- Company Highlights
- Product Portfolio
- Key Developments
- Financial Performance
- Strategies
- Arctic Cat Inc.
- Company Highlights
- Product Portfolio
- Key Developments
- Financial Performance
- Strategies
- Kymco
- Company Highlights
- Product Portfolio
- Key Developments
- Financial Performance
- Strategies
- Linhai Group
- Company Highlights
- Product Portfolio
- Key Developments
- Financial Performance
- Strategies
8. Analyst Recommendations
- Wheel of Fortune
- Analyst View
- Coherent Opportunity Map
9. References and Research Methodology
- References
- Research Methodology
- About us
