


|
시장보고서
상품코드
1858964
엘리베이터 시장 : 시장 기회 및 촉진요인, 업계 동향 분석, 예측(2025-2034년)Elevators Market Opportunity, Growth Drivers, Industry Trend Analysis, and Forecast 2025 - 2034 |
||||||
세계의 엘리베이터 시장 규모는 2024년에는 848억 달러로 평가되었고, CAGR 4.2%로 성장할 전망이며, 2034년에는 1,267억 달러에 이를 것으로 예측됩니다.
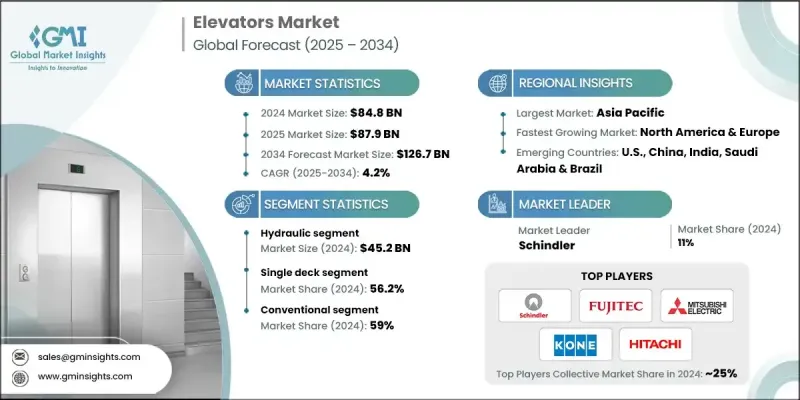
이 성장의 원동력이 되고 있는 것은 세계적인 인프라 정비의 확대 및 도시의 현대화입니다. 상업용 건물 및 주거용 고층 건물 모두에서 효율적인 수직 이동 솔루션에 대한 수요가 높아짐에 따라 시장 성장이 가속화되고 있습니다. 도시 개발 당국은 스마트 시티 개념 및 대규모 인프라 프로젝트에 투자하고 있으며, 이러한 프로젝트에는 첨단 엘리베이터 시스템이 필요합니다. 빌딩의 개수도 크게 공헌하고 있으며, 부동산 소유자는 노후화한 시스템을 보다 새롭고 스마트한 기술로 업그레이드해, 최신의 건축 기준법에 적합시켜, 운용 성능을 향상시키고 있습니다. IoT, AI를 활용한 예지 보전, 목적지 배차 시스템과 통합된 스마트 엘리베이터의 출현은 수직 수송의 미래를 형성하고 있습니다. 이러한 시스템은 적응 알고리즘, 실시간 모니터링, 현대화된 인터페이스를 통해 안전, 에너지 효율 및 사용자의 편안함을 향상시킵니다. 이 시장은 또한 기존 건물에 고급 엘리베이터 기술을 도입하여 기능성을 높이고 서비스 수명을 연장하는 개수 프로젝트 수요를 지속하고 있습니다.
| 시장 범위 | |
|---|---|
| 시작 연도 | 2024년 |
| 예측 연도 | 2025-2034년 |
| 시장 규모 | 848억 달러 |
| 예측 금액 | 1,267억 달러 |
| CAGR | 4.2% |
유압 엘리베이터 분야는 2024년에 452억 달러를 창출하였고, 2025-2034년 연평균 복합 성장률(CAGR) 3.4%로 성장할 것으로 예측됩니다. 유압 시스템은 저층에서 중층까지의 건물에서 실용적이기 때문에 인기가 계속되고 있습니다. 이러한 시스템은 견인 엘리베이터에 비해 초기 비용이 낮고 컴팩트한 공간으로의 통합이 용이하며 유지보수가 거의 필요하지 않은 것으로 평가되었습니다. 친환경 유체 및 보다 효율적인 메커니즘 등 지속가능한 유압 기술의 최근 기술 혁신은 환경 컴플라이언스와 운전 성능을 향상시키고 있으며, 공간이 중요하고 예산이 제한된 프로젝트에서 선호되는 옵션이 되었습니다.
싱글 데크 부문은 2024년에 56.2%의 점유율을 차지했으며, 2034년까지 CAGR 3.9%로 성장이 예상됩니다. 이 이점은 주택, 중층 상업용 건물, 현대화 프로젝트에서 널리 사용되고 있기 때문입니다. 싱글 데크 엘리베이터는 디자인이 간단하고, 가격도 저렴하며, 유지 보수가 쉽기 때문에 다양한 건축 레이아웃에 적합합니다. 간단한 설치 공정과 낮은 구조 요건으로 신규 개발 및 리노베이션 모두에 적합한 솔루션이 되었습니다.
미국의 엘리베이터 시장은 2024년에 130억 달러를 창출했으며, 2025-2034년 연평균 복합 성장률(CAGR) 2.9%로 성장할 것으로 예측됩니다. 이 나라의 이점은 노후화된 인프라의 현대화를 목적으로 한 리노베이션 프로젝트와 함께 상업 및 주택 건설의 강력한 파이프라인에 의해 강화되고 있습니다. 그린 빌딩, 스마트 도시 계획, 고층 빌딩 확장에 대한 지속적인 노력은 차세대 엘리베이터 시스템에 대한 수요를 높이고 있습니다. Mitsubishi Electric, Hitachi, TK Elevator, KONE 및 Schindler 등 업계 리더의 존재와 안전성 및 에너지 효율에 초점을 맞춘 유리한 규제가 미국 시장의 주도적 지위를 강화하고 있습니다.
세계 엘리베이터 시장의 주요 기업은 Toshiba, Hyundai Elevator, TK Elevator, Mitsubishi Electric, Fujitec, Hitachi, Electra Elevators, Schindler, Canny Elevator, Sigma Elevator, Aritco, ESCON Elevators, Schumacher Elevator, KONE 및 EMAK 등이 있습니다. 세계 엘리베이터 시장에서 사업을 전개하는 기업은 연구개발에 대한 지속적인 투자와 AI, IoT, 에너지 효율적인 컴포넌트 등 첨단 기술의 통합을 통해 그 지위를 강화하고 있습니다. 많은 제조업체들은 성능 향상 및 가동 중지 시간을 줄이기 위해 예지 보전 시스템과 디지털 제어 인터페이스를 갖춘 스마트 엘리베이터 개발에 중점을 둡니다. 건설회사, 부동산개발업체, 인프라 프로젝트에 종사하는 정부기관과의 전략적 파트너십도 시장 점유율 확대의 열쇠가 됩니다. 주요 브랜드는 기존 건물에 맞는 업그레이드 솔루션을 제공하는 복고풍의 기회에 점점 더 주목을 받고 있습니다.
자주 묻는 질문
목차
제1장 조사 방법 및 범위
제2장 주요 요약
제3장 업계 인사이트
- 생태계 분석
- 공급자의 상황
- 이익률
- 각 단계에서의 부가가치
- 밸류체인에 영향을 주는 요인
- 업계에 미치는 영향요인
- 성장 촉진요인
- 스마트시티 및 인프라 개발
- 노후 인프라의 현대화
- 혁신적 기술의 개발 및 스마트화 수요의 고조 엘리베이터
- 업계의 잠재적 위험 및 과제
- 높은 초기 투자 비용
- 엄격한 안전 규제
- 성장 촉진요인
- 성장 가능성 분석
- 향후 시장 동향
- 기술 혁신의 상황
- 현재의 기술 동향
- 신흥 기술
- 가격 동향
- 지역별
- 제품별
- 규제 상황
- 규격 및 컴플라이언스 요건
- 지역 규제 프레임워크
- 인증기준
- 무역 통계
- 주요 수입국
- 주요 수출국
- Porter's Five Forces 분석
- PESTEL 분석
제4장 경쟁 구도
- 서문
- 기업의 시장 점유율 분석
- 지역별
- 북미
- 유럽
- 아시아태평양
- 라틴아메리카
- 중동 및 아프리카
- 지역별
- 기업 매트릭스 분석
- 주요 시장 기업의 경쟁 분석
- 경쟁 포지셔닝 매트릭스
- 주요 발전
- 합병 및 인수
- 파트너십
- 신제품 발표
- 확장 계획
제5장 시장 추계 및 예측 : 제품별(2021-2034년)
- 주요 동향
- 유압
- 트랙션
- 머신 룸리스 견인
제6장 시장 추계 및 예측 : 데크 유형별(2021-2034년)
- 주요 동향
- 싱글 데크
- 더블 데크
제7장 시장 추계 및 예측 : 건물 높이별(2021-2034년)
- 주요 동향
- 저층
- 중층
- 고층
제8장 시장 추계 및 예측 : 속도별(2021-2034년)
- 주요 동향
- 1m/s 미만
- 1m/s 이상 3m/s 미만
- 4m/s 이상 6m/s 미만
- 7m/s 이상 10m/s 미만
- 10m/s 이상
제9장 시장 추계 및 예측 : 목적지 컨트롤별(2021-2034년)
- 주요 동향
- 스마트
- 기존
제10장 시장 추계 및 예측 : 사업별(2021-2034년)
- 주요 동향
- 신규 설비
- 유지보수
- 근대화
제11장 시장 추계 및 예측 : 용도별(2021-2034년)
- 주요 동향
- 여객
- 화물
제12장 시장 추계 및 예측 : 최종 용도별(2021-2034년)
- 주요 동향
- 주택용
- 홈 리프트
- 기타
- 산업용
- 상업용
- 사무실
- 호텔
- 헬스케어
- 기타(쇼핑몰)
제13장 시장 추계 및 예측 : 지역별(2021-2034년)
- 주요 동향
- 북미
- 미국
- 캐나다
- 유럽
- 독일
- 영국
- 프랑스
- 이탈리아
- 스페인
- 아시아태평양
- 중국
- 인도
- 일본
- 한국
- 호주
- 인도네시아
- 말레이시아
- 라틴아메리카
- 브라질
- 멕시코
- 아르헨티나
- 중동 및 아프리카
- 사우디아라비아
- 아랍에미리트(UAE)
- 남아프리카
제14장 기업 프로파일
- Aritco
- Canny Elevator
- Electra Elevators
- EMAK
- ESCON Elevators
- Fujitec
- Hitachi
- Hyundai Elevator
- KONE
- Mitsubishi Electric
- Schindler
- Schumacher Elevator
- Sigma Elevator
- TK Elevator
- Toshiba
The Global Elevators Market was valued at USD 84.8 billion in 2024 and is estimated to grow at a CAGR of 4.2% to reach USD 126.7 billion by 2034.

This growth is driven by the expanding development of infrastructure and urban modernization worldwide. The rising demand for efficient vertical mobility solutions in both commercial and residential high-rise buildings is accelerating market growth. Urban development authorities are investing in smart city initiatives and large-scale infrastructure projects, which often require sophisticated elevator systems. Building refurbishments are also contributing significantly, as property owners are upgrading aging systems with newer, smarter technologies to align with updated building codes and improve operational performance. The emergence of smart elevators integrated with IoT, AI-enabled predictive maintenance, and destination dispatch systems is shaping the future of vertical transportation. These systems offer improved safety, energy efficiency, and user comfort through adaptive algorithms, real-time monitoring, and modernized interfaces. The market is also seeing sustained demand from retrofit projects, where existing buildings are being equipped with advanced elevator technologies to boost functionality and extend service life.
| Market Scope | |
|---|---|
| Start Year | 2024 |
| Forecast Year | 2025-2034 |
| Start Value | $84.8 Billion |
| Forecast Value | $126.7 Billion |
| CAGR | 4.2% |
The hydraulic elevators segment generated USD 45.2 billion in 2024 and is projected to grow at a CAGR of 3.4% from 2025 to 2034. Their continued popularity stems from their practicality in low- to mid-rise buildings. These systems are recognized for their lower upfront costs, ease of integration into compact spaces, and reduced maintenance needs compared to traction elevators. Recent innovations in sustainable hydraulic technology, including eco-friendly fluids and more efficient mechanisms, are improving environmental compliance and operational performance, making them a preferred choice in space-conscious and budget-sensitive projects.
The single-deck segment held a 56.2% share in 2024 and is anticipated to grow at a CAGR of 3.9% through 2034. This dominance is attributed to its widespread use in residential, mid-rise commercial buildings, and modernization projects. Single-deck elevators are simpler in design, more affordable, and easier to maintain, making them highly compatible with a broad range of architectural layouts. Their uncomplicated installation process and lower structural requirements have made them a preferred solution for both new developments and building retrofits.
United States Elevators Market generated USD 13 billion in 2024 and is forecasted to grow at a CAGR of 2.9% from 2025 to 2034. The country's dominance is fueled by a strong pipeline of commercial and residential construction, along with renovation projects aimed at modernizing outdated infrastructure. Ongoing efforts in green building, smart urban planning, and high-rise expansion are increasing the demand for next-generation elevator systems. The presence of industry leaders such as Mitsubishi Electric, Hitachi, TK Elevator, KONE, and Schindler, coupled with favorable regulations focused on safety and energy efficiency, reinforces the U.S. market's leadership position.
Key players in the Global Elevators Market include Toshiba, Hyundai Elevator, TK Elevator, Mitsubishi Electric, Fujitec, Hitachi, Electra Elevators, Schindler, Canny Elevator, Sigma Elevator, Aritco, ESCON Elevators, Schumacher Elevator, KONE, and EMAK. Companies operating in the global elevators market are strengthening their position through continuous investment in R&D and integration of advanced technologies like AI, IoT, and energy-efficient components. Many manufacturers are shifting focus toward developing smart elevators equipped with predictive maintenance systems and digital control interfaces to enhance performance and reduce downtime. Strategic partnerships with construction firms, real estate developers, and government agencies involved in infrastructure projects are also key to expanding market share. Leading brands are increasingly focusing on retrofit opportunities, offering upgrade solutions tailored to existing buildings.
Table of Contents
Chapter 1 Methodology & Scope
- 1.1 Market scope and definition
- 1.2 Research design
- 1.2.1 Research approach
- 1.2.2 Data collection methods
- 1.3 Data mining sources
- 1.3.1 Global
- 1.3.2 Regional/Country
- 1.4 Base estimates and calculations
- 1.4.1 Base year calculation
- 1.4.2 Key trends for market estimation
- 1.5 Primary research and validation
- 1.5.1 Primary sources
- 1.6 Forecast model
- 1.7 Research assumptions and limitations
Chapter 2 Executive Summary
- 2.1 Industry 360° synopsis
- 2.2 Key market trends
- 2.2.1 Regional
- 2.2.2 Product
- 2.2.3 Deck type
- 2.2.4 Building height
- 2.2.5 Speed
- 2.2.6 Destination control
- 2.2.7 Business
- 2.2.8 Application
- 2.2.9 End use
- 2.3 CXO perspectives: Strategic imperatives
- 2.3.1 Key decision points for industry executives
- 2.3.2 Critical success factors for market players
- 2.4 Future outlook and strategic recommendations
Chapter 3 Industry Insights
- 3.1 Industry ecosystem analysis
- 3.1.1 Supplier landscape
- 3.1.2 Profit margin
- 3.1.3 Value addition at each stage
- 3.1.4 Factor affecting the value chain
- 3.2 Industry impact forces
- 3.2.1 Growth drivers
- 3.2.1.1 Smart cities & infrastructure development
- 3.2.1.2 Modernization of aging infrastructure
- 3.2.1.3 Development of innovative technologies and rising demand for smart elevators
- 3.2.2 Industry pitfalls & challenges
- 3.2.2.1 High initial investment costs
- 3.2.2.2 Stringent safety regulations
- 3.2.1 Growth drivers
- 3.3 Growth potential analysis
- 3.4 Future market trends
- 3.5 Technology and innovation landscape
- 3.5.1 Current technological trends
- 3.5.2 Emerging technologies
- 3.6 Price trends
- 3.6.1 By region
- 3.6.2 By product
- 3.7 Regulatory landscape
- 3.7.1 Standards and compliance requirements
- 3.7.2 Regional regulatory frameworks
- 3.7.3 Certification standards
- 3.8 Trade statistics
- 3.8.1 Major importing countries
- 3.8.2 Major exporting countries
- 3.9 Porter's analysis
- 3.10 PESTEL analysis
Chapter 4 Competitive Landscape, 2024
- 4.1 Introduction
- 4.2 Company market share analysis
- 4.2.1 By Region
- 4.2.1.1 North America
- 4.2.1.2 Europe
- 4.2.1.3 Asia Pacific
- 4.2.1.4 Latin America
- 4.2.1.5 Middle East & Africa
- 4.2.1 By Region
- 4.3 Company matrix analysis
- 4.4 Competitive analysis of major market players
- 4.5 Competitive positioning matrix
- 4.6 Key developments
- 4.6.1 Mergers & acquisitions
- 4.6.2 Partnerships & collaborations
- 4.6.3 New product launches
- 4.6.4 Expansion plans
Chapter 5 Market Estimates & Forecast, By Product, 2021 - 2034, (USD Billion) (Thousand Units)
- 5.1 Key trends
- 5.2 Hydraulic
- 5.3 Traction
- 5.4 Machine room-less traction
Chapter 6 Market Estimates & Forecast, By Deck Type, 2021 - 2034, (USD Billion) (Thousand Units)
- 6.1 Key trends
- 6.2 Single deck
- 6.3 Double deck
Chapter 7 Market Estimates & Forecast, By Building Height, 2021 - 2034, (USD Billion) (Thousand Units)
- 7.1 Key trends
- 7.2 Low-rise
- 7.3 Mid-rise
- 7.4 High-rise
Chapter 8 Market Estimates & Forecast, By Speed, 2021 - 2034, (USD Billion) (Thousand Units)
- 8.1 Key trends
- 8.2 Less than 1m/s
- 8.3 Between 1 m/s to 3 m/s
- 8.4 Between 4 m/s to 6 m/s
- 8.5 Between 7 m/s to 10 m/s
- 8.6 Above 10 m/s
Chapter 9 Market Estimates & Forecast, By Destination Control, 2021 - 2034, (USD Billion) (Thousand Units)
- 9.1 Key trends
- 9.2 Smart
- 9.3 Conventional
Chapter 10 Market Estimates & Forecast, By Business, 2021 - 2034, (USD Billion) (Thousand Units)
- 10.1 Key trends
- 10.2 New equipment
- 10.3 Maintenance
- 10.4 Modernization
Chapter 11 Market Estimates & Forecast, By Application, 2021 - 2034, (USD Billion) (Thousand Units)
- 11.1 Key trends
- 11.2 Passenger
- 11.3 Freight
Chapter 12 Market Estimates & Forecast, By End Use, 2021 - 2034, (USD Billion) (Thousand Units)
- 12.1 Key trends
- 12.2 Residential
- 12.2.1 Home lifts
- 12.2.2 Others
- 12.3 Industrial
- 12.4 Commercial
- 12.4.1 Office
- 12.4.2 Hotels
- 12.4.3 Healthcare
- 12.4.4 Others (Shopping malls)
Chapter 13 Market Estimates & Forecast, By Region, 2021 - 2034, (USD Billion) (Thousand Units)
- 13.1 Key trends
- 13.2 North America
- 13.2.1 U.S.
- 13.2.2 Canada
- 13.3 Europe
- 13.3.1 Germany
- 13.3.2 UK
- 13.3.3 France
- 13.3.4 Italy
- 13.3.5 Spain
- 13.4 Asia Pacific
- 13.4.1 China
- 13.4.2 India
- 13.4.3 Japan
- 13.4.4 South Korea
- 13.4.5 Australia
- 13.4.6 Indonesia
- 13.4.7 Malaysia
- 13.5 Latin America
- 13.5.1 Brazil
- 13.5.2 Mexico
- 13.5.3 Argentina
- 13.6 MEA
- 13.6.1 Saudi Arabia
- 13.6.2 UAE
- 13.6.3 South Africa
Chapter 14 Company Profiles
- 14.1 Aritco
- 14.2 Canny Elevator
- 14.3 Electra Elevators
- 14.4 EMAK
- 14.5 ESCON Elevators
- 14.6 Fujitec
- 14.7 Hitachi
- 14.8 Hyundai Elevator
- 14.9 KONE
- 14.10 Mitsubishi Electric
- 14.11 Schindler
- 14.12 Schumacher Elevator
- 14.13 Sigma Elevator
- 14.14 TK Elevator
- 14.15 Toshiba
