|
시장보고서
상품코드
1913364
전기 버스 시장 : 시장 기회, 성장 요인, 산업 동향 분석 및 예측(2026-2035년)Electric Bus Market Opportunity, Growth Drivers, Industry Trend Analysis, and Forecast 2026 - 2035 |
||||||
세계의 전기 버스 시장은 2025년 541억 달러로 평가되었고, 2035년까지 연평균 복합 성장률(CAGR) 16.5%로 성장할 전망이며, 2,551억 달러에 이를 것으로 예측됩니다.
대중 교통 시스템이 보다 깨끗한 도시와 효율적인 운행을 지원하기 위해 전동화 모빌리티로 급속히 이동하는 동안 시장은 급속히 진화하고 있습니다. 전기 버스는 현재 첨단 배터리 시스템, 최적화된 전동 구동 시스템, 지능형 에너지 관리, 효율적인 열 제어로 설계되어 운영 비용을 절감하고 서비스 신뢰성을 향상시킬 수 있습니다. 교통 당국은 노후화된 차량의 근대화를 도모하면서 연료비 및 유지비의 삭감, 배출 가스 저감, 승객의 쾌적성 향상을 목적으로 이러한 차량을 도입하고 있습니다. 탈탄소화, 대기질 개선, 지속 가능한 도시 개발을 위한 정책 주도의 대처가 전기 버스의 도입을 직접 가속화하고 있습니다. 충전 인프라, 차량의 디지털화 및 운영 분석에 대한 대규모 투자로 운영자는 가동 시간을 극대화하고 경로 계획을 개선할 수 있습니다. 전기가 진행됨에 따라 기존 연료에 대한 의존도가 저하되는 가운데, 전기 버스는 도시 간 및 도시 내 수송 네트워크 전체에 있어서, 환경 성능 및 경제적 안정성의 양쪽을 향상시키는 장기적 해결책으로서, 점점 주목받고 있습니다.
| 시장 범위 | |
|---|---|
| 시작 연도 | 2025년 |
| 예측 연도 | 2026-2035년 |
| 시작 시 가치 | 541억 달러 |
| 예측 금액 | 2,551억 달러 |
| CAGR | 16.5% |
2025년에는 전 전기식 카테고리가 89.5%의 점유율을 차지하였고, 2035년까지 연평균 복합 성장률(CAGR) 16.2%로 성장할 것으로 예측됩니다. 이 부문은 제로 방출 운전, 기계적 복잡성 감소, 강력한 규제 지원으로 시장을 선도하고 있습니다. 교통 사업자는 배출 감소 목표에 맞추어 대체 추진 기술에 비해 라이프타임 소유 비용이 낮기 때문에 완전 전기식 버스를 선호하여 채용하고 있습니다.
100-300kWh의 배터리용량대는 2025년에 50.3%의 점유율을 차지했으며, 2026-2035년 CAGR 16.6%로 확대될 것으로 예측됩니다. 이 배터리 클래스는 항속 거리, 충전 효율, 차량 중량의 균형이 우수하기 때문에 널리 채용되고 있습니다. 이 용량 대역 버스는 과도한 충전 중단 없이 일상적인 노선 운행 요건을 충족하므로 운영자가 안정적인 운행 일정을 유지하고 운영 비용을 관리하는 데 도움이 됩니다.
중국 전기버스 시장은 2025년에 65.5%의 점유율을 차지했으며, 210억 8,000만 달러의 규모를 달성했습니다. 시장 주도 지위는 강력한 정책 무결성, 장기 차량 전동화 프로그램, 전통적인 버스에서 전기 버스로의 광범위한 대체 도입으로 지원됩니다. 대중 교통 근대화에 대한 지속적인 투자는 대도시권 및 지방 네트워크 전반에 걸쳐 높은 도입 수준을 유지하고 있습니다.
자주 묻는 질문
목차
제1장 조사 방법
제2장 주요 요약
제3장 업계 인사이트
- 생태계 분석
- 공급자의 상황
- 이익률 분석
- 비용 구조
- 각 단계에서의 부가가치
- 밸류체인에 영향을 주는 요인
- 혁신
- 업계에 미치는 영향요인
- 성장 촉진요인
- 제로에미션 대중교통에 대한 정부의 의무화 증가
- 전기 버스 도입을 위한 공적 자금 및 보조금의 급증
- 도시의 대기질에 대한 우려 고조 및 지속가능성 목표의 강화
- 디젤버스에 비해 총소유비용 절감에 대한 수요 증가
- 배터리 에너지 밀도 및 파워트레인 효율의 진보
- 업계의 잠재적 위험 및 과제
- 전기 버스 및 충전 인프라에 대한 고액의 초기 비용
- 개발 도상 지역에서 충전 인프라 및 송전망 용량의 부족
- 시장 기회
- 신흥 경제국의 전기 버스 도입 확대
- 도시 간 및 장거리 버스 노선의 전동화 확대
- 배터리 교환 및 서비스로서의 에너지(EaaS) 비즈니스 모델 증가
- 스마트 시티 구상에 전기 버스의 통합 촉진
- 성장 촉진요인
- 성장 가능성 분석
- 규제 상황
- 북미
- 미국 연방 정부의 전동화 인센티브 및 인프라 자금 조달
- 유럽
- 독일 : 전기 이동성법(EmoG)
- 영국 : 제로 방출 버스 자금 조달 프로그램
- 프랑스 : 모빌리티 지향법(LOM법)
- 이탈리아 : 국가 에너지 및 기후 계획(PNIEC)
- 아시아태평양
- 중국 : 신에너지차(NEV) 의무화 정책
- 인도 : FAME II 전기 버스 보조금 제도
- 일본 : 국가 EV 및 FCV 도입 로드맵
- 호주 : 주 수준의 제로 방출 버스 목표
- 라틴아메리카
- 브라질 : 국가 전기 이동성 정책(PNME)
- 멕시코 : 도시 지역의 제로 방출 공공 교통 프로그램
- 아르헨티나 : 주별 클린 모빌리티 규제
- 중동 및 아프리카
- UAE : 전기자동차 충전 및 클린 수송 규제
- 사우디아라비아 : 비전 2030 EV 수송 프레임워크
- 남아프리카 : 녹색 교통 전략
- 북미
- Porter's Five Forces 분석
- PESTEL 분석
- 기술 및 혁신 동향
- 현재 기술 동향
- 신흥 기술
- 특허 분석
- 가격 분석
- 지역별
- 추진력별
- 생산 통계
- 생산 거점
- 소비 거점
- 수출 및 수입
- 비용 내역 분석
- 차량 비용
- 운영 비용
- 총소유 비용(TCO)
- 충전 인프라 비용
- 설치 및 가동 비용
- 연구개발비
- 지속가능성 및 환경 영향 분석
- 지속가능한 실천
- 폐기물 감축 전략
- 생산에 있어서 에너지 효율
- 환경에 배려한 대처
- 탄소발자국에 관한 고려 사항
- 전망 및 기회
- 기술 로드맵 및 진화의 타임라인
- 새로운 용도 분야의 기회
- 투자 요건 및 자금 조달원
- 리스크 평가 및 경감책
- 시장 진출 기업에 대한 전략적 제안
제4장 경쟁 구도
- 서문
- 기업의 시장 점유율 분석
- 주요 시장 기업의 경쟁 분석
- 경쟁 포지셔닝 매트릭스
- 전략적 전망 매트릭스
- 주요 발전
- 합병 및 인수
- 제휴 및 협업
- 신제품 발매
- 사업 확대 계획 및 자금 조달
제5장 시장 추계 및 예측 : 추진력별(2022-2035년)
- 전 전기식
- PHEV
- 연료전지자동차(FCEV)
제6장 시장 추계 및 예측 : 좌석수별(2022-2035년)
- 40석 미만
- 40-70
- 70석 이상
제7장 시장 추계 및 예측 : 서비스별(2022-2035년)
- 도시 간
- 시내
제8장 시장 추계 및 예측 : 소유 형태별(2022-2035년)
- 정부
- 자사 소유 차량
- 리스 및 렌탈
- 라이드 셰어링 사업자
- 기타
제9장 시장 추계 및 예측 : 충전 인프라별(2022-2035년)
- 공공 충전 네트워크
- 비공개
- 하이브리드
제10장 시장 추계 및 예측 : 배터리 용량별(2022-2035년)
- 100kWh 미만
- 100-300kW시
- 300kWh 이상
제11장 시장 추계 및 예측 : 지역별(2022-2035년)
- 북미
- 미국
- 캐나다
- 유럽
- 독일
- 영국
- 프랑스
- 이탈리아
- 스페인
- 러시아
- 북유럽 국가
- 아시아태평양
- 중국
- 인도
- 일본
- 호주
- 한국
- 필리핀
- 인도네시아
- 라틴아메리카
- 브라질
- 멕시코
- 아르헨티나
- 중동 및 아프리카
- 남아프리카
- 사우디아라비아
- 아랍에미리트(UAE)
제12장 기업 프로파일
- 세계 기업
- BYD
- Daimler
- Geely Automobile Holdings
- IVECO
- MAN Bus
- NFI
- Scania
- Tata Motors
- Volvo
- Zhengzhou Yutong Bus
- 지역 제조업체
- Beiqi Foton Motor
- Ebusco
- Irizar
- King Long United Automotive
- Solaris Bus &Coach
- VDL Bus &Coach
- Xiamen Golden Dragon Bus
- 신흥 제조업체
- Anhui Ankai Automobile.
- Proterra
- Zhongtong Bus
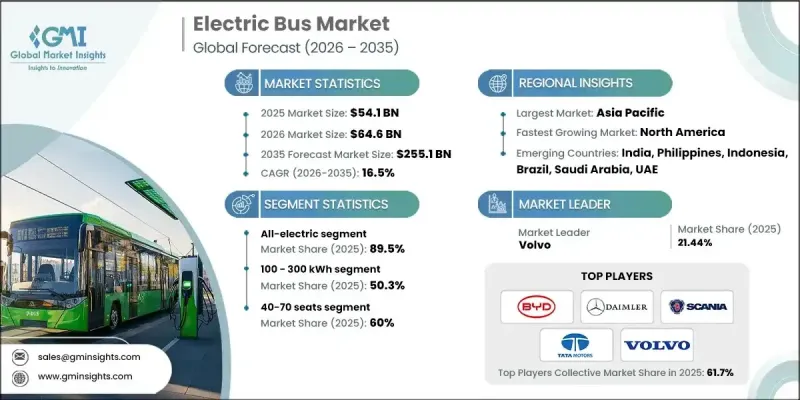
The Global Electric Bus Market was valued at USD 54.1 billion in 2025 and is estimated to grow at a CAGR of 16.5% to reach USD 255.1 billion by 2035.

The market is evolving rapidly as public transportation systems increasingly shift toward electrified mobility to support cleaner cities and more efficient transit operations. Electric buses are now designed with advanced battery systems, optimized electric drivetrains, intelligent energy management, and efficient thermal controls that enable lower operating expenses and improved service reliability. Transit authorities are adopting these vehicles to cut fuel and maintenance costs, lower emissions, and enhance rider comfort while modernizing aging fleets. Policy-driven commitments to decarbonization, air quality improvement, and sustainable urban development are directly accelerating electric bus adoption. Large-scale investments in charging infrastructure, fleet digitization, and operational analytics are allowing operators to maximize uptime and improve route planning. As electrification reduces dependence on conventional fuels, electric buses are increasingly viewed as a long-term solution that improves both environmental performance and economic stability across urban and intercity transport networks.
| Market Scope | |
|---|---|
| Start Year | 2025 |
| Forecast Year | 2026-2035 |
| Start Value | $54.1 Billion |
| Forecast Value | $255.1 Billion |
| CAGR | 16.5% |
The all-electric category represented 89.5% share in 2025 and is forecast to grow at a CAGR of 16.2% through 2035. This segment leads the market due to its zero-emission operation, reduced mechanical complexity, and strong regulatory backing. Transit operators favor fully electric buses as they align with emission reduction targets while offering lower lifetime ownership costs compared to alternative propulsion technologies.
The 100-300 kWh battery capacity range accounted for 50.3% share in 2025 and is expected to expand at a CAGR of 16.6% between 2026 and 2035. This battery class is widely adopted because it offers an effective balance between driving range, charging efficiency, and vehicle weight. Buses in this range support daily route requirements without excessive charging interruptions, helping operators maintain consistent schedules and control operational costs.
China Electric Bus Market held 65.5% share and generated USD 21.08 billion during 2025. Market leadership is supported by strong policy alignment, long-term fleet electrification programs, and widespread replacement of conventional buses with electric alternatives. Continuous investment in public transport modernization has sustained high deployment levels across metropolitan and regional networks.
Key companies operating in the Global Electric Bus Market include BYD, Solaris Bus & Coach, Tata Motors, Volvo, Zhongtong Bus, Proterra, Daimler, NFI Group, Scania, and MAN Bus. Companies in the Global Electric Bus Market are strengthening their competitive position through technology innovation, capacity expansion, and strategic partnerships. Manufacturers are investing heavily in battery efficiency improvements, modular vehicle platforms, and software-enabled fleet management solutions to enhance performance and reliability. Localization of manufacturing and supply chains is being used to reduce costs and meet regional procurement requirements. Firms are also offering comprehensive service packages that include maintenance support, charging solutions, and lifecycle management to build long-term customer relationships. Collaboration with transit authorities and infrastructure providers is enabling smoother deployment, while continuous product upgrades help address evolving regulatory and operational expectations across global markets.
Table of Contents
Chapter 1 Methodology
- 1.1 Research approach
- 1.2 Quality commitments
- 1.2.1 GMI AI policy & data integrity commitment
- 1.3 Research trail & confidence scoring
- 1.3.1 Research trail components
- 1.3.2 Scoring components
- 1.4 Data collection
- 1.4.1 Partial list of primary sources
- 1.5 Data mining sources
- 1.5.1 Paid sources
- 1.6 Base estimates and calculations
- 1.6.1 Base year calculation
- 1.7 Forecast model
- 1.8 Research transparency addendum
Chapter 2 Executive Summary
- 2.1 Industry 3600 synopsis, 2022 - 2035
- 2.2 Key market trends
- 2.2.1 Regional
- 2.2.2 Propulsion
- 2.2.3 Battery capacity
- 2.2.4 Seating capacity
- 2.2.5 Service
- 2.2.6 Fleet ownership
- 2.2.7 Charging infrastructure
- 2.3 TAM Analysis, 2026-2035
- 2.4 CXO perspectives: Strategic imperatives
- 2.4.1 Executive decision points
- 2.4.2 Critical success factors
- 2.5 Future outlook and strategic recommendations
Chapter 3 Industry Insights
- 3.1 Industry ecosystem analysis
- 3.1.1 Supplier landscape
- 3.1.2 Profit margin analysis
- 3.1.3 Cost structure
- 3.1.4 Value addition at each stage
- 3.1.5 Factor affecting the value chain
- 3.1.6 Disruptions
- 3.2 Industry impact forces
- 3.2.1 Growth drivers
- 3.2.1.1 Rise in government mandates for zero-emission public transportation
- 3.2.1.2 Surge in public funding and subsidies for electric bus procurement
- 3.2.1.3 Increase in urban air-quality concerns and sustainability targets
- 3.2.1.4 Growth in demand for lower total cost of ownership compared to diesel buses
- 3.2.1.5 Advancements in battery energy density and powertrain efficiency
- 3.2.2 Industry pitfalls and challenges
- 3.2.2.1 High upfront cost of electric buses and charging infrastructure
- 3.2.2.2 Limited charging infrastructure and grid capacity in developing regions
- 3.2.3 Market opportunities
- 3.2.3.1 Expansion of electric bus adoption in emerging economies
- 3.2.3.2 Growth in electrification of intercity and long-distance bus routes
- 3.2.3.3 Rise in battery swapping and energy-as-a-service business models
- 3.2.3.4 Increasing integration of electric buses into smart city initiatives
- 3.2.1 Growth drivers
- 3.3 Growth potential analysis
- 3.4 Regulatory landscape
- 3.4.1 North America
- 3.4.1.1 US Federal Electrification Incentives & Infrastructure Funding.
- 3.4.2 Europe
- 3.4.2.1 Germany: Electric Mobility Act (EmoG)
- 3.4.2.2 UK: Zero-Emission Bus Funding Programs
- 3.4.2.3 France: Mobility Orientation Law (LOM Act)
- 3.4.2.4 Italy: National Energy & Climate Plan (PNIEC)
- 3.4.3 Asia Pacific
- 3.4.3.1 China: New Energy Vehicle (NEV) Mandate
- 3.4.3.2 India: FAME II Electric Bus Incentives
- 3.4.3.3 Japan: National EV & FCV Deployment Roadmap
- 3.4.3.4 Australia: State-Level Zero-Emission Bus Targets
- 3.4.4 Latin America
- 3.4.4.1 Brazil: National Electric Mobility Policy (PNME)
- 3.4.4.2 Mexico: Urban Zero-Emission Public Transport Programs
- 3.4.4.3 Argentina: Provincial Clean Mobility Regulations
- 3.4.5 MEA
- 3.4.5.1 UAE: EV Charging & Clean Transport Regulations
- 3.4.5.2 Saudi Arabia: Vision 2030 EV Transport Framework
- 3.4.5.3 South Africa: Green Transport Strategy
- 3.4.1 North America
- 3.5 Porter's analysis
- 3.6 PESTEL analysis
- 3.7 Technology and Innovation landscape
- 3.7.1 Current technological trends
- 3.7.2 Emerging technologies
- 3.8 Patent analysis
- 3.9 Pricing Analysis
- 3.9.1 By region
- 3.9.2 By propulsion
- 3.10 Production statistics
- 3.10.1 Production hubs
- 3.10.2 Consumption hubs
- 3.10.3 Export and import
- 3.11 Cost breakdown analysis
- 3.11.1 Vehicle Cost
- 3.11.2 Operational Cost
- 3.11.3 Total cost of ownership (TCO)
- 3.11.4 Charging Infrastructure Cost
- 3.11.5 Installation & activation costs
- 3.11.6 Research & development costs
- 3.12 Sustainability and environmental impact analysis
- 3.12.1 Sustainable practices
- 3.12.2 Waste reduction strategies
- 3.12.3 Energy efficiency in production
- 3.12.4 Eco-friendly initiatives
- 3.12.5 Carbon footprint considerations
- 3.13 Future outlook & opportunities
- 3.13.1 Technology roadmap & evolution timeline
- 3.13.2 Emerging application opportunities
- 3.13.3 Investment requirements & funding sources
- 3.13.4 Risk assessment & mitigation strategies
- 3.13.5 Strategic recommendations for market participants
Chapter 4 Competitive Landscape, 2025
- 4.1 Introduction
- 4.2 Company market share analysis
- 4.2.1 North America
- 4.2.2 Europe
- 4.2.3 Asia Pacific
- 4.2.4 Latin America
- 4.2.5 MEA
- 4.3 Competitive analysis of major market players
- 4.4 Competitive positioning matrix
- 4.5 Strategic outlook matrix
- 4.6 Key developments
- 4.6.1 Mergers & acquisitions
- 4.6.2 Partnerships & collaborations
- 4.6.3 New Product Launches
- 4.6.4 Expansion Plans and funding
Chapter 5 Market Estimates & Forecast, By Propulsion, 2022 - 2035 ($Bn, Units)
- 5.1 Key trends
- 5.2 All-electric
- 5.3 PHEV
- 5.4 FCEV
Chapter 6 Market Estimates & Forecast, By Seating Capacity, 2022 - 2035 ($Bn, Units)
- 6.1 Key trends
- 6.2 Below 40
- 6.3 40-70
- 6.4 Above 70
Chapter 7 Market Estimates & Forecast, By Service, 2022 - 2035 ($Bn, Units)
- 7.1 Key trends
- 7.2 Intercity
- 7.3 Intracity
Chapter 8 Market Estimates & Forecast, By Fleet Ownership, 2022 - 2035 ($Bn, Units)
- 8.1 Key trends
- 8.2 Government
- 8.3 Private Fleet
- 8.4 Leasing & Rental
- 8.5 Ride-hailing Operator
- 8.6 Others
Chapter 9 Market Estimates & Forecast, By Charging Infrastructure, 2022 - 2035 ($Bn, Units)
- 9.1 Key trends
- 9.2 Public Charging Network
- 9.3 Private
- 9.4 Hybrid
Chapter 10 Market Estimates & Forecast, By Battery Capacity, 2022 - 2035 ($Bn, Units)
- 10.1 Key trends
- 10.2 Below 100 kWh
- 10.3 100-300 kWh
- 10.4 Above 300 kWh
Chapter 11 Market Estimates & Forecast, By Region, 2022 - 2035 ($Bn, Units)
- 11.1 Key trends
- 11.2 North America
- 11.2.1 US
- 11.2.2 Canada
- 11.3 Europe
- 11.3.1 Germany
- 11.3.2 UK
- 11.3.3 France
- 11.3.4 Italy
- 11.3.5 Spain
- 11.3.6 Russia
- 11.3.7 Nordics
- 11.4 Asia Pacific
- 11.4.1 China
- 11.4.2 India
- 11.4.3 Japan
- 11.4.4 Australia
- 11.4.5 South Korea
- 11.4.6 Philippines
- 11.4.7 Indonesia
- 11.5 Latin America
- 11.5.1 Brazil
- 11.5.2 Mexico
- 11.5.3 Argentina
- 11.6 MEA
- 11.6.1 South Africa
- 11.6.2 Saudi Arabia
- 11.6.3 UAE
Chapter 12 Company Profiles
- 12.1 Global Players
- 12.1.1 BYD
- 12.1.2 Daimler
- 12.1.3 Geely Automobile Holdings
- 12.1.4 IVECO
- 12.1.5 MAN Bus
- 12.1.6 NFI
- 12.1.7 Scania
- 12.1.8 Tata Motors
- 12.1.9 Volvo
- 12.1.10 Zhengzhou Yutong Bus
- 12.2 Regional Players
- 12.2.1 Beiqi Foton Motor
- 12.2.2 Ebusco
- 12.2.3 Irizar
- 12.2.4 King Long United Automotive
- 12.2.5 Solaris Bus & Coach
- 12.2.6 VDL Bus & Coach
- 12.2.7 Xiamen Golden Dragon Bus
- 12.3 Emerging Players
- 12.3.1 Anhui Ankai Automobile.
- 12.3.2 Proterra
- 12.3.3 Zhongtong Bus