|
시장보고서
상품코드
1766307
건식 전기 집진기 시장 : 기회, 성장 촉진요인, 산업 동향 분석, 예측(2025-2034년)Dry Electrostatic Precipitator Market Opportunity, Growth Drivers, Industry Trend Analysis, and Forecast 2025 - 2034 |
||||||
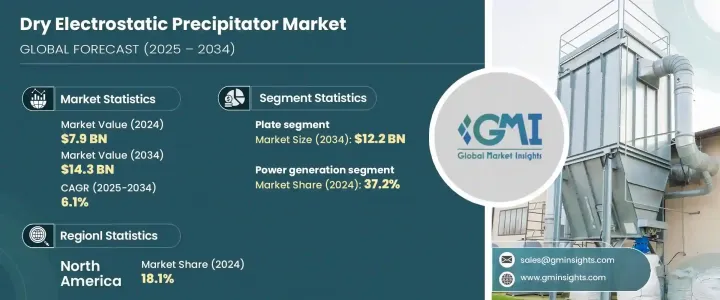
세계의 건식 전기 집진기 시장은 2024년 79억 달러로 평가되었으며 CAGR 6.1%로 성장해 2034년까지 143억 달러에 이를 것으로 추정됩니다.
이러한 시스템의 채용은 대기 오염 삭감과 산업 발생원으로부터의 입자상 물질의 배출의 제어를 목적으로 한, 세계의 환경 규제의 엄격화의 영향을 강하게 받고 있습니다. 또한, 특히 아시아태평양 등의 신흥 시장에서의 급속한 공업화와 도시화가, 효과적인 대기 오염 방지 솔루션 수요를 촉진해, 이것이 건식 전기 집진

시장의 성장은 전기 집진 시스템의 성능과 효율을 높이는 첨단 기술에 대한 다액의 투자에 의해서도 뒷받침되고 있습니다. 전극 설계, 첨단 재료, 고도의 제어 시스템의 혁신에 의해 이러한 시스템의 포집 효율과 신뢰성이 향상하고 있습니다. 이 시스템은 PM2.5와 같은 미립자에 대해 99% 이상의 포집 효율을 달성할 수 있기 때문에 발전, 시멘트, 야금 등의 산업에 있어서의 대용량의 배기 가스 응용에 적합합니다.
| 시장 범위 | |
|---|---|
| 시작 연도 | 2024년 |
| 예측 연도 | 2025-2034년 |
| 시작 금액 | 79억 달러 |
| 예측 금액 | 143억 달러 |
| CAGR | 6.1% |
건식 전기 집진기 시장의 판형 부문은 미세 입자상 물질을 포착하는 뛰어난 능력으로 인해 2034년까지 122억 달러에 이를 것으로 예측됩니다. 플레이트식 전기 집진기 수요 증가는 다양한 환경에 있어서의 그 적응성과 효율성에 의한 것으로, 보다 청정한 배출과 대기질의 개선을 보증합니다.
제조업 섹터는 견조한 성장률이 전망되고 있으며, 2025-2034년 CAGR은 6.7%로 예측되고 있습니다. 이 성장의 원동력이 되는 것은 산업 근대화의 중시의 고조, 직장의 대기질 규제의 엄격화, 호흡기계의 건강 리스크에 대한 의식의 고조 등 몇 가지 요인입니다. 보다 깨끗하고 지속 가능한 생산 공정에 대한 수요도 건식 전기 집진기의 보급을 뒷받침하고 있습니다. 기업은 부유 미립자 물질을 완화하기 위해 자동 분진 제어 시스템을 채택하여 이러한 기술의 필요성을 더욱 향상시키고 있습니다. 산업계가 환경 실적를 개선하고 보다 엄격한 규제 요건을 준수하기 위해 노력하고 있기 때문에 건식 전기 집진기와 같은 효과적인 오염 제어 기술에 대한 수요는 제조 분야에서 크게 증가할 것으로 예측됩니다.
아시아태평양의 건식 전기 집진기 시장은 2034년까지 67억 달러에 이를 것으로 예측됩니다. 이 지역에서는 석탄 기반 발전의 확대가 계속되고 있으며, 이는 시장 성장의 주요 요인이 되고 있습니다. 많은 국가에서 석탄이 여전히 1차 에너지원이기 때문에 오염을 완화하기 위한 배출가스 제어 시스템에 대한 수요가 증가하고 있습니다. 또한 시멘트 및 금속 산업에 첨단 대기 오염 방지 기술을 설치하면 건식 전기 집진기의 채택을 더욱 강화하고 있습니다. 대기 오염 삭감을 목적으로 한 규제 조치가 산업계에 클린 기술에 대한 투자를 촉구하고 있습니다. 또한 이 지역에서는 다양한 산업 부문에 대한 투자가 증가하고 있으며, 최첨단 미립자 제어 솔루션의 채용이 가속화되어 건식 전기 집진기 시장을 강화하고 있습니다.
세계의 건식 전기 집진기 업계에서는 GEAGroup Aktiengesellschaft, Babcock and Wilcox Enterprises, Siemens Energy, Mitsubishi Heavy Industries, ANDRITZ GROUP, Duconenv, Thermax, PPC Industries, Sumitomo Heavy Industries, Wood, Enviro India, WEIXIAN. 등이 유명 기업입니다. 건식 전기 집진기 시장에서의 프레즌스를 강화하기 위해, 각사는 지속적인 혁신과 전략적 파트너십에 주력하고 있습니다. 기업은 또한 산업의 성장과 환경 규제가 기회를 창출하고 있는 신흥 시장에서 세계 발자국의 확대에도 주력하고 있습니다.
목차
제1장 조사 방법과 범위
제2장 주요 요약
제3장 업계 인사이트
- 업계 에코시스템
- 규제 상황
- 업계에 미치는 영향요인
- 성장 촉진요인
- 업계의 잠재적 위험 및 과제
- 성장 가능성 분석
- Porter's Five Forces 분석
- PESTEL 분석
제4장 경쟁 구도
- 소개
- 기업의 시장 점유율
- 전략적 대시보드
- 전략적 노력
- 경쟁 벤치마킹
- 혁신과 지속가능성의 정세
제5장 시장 규모와 예측 : 디자인별, 2021-2034년
- 주요 동향
- 플레이트식
- 튜브형
제6장 시장 규모와 예측 : 배출산업별, 2021-2034년
- 주요 동향
- 발전
- 화학제품 및 석유화학제품
- 시멘트
- 금속가공 및 광업
- 제조업
- 해양
- 기타
제7장 시장 규모와 예측 : 지역별, 2021-2034년
- 주요 동향
- 북미
- 미국
- 캐나다
- 멕시코
- 유럽
- 독일
- 영국
- 프랑스
- 스페인
- 이탈리아
- 네덜란드
- 아시아태평양
- 중국
- 인도
- 일본
- 한국
- 인도네시아
- 호주
- 중동 및 아프리카
- 사우디아라비아
- 아랍에미리트(UAE)
- 남아프리카
- 나이지리아
- 앙골라
- 라틴아메리카
- 브라질
- 아르헨티나
- 칠레
- 페루
제8장 기업 프로파일
- ANDRITZ GROUP
- Babcock and Wilcox Enterprises
- Duconenv
- DURR Group
- Enviropol Engineers
- GEA Group Aktiengesellschaft
- KC Cottrell India
- Mitsubishi Heavy Industries
- PPC Industries
- Siemens Energy
- Sumitomo Heavy Industries
- Thermax
- TAPC
- Wood
The Global Dry Electrostatic Precipitator Market was valued at USD 7.9 billion in 2024 and is estimated to grow at a CAGR of 6.1% to reach USD 14.3 billion by 2034. The adoption of these systems is being strongly influenced by stricter environmental regulations worldwide aimed at reducing air pollution and controlling emissions of particulate matter from industrial sources. Additionally, rapid industrialization and urbanization, especially in emerging markets like the Asia Pacific, are driving the demand for effective air pollution control solutions, which is propelling the adoption of dry electrostatic precipitators.
The growth of the market is also being fueled by significant investments in advanced technologies that enhance the performance and efficiency of electrostatic precipitator systems. Innovations in electrode designs, advanced materials, and sophisticated control systems are improving the collection efficiency and reliability of these systems. The compact nature of dry ESPs, requiring up to two or three times less vertical space for the same gas volume, makes them ideal for installations with limited space. These systems can achieve collection efficiencies of more than 99% for fine particles like PM2.5, making them suitable for high-capacity flue gas applications in industries such as power generation, cement, and metallurgy. Moreover, their continuous operation capabilities, along with their ability to handle heavy dust loads with minimal maintenance, make them an economically viable long-term solution for industries.
| Market Scope | |
|---|---|
| Start Year | 2024 |
| Forecast Year | 2025-2034 |
| Start Value | $7.9 Billion |
| Forecast Value | $14.3 Billion |
| CAGR | 6.1% |
The plate-based segment of the dry electrostatic precipitator market is poised to reach USD 12.2 billion by 2034, owing to their superior ability to capture fine particulate matter. These systems have demonstrated high collection efficiency, particularly for smaller particles, making them highly effective in controlling air pollution. Their versatility across a wide range of applications, from small-scale industrial operations to large power plants, has fueled their widespread adoption. The increased demand for plate ESPs is attributed to their adaptability and efficiency in diverse settings, ensuring cleaner emissions and improved air quality. This makes them a preferred choice for industries that require advanced air pollution control solutions, especially those dealing with high volumes of exhaust gases.
The manufacturing sector is expected to experience a robust growth rate, with a projected CAGR of 6.7% between 2025 and 2034. Several factors are driving this growth, such as the increasing emphasis on industrial modernization, stricter workplace air quality regulations, and growing awareness of respiratory health risks. The demand for cleaner, more sustainable production processes is also encouraging the widespread adoption of dry electrostatic precipitators. Companies are adopting automated dust control systems to mitigate airborne particulate matter, further boosting the need for these technologies. As industries strive to improve their environmental footprint and comply with stricter regulatory requirements, the demand for effective pollution control technologies like dry ESPs is expected to grow significantly in the manufacturing sector.
Asia Pacific Dry Electrostatic Precipitator Market is anticipated to reach USD 6.7 billion by 2034. The ongoing expansion of coal-based power generation in the region is a significant contributor to the market growth. As coal remains a primary energy source in many countries, the demand for emission control systems to mitigate pollution is rising. Additionally, the installation of advanced air pollution control technologies in cement and metal industries is further propelling the adoption of dry electrostatic precipitators. Regulatory measures aimed at reducing air pollution are encouraging industries to invest in cleaner technologies. The region is also experiencing increased investments in various industrial sectors, which will accelerate the adoption of cutting-edge particulate control solutions, bolstering the dry ESP market.
Prominent players in the Global Dry Electrostatic Precipitator Industry include GEAGroup Aktiengesellschaft, Babcock and Wilcox Enterprises, Siemens Energy, Mitsubishi Heavy Industries, ANDRITZ GROUP, Duconenv, Thermax, PPC Industries, Sumitomo Heavy Industries, Wood, Enviropol Engineers, DURR Group, TAPC, KC Cottrell India, and WEIXIAN. To strengthen their presence in the dry electrostatic precipitator market, companies are focusing on continuous innovation and strategic partnerships. By investing in the development of more efficient systems that meet stringent environmental standards, they aim to cater to the growing demand for advanced pollution control technologies. Companies are also focusing on expanding their global footprint, particularly in emerging markets, where industrial growth and environmental regulations are creating opportunities. Many companies are also diversifying their product offerings to provide tailored solutions for different industries, from power generation to manufacturing, further cementing their market positions.
Table of Contents
Chapter 1 Methodology & Scope
- 1.1 Research design
- 1.2 Base estimates & calculations
- 1.3 Forecast calculation
- 1.4 Primary research & validation
- 1.4.1 Primary sources
- 1.4.2 Data mining sources
- 1.5 Market definitions
Chapter 2 Executive Summary
- 2.1 Industry synopsis, 2021 - 2034
Chapter 3 Industry Insights
- 3.1 Industry ecosystem
- 3.2 Regulatory landscape
- 3.3 Industry impact forces
- 3.3.1 Growth drivers
- 3.3.2 Industry pitfalls & challenges
- 3.4 Growth potential analysis
- 3.5 Porter's analysis
- 3.5.1 Bargaining power of suppliers
- 3.5.2 Bargaining power of buyers
- 3.5.3 Threat of new entrants
- 3.5.4 Threat of substitutes
- 3.6 PESTEL analysis
Chapter 4 Competitive landscape, 2024
- 4.1 Introduction
- 4.2 Company market share
- 4.3 Strategic dashboard
- 4.4 Strategic initiative
- 4.5 Competitive benchmarking
- 4.6 Innovation & sustainability landscape
Chapter 5 Market Size and Forecast, By Design, 2021 - 2034 (USD Billion)
- 5.1 Key trends
- 5.2 Plate
- 5.3 Tubular
Chapter 6 Market Size and Forecast, By Emitting Industry, 2021 - 2034 (USD Billion)
- 6.1 Key trends
- 6.2 Power generation
- 6.3 Chemicals and petrochemicals
- 6.4 Cement
- 6.5 Metal processing & mining
- 6.6 Manufacturing
- 6.7 Marine
- 6.8 Others
Chapter 7 Market Size and Forecast, By Region, 2021 - 2034 (USD Billion)
- 7.1 Key trends
- 7.2 North America
- 7.2.1 U.S.
- 7.2.2 Canada
- 7.2.3 Mexico
- 7.3 Europe
- 7.3.1 Germany
- 7.3.2 UK
- 7.3.3 France
- 7.3.4 Spain
- 7.3.5 Italy
- 7.3.6 Netherlands
- 7.4 Asia Pacific
- 7.4.1 China
- 7.4.2 India
- 7.4.3 Japan
- 7.4.4 South Korea
- 7.4.5 Indonesia
- 7.4.6 Australia
- 7.5 Middle East & Africa
- 7.5.1 Saudi Arabia
- 7.5.2 UAE
- 7.5.3 South Africa
- 7.5.4 Nigeria
- 7.5.5 Angola
- 7.6 Latin America
- 7.6.1 Brazil
- 7.6.2 Argentina
- 7.6.3 Chile
- 7.6.4 Peru
Chapter 8 Company Profiles
- 8.1 ANDRITZ GROUP
- 8.2 Babcock and Wilcox Enterprises
- 8.3 Duconenv
- 8.4 DURR Group
- 8.5 Enviropol Engineers
- 8.6 GEA Group Aktiengesellschaft
- 8.7 KC Cottrell India
- 8.8 Mitsubishi Heavy Industries
- 8.9 PPC Industries
- 8.10 Siemens Energy
- 8.11 Sumitomo Heavy Industries
- 8.12 Thermax
- 8.13 TAPC
- 8.14 Wood