|
시장보고서
상품코드
1721532
발전용 전기 집진기 시장 기회, 성장 촉진요인, 산업 동향 분석 및 예측(2025-2034년)Power Generation Electrostatic Precipitator Market Opportunity, Growth Drivers, Industry Trend Analysis, and Forecast 2025 - 2034 |
||||||
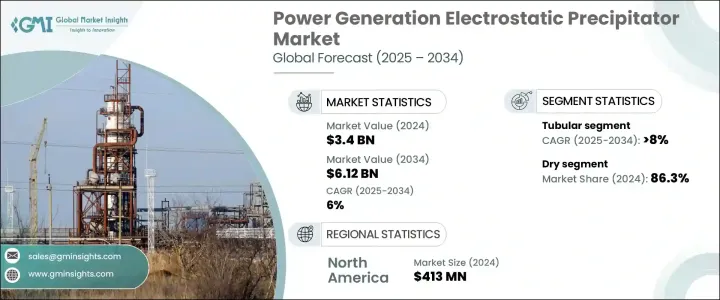
세계의 발전용 전기 집진기 시장 규모는 2024년 34억 달러로 평가되었고, CAGR 6%를 나타내 2034년에는 61억 2,000만 달러에 달할 것으로 예측되고 있습니다. 각국 정부는 기후 변화에 대응하고 산업 운영에서 발생하는 유해 미립자 물질 배출을 제한하기 위해 대기질 규제를 강화하고 있습니다.
전력 섹터 전체에서 탈탄소 전략이 대두해 지속 가능한 실천 및 인프라의 근대화로의 변화와 함께, 세계 전기 집진기 수요가 높아지고 있습니다. 신흥 경제 국가에서는 청정 에너지 전환을 지원하는 유리한 정책 프레임 워크, 세금 우대 조치, 정부 보조금으로 인해 특히 급속한 도입이 진행되고 있습니다.
| 시장 범위 | |
|---|---|
| 시작 연도 | 2024년 |
| 예측 연도 | 2025-2034년 |
| 시작 금액 | 34억 달러 |
| 예측 금액 | 61억 2,000만 달러 |
| CAGR | 6% |
발전소는 대기 중으로 재나 미립자의 방출을 효과적으로 줄일 수 있는 보다 고효율의 시스템을 적극적으로 요구하고 있습니다. 마모와 부식으로부터 발전 장비의 내부 구성 요소를 보호하는 데 중요한 역할을 합니다.
시장은 디자인별로 구분되고 관형 전기 집진기는 2034년까지 연평균 복합 성장률(CAGR) 8%를 나타낼 것으로 예측됩니다. 축축한 배기 가스 조건 하에서 효과적인 성능을 발휘하기 위해 배연 탈황 장치를 갖춘 시설에 최적의 솔루션이 되어 하이브리드 배기 가스 제어 시스템에 새로운 성장 기회를 가져오고 있습니다.
시스템의 경우 시장은 습식 ESP와 건식 ESP로 나뉘어져 있습니다. 부족한 지역에서 선호되며 석탄 화력 발전소와 바이오 매스 발전소에서 볼 수있는 고온 환경을 견딜 수 있습니다.
미국의 발전용 전기 집진기 시장은 노후화된 전력 인프라를 업그레이드할 필요성에 따라 2024년에는 4억 1,300만 달러에 이르렀습니다.
경쟁 구도를 형성하는 주요 기업은 Isgec Heavy Engineering, FLSmidth, Thermax Group, PPC Industries, 스미토모 중기계 산업, TAPC, ANDRITZ GROUP, Babcock and Wilcox Enterprises, Wood PLC, KC Cottrell India, Hitachi Power Systems, Enviropol Engine Corp. 등입니다. 이러한 기업은 기술 혁신에 주력하고 있으며, 미립자 포집 효율의 향상, 내식성 재료, 스마트 오토메이션 기능을 갖춘 차세대 전기 집진기의 개발에 임하고 있습니다.
목차
제1장 조사 방법과 범위
제2장 주요 요약
제3장 업계 인사이트
- 업계 에코시스템
- 규제 상황
- 업계에 미치는 영향요인
- 성장 촉진요인
- 업계의 잠재적 위험 및 과제
- 성장 가능성 분석
- Porter's Five Forces 분석
- 공급기업의 협상력
- 구매자의 협상력
- 신규 참가업체의 위협
- 대체품의 위협
- PESTEL 분석
제4장 경쟁 구도
- 서론
- 전략적 대시보드
- 혁신과 기술의 상황
제5장 시장 규모와 예측 : 디자인별(2021-2034년)
- 주요 동향
- 플레이트
- 관형
제6장 시장 규모와 예측 : 시스템별(2021-2034년)
- 주요 동향
- 건식
- 습식
제7장 시장 규모와 예측 : 지역별(2021-2034년)
- 주요 동향
- 북미
- 미국
- 캐나다
- 멕시코
- 유럽
- 독일
- 영국
- 프랑스
- 스페인
- 이탈리아
- 네덜란드
- 아시아태평양
- 중국
- 인도
- 일본
- 한국
- 인도네시아
- 호주
- 중동 및 아프리카
- 사우디아라비아
- 아랍에미리트(UAE)
- 남아프리카
- 나이지리아
- 앙골라
- 라틴아메리카
- 브라질
- 아르헨티나
- 칠레
- 페루
제8장 기업 프로파일
- ANDRITZ GROUP
- Babcock and Wilcox Enterprises
- Enviropol Engineers
- FLSmidth
- Hitachi Power Systems
- Isgec Heavy Engineering
- KC Cottrell India
- PPC Industries
- Sumitomo Heavy Industries
- Thermax Group
- TAPC
- VT Corp
- Wood PLC
The Global Power Generation Electrostatic Precipitator Market was valued at USD 3.4 billion in 2024 and is estimated to grow at a CAGR of 6% to reach USD 6.12 billion by 2034. Market momentum is steadily increasing as power generation facilities across the globe face rising pressure to meet stringent environmental mandates and reduce pollutant emissions. Governments are reinforcing air quality regulations to combat climate change and limit hazardous particulate matter emissions from industrial operations. As a result, there is a growing sense of urgency among power producers to adopt cleaner technologies such as electrostatic precipitators (ESPs), which are effective in capturing airborne particulates and reducing pollution levels.
The rise of decarbonization strategies across the power sector, combined with the shift toward sustainable practices and infrastructure modernization, is reinforcing the demand for ESPs worldwide. Moreover, advancements in ESP design and the integration of smart monitoring capabilities are transforming traditional units into more efficient, automated systems, further fueling market growth. Developing economies are seeing particularly rapid adoption, driven by favorable policy frameworks, tax incentives, and government subsidies supporting clean energy transitions. In many regions, the long-term operational savings and environmental benefits of ESPs are making them a critical investment in utility-scale power generation.
| Market Scope | |
|---|---|
| Start Year | 2024 |
| Forecast Year | 2025-2034 |
| Start Value | $3.4 Billion |
| Forecast Value | $6.12 Billion |
| CAGR | 6% |
Power plants are actively seeking higher-efficiency systems that can effectively reduce the release of ash and fine particles into the atmosphere. These systems not only help facilities stay compliant with tightening emission limits but also play a crucial role in protecting the internal components of power equipment from accelerated wear and corrosion. This dual benefit is strengthening the value proposition of ESPs in both existing and new power projects.
The market is segmented by design, with the tubular electrostatic precipitator type forecasted to grow at a CAGR of 8% through 2034. Tubular ESPs are gaining popularity due to their superior ability to remove ultra-fine particulates-especially those smaller than 1 micron-which is increasingly critical in plants striving to meet ultra-low emission benchmarks. Their effective performance in wet flue gas conditions makes them an optimal solution for facilities equipped with flue gas desulfurization units, opening up new growth opportunities in hybrid emission control systems.
In terms of systems, the market is split into wet and dry ESPs. The dry ESP segment held an 86.3% share in 2024, primarily due to its low operational costs and water-free design. These systems are particularly favored in water-scarce areas and are capable of withstanding high-temperature environments such as those found in coal-fired and biomass power plants. Dry ESPs are also effective in minimizing moisture-driven corrosion, reducing maintenance frequency, and extending equipment lifespan.
The U.S. Power Generation Electrostatic Precipitator Market reached USD 413 million in 2024, driven by the need to upgrade aging power infrastructure. With increasing corporate accountability toward carbon neutrality and stricter EPA standards, U.S. energy providers are deploying advanced ESP technologies to ensure cleaner energy production and long-term sustainability.
Key players shaping the competitive landscape include Isgec Heavy Engineering, FLSmidth, Thermax Group, PPC Industries, Sumitomo Heavy Industries, TAPC, ANDRITZ GROUP, Babcock and Wilcox Enterprises, Wood PLC, KC Cottrell India, Hitachi Power Systems, Enviropol Engineers, and VT Corp. These companies are focused on innovation, developing next-gen ESP systems with enhanced particulate capture efficiency, corrosion-resistant materials, and smart automation features. Strategic partnerships with utility companies and expansion into emerging markets remain critical to their growth strategies.
Table of Contents
Chapter 1 Methodology & Scope
- 1.1 Research design
- 1.2 Base estimates & calculations
- 1.3 Forecast model
- 1.4 Primary research & validation
- 1.4.1 Primary sources
- 1.4.2 Data mining sources
- 1.5 Market definitions
Chapter 2 Executive Summary
- 2.1 Industry synopsis, 2021 – 2034
Chapter 3 Industry Insights
- 3.1 Industry ecosystem
- 3.2 Regulatory landscape
- 3.3 Industry impact forces
- 3.3.1 Growth drivers
- 3.3.2 Industry pitfalls & challenges
- 3.4 Growth potential analysis
- 3.5 Porter's analysis
- 3.5.1 Bargaining power of suppliers
- 3.5.2 Bargaining power of buyers
- 3.5.3 Threat of new entrants
- 3.5.4 Threat of substitutes
- 3.6 PESTEL analysis
Chapter 4 Competitive landscape, 2024
- 4.1 Introduction
- 4.2 Strategic dashboard
- 4.3 Innovation & technology landscape
Chapter 5 Market Size and Forecast, By Design, 2021 - 2034 (USD Million)
- 5.1 Key trends
- 5.2 Plate
- 5.3 Tubular
Chapter 6 Market Size and Forecast, By System, 2021 - 2034 (USD Million)
- 6.1 Key trends
- 6.2 Dry
- 6.3 Wet
Chapter 7 Market Size and Forecast, By Region, 2021 - 2034 (USD Million)
- 7.1 Key trends
- 7.2 North America
- 7.2.1 U.S.
- 7.2.2 Canada
- 7.2.3 Mexico
- 7.3 Europe
- 7.3.1 Germany
- 7.3.2 UK
- 7.3.3 France
- 7.3.4 Spain
- 7.3.5 Italy
- 7.3.6 Netherlands
- 7.4 Asia Pacific
- 7.4.1 China
- 7.4.2 India
- 7.4.3 Japan
- 7.4.4 South Korea
- 7.4.5 Indonesia
- 7.4.6 Australia
- 7.5 Middle East & Africa
- 7.5.1 Saudi Arabia
- 7.5.2 UAE
- 7.5.3 South Africa
- 7.5.4 Nigeria
- 7.5.5 Angola
- 7.6 Latin America
- 7.6.1 Brazil
- 7.6.2 Argentina
- 7.6.3 Chile
- 7.6.4 Peru
Chapter 8 Company Profiles
- 8.1 ANDRITZ GROUP
- 8.2 Babcock and Wilcox Enterprises
- 8.3 Enviropol Engineers
- 8.4 FLSmidth
- 8.5 Hitachi Power Systems
- 8.6 Isgec Heavy Engineering
- 8.7 KC Cottrell India
- 8.8 PPC Industries
- 8.9 Sumitomo Heavy Industries
- 8.10 Thermax Group
- 8.11 TAPC
- 8.12 VT Corp
- 8.13 Wood PLC