|
시장보고서
상품코드
1773219
화학제품 및 석유화학제품 전기 집진 장비 시장 기회, 성장 촉진요인, 산업 동향 분석 및 예측(2025-2034년)Chemicals and Petrochemicals Electrostatic Precipitator Market Opportunity, Growth Drivers, Industry Trend Analysis, and Forecast 2025 - 2034 |
||||||
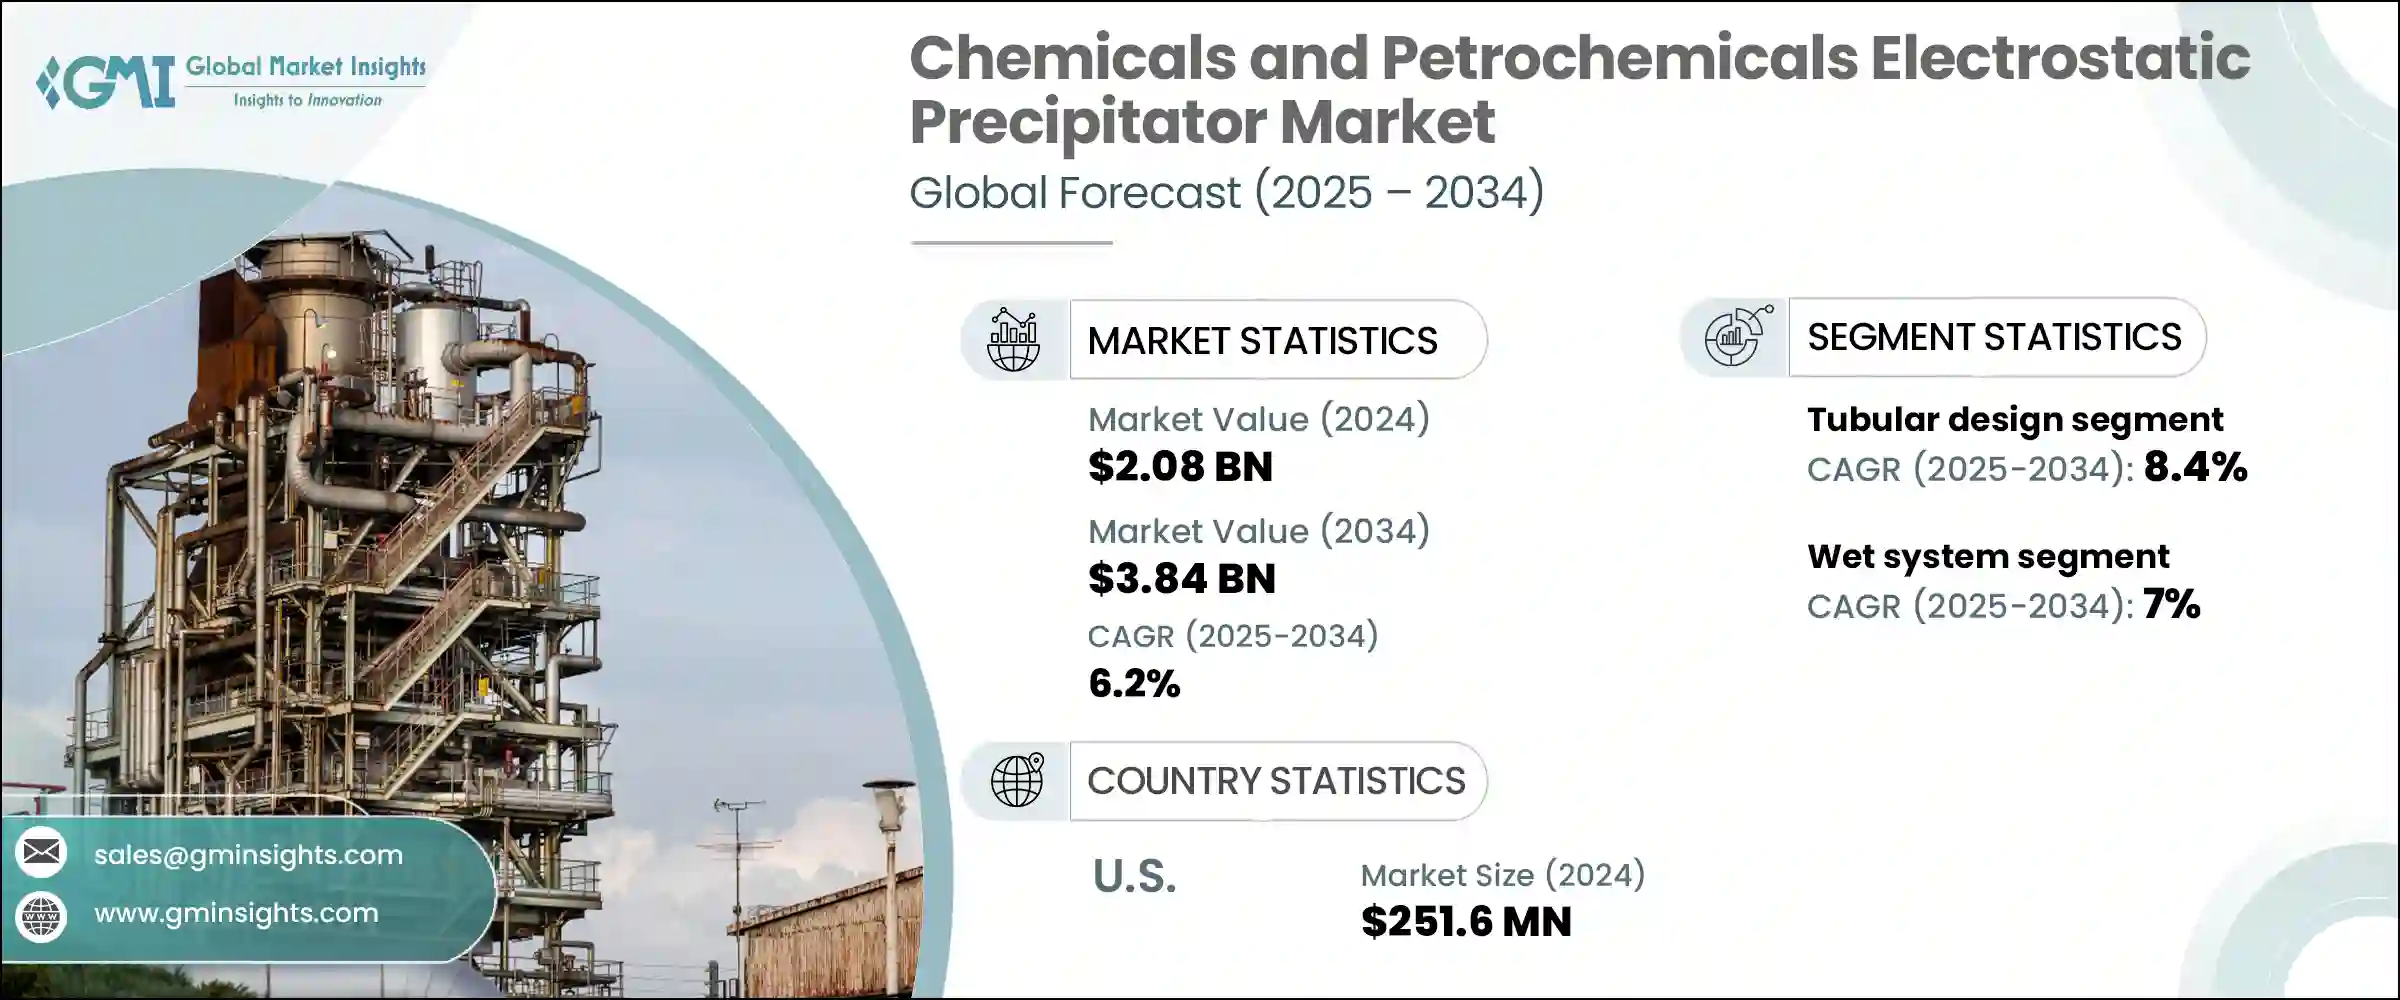
세계의 화학제품 및 석유화학제품 전기 집진 장비 시장은 2024년에 20억 8,000만 달러로 평가되었고, CAGR 6.2%로 성장하여 2034년에는 38억 4,000만 달러에 이를 것으로 추정되고 있습니다.
미립자 물질을 포집하는 동시에 귀중한 제품 별을 회수할 수 있는 시스템의 활용이 확대되고 있기 때문에 수요가 가속화되고 있습니다. 이러한 제품별은 생산 주기에 재통합되어 전체 공정 효율과 재활용 노력을 향상시킬 수 있습니다. 기존 정유소 운영에 석유화학 처리 능력이 추가됨에 따라 전기집진장치의 도입이 계속 확대되고 있습니다. 특히 고배출 산업 지역의 대기 질에 대한 인식이 높아지면서 작업장 안전에 대한 우려와 함께 플랜트 사업자들이 첨단 배출가스 제어 시스템에 대한 투자를 늘리고 있습니다. 합성 화학물질의 생산량 증가와 지속 가능한 운영 방법의 추진은 전기집진기를 대용량 장비에 통합하는 것을 더욱 촉진하고 있습니다.
특히 화학 분야 전반에 걸쳐 강화되고 있는 환경 규제는 선진국과 신흥국 모두에서 제품 채택을 가속화하고 있습니다. 특히 유해 오염 물질에 대한 규제가 강화됨에 따라 청정 생산 기술의 사용은 전 세계 모든 시설에서 최우선 과제가 될 것으로 보입니다. 산업계 운영자들은 환경 규제를 준수할 뿐만 아니라 에너지 효율과 업무 생산성을 향상시킬 수 있는 배출가스 저감 솔루션을 점점 더 우선순위에 두고 있습니다. 이러한 관심은 탈황, 미립자 제거, 실시간 배출 모니터링 등 여러 기능이 결합된 통합 대기오염제어 시스템으로의 전환을 촉진하고 있습니다.
| 시장 범위 | |
|---|---|
| 개시 연도 | 2024년 |
| 예측 연도 | 2025-2034년 |
| 개시 금액 | 20억 8,000만 달러 |
| 예측 금액 | 38억 4,000만 달러 |
| CAGR | 6.2% |
플레이트형 전기 집진기는 높은 제거 효율과 대규모 처리 플랜트의 건조 가스 흐름 처리에 적합하기 때문에 2034년까지 32억 달러에 달할 것으로 예측됩니다. 이러한 시스템은 연속 작동에 적합하고 고처리량 산업 환경에서 유지 보수가 용이하여 선호되고 있습니다. 다양한 화학 제조 현장의 배기가스 처리 시스템의 지속적인 업그레이드로 인해 플레이트형 전기 집진기 설치가 지속적으로 추진될 것입니다.
건식 전기집진 시스템 부문은 2024년 86.6%의 점유율을 차지했습니다. 이러한 우위는 비용 효율적인 설계, 50℃-450℃ 범위의 배기가스 온도 관리 능력, 강력한 집진 효율에 기인합니다. 산업계가 더 깨끗한 배출가스를 우선시하는 가운데, 건식 전기집진기는 낮은 유지보수 필요성과 높은 작동 신뢰성으로 인해 여전히 선호되는 솔루션입니다. 이러한 시스템에서 디지털 제어 및 실시간 모니터링 기술의 사용이 확대되고 있으며, 대규모 산업 배치에 대한 매력이 증가하고 있습니다.
아시아태평양 화학 및 석유화학 전기집진기 시장은 2034년까지 18억 달러에 달할 것으로 예측됩니다. 성장 촉진요인으로는 급속한 산업 발전, 대기 오염에 대한 사회적 관심 증가, 주요 국가의 배출 기준 강화 등을 들 수 있습니다. 환경 규제 준수에 대한 투자가 증가함에 따라 이 지역 국가들은 기존 화학 및 석유화학 시설과 신규 화학 및 석유화학 시설 모두에 첨단 ESP 기술 설치를 우선순위에 두고 있습니다.
화학 및 석유화학 전기집진기 시장 경쟁 구도에 기여하는 주요 기업으로는 HIMENVIRO,Wood,Enviropol Engineers,Valmet,ELEX,Babcock &Wilcox,ANDRITZ GROUP,GEA Group,Alstom, FLSmidth,KC Cottrell India,PPC Austria Holding,Isgec Heavy Engineering,Thermax Group 등입니다. 화학 및 석유화학 전기집진기 시장의 주요 기업들은 포집 효율 향상, 에너지 최적화, 유지보수 비용 절감에 중점을 둔 연구개발에 투자함으로써 존재감을 높이고 있습니다. 많은 기업들이 석유화학업체 및 화학업체와 전략적 제휴를 맺고 장기 계약을 체결하고 있습니다. 또한, 현지 생산과 서비스 지원을 통해 아시아태평양과 같은 급성장 지역에서도 사업을 확장하고 있습니다. 또한, 디지털 모니터링 시스템과 AI 기반 진단을 집진 장치에 통합함으로써 기업은 예지보전 솔루션을 제공하고 중단 없는 성능을 보장할 수 있습니다.
목차
제1장 조사 방법과 범위
제2장 주요 요약
제3장 업계 인사이트
- 업계 에코시스템
- 규제 상황
- 업계에 대한 영향요인
- 성장 촉진요인
- 업계의 잠재적 리스크&과제
- 성장 가능성 분석
- Porter's Five Forces 분석
- PESTEL 분석
제4장 경쟁 구도
- 서론
- 기업의 시장 점유율
- 전략적 대시보드
- 전략적 이니셔티브
- 경쟁 벤치마킹
- 혁신과 지속가능성 상황
제5장 시장 규모와 예측 : 디자인별, 2021년-2034년
- 주요 동향
- 플레이트
- 튜브
제6장 시장 규모와 예측 : 시스템별, 2021년-2034년
- 주요 동향
- 드라이
- 웨트
제7장 시장 규모와 예측 : 지역별, 2021년-2034년
- 주요 동향
- 북미
- 미국
- 캐나다
- 멕시코
- 유럽
- 독일
- 영국
- 프랑스
- 스페인
- 이탈리아
- 네덜란드
- 아시아태평양
- 중국
- 인도
- 일본
- 한국
- 인도네시아
- 호주
- 중동 및 아프리카
- 사우디아라비아
- 아랍에미리트(UAE)
- 남아프리카공화국
- 나이지리아
- 앙골라
- 라틴아메리카
- 브라질
- 아르헨티나
- 칠레
- 페루
제8장 기업 개요
- ANDRITZ GROUP
- Alstom
- Babcock &Wilcox
- Enviropol Engineers
- ELEX
- FLSmidth
- GEA Group
- HIMENVIRO
- Isgec Heavy Engineering
- KC Cottrell India
- PPC Austria Holding
- Thermax Group
- Valmet
- Wood
The Global Chemicals and Petrochemicals Electrostatic Precipitator Market was valued at USD 2.08 billion in 2024 and is estimated to grow at a CAGR of 6.2% to reach USD 3.84 billion by 2034. Demand is accelerating due to the growing use of systems capable of capturing particulate matter while simultaneously recovering valuable by-products. These by-products can be reintegrated into the production cycle, boosting overall process efficiency and recycling efforts. The addition of petrochemical processing capacity alongside existing refinery operations continues to support the expansion of electrostatic precipitator deployments. Greater awareness of air quality, especially in high-emission industrial zones, along with workplace safety concerns, is pushing plant operators to invest in advanced emissions control systems. Increasing synthetic chemical output and the push for sustainable operational practices are further fueling the integration of electrostatic precipitators in large-capacity units.

Tighter environmental compliance rules, particularly across the chemicals sector, are also accelerating product adoption in both mature and developing economies. With regulations becoming more rigorous, particularly for hazardous pollutants, the use of cleaner production technologies will remain a top priority across global facilities. Industrial operators are increasingly prioritizing emission-reduction solutions that not only meet environmental compliance but also enhance energy efficiency and operational productivity. This growing emphasis is prompting a widespread shift toward integrated air pollution control systems that combine multiple functions such as desulfurization, particulate removal, and real-time emissions monitoring.
| Market Scope | |
|---|---|
| Start Year | 2024 |
| Forecast Year | 2025-2034 |
| Start Value | $2.08 Billion |
| Forecast Value | $3.84 Billion |
| CAGR | 6.2% |
The plate-type electrostatic precipitator segment is expected to reach USD 3.2 billion by 2034, driven by its high removal efficiency and suitability for handling dry gas streams in large processing plants. These systems are favored for their compatibility with continuous operations and ease of maintenance in high-throughput industrial environments. Ongoing upgrades to flue gas treatment systems across various chemical manufacturing sites will continue to drive the installation of plate-type ESPs.
Dry electrostatic precipitator systems segment accounted for 86.6% in 2024. This dominance is attributed to their cost-effective design, ability to manage flue gas temperatures ranging between 50°C and 450°C, and strong collection efficiency. As industries prioritize cleaner emissions, dry ESPs remain the preferred solution due to low maintenance needs and operational reliability. The growing use of digital controls and real-time monitoring technology in these systems is enhancing their appeal for large-scale industrial deployment.
Asia Pacific Chemicals and Petrochemicals Electrostatic Precipitator Market is expected to reach USD 1.8 billion by 2034. Factors driving growth include rapid industrial development, heightened public concern over air pollution, and stricter enforcement of emission standards across key countries. As investments in environmental compliance increase, countries across the region are prioritizing the installation of advanced ESP technologies in both existing and newly built chemical and petrochemical facilities.
Key players contributing to the competitive landscape of the Chemicals and Petrochemicals Electrostatic Precipitator Market include HIMENVIRO, Wood, Enviropol Engineers, Valmet, ELEX, Babcock & Wilcox, ANDRITZ GROUP, GEA Group, Alstom, FLSmidth, KC Cottrell India, PPC Austria Holding, Isgec Heavy Engineering, Thermax Group, and the Thermax Group. Leading companies in the chemicals and petrochemicals electrostatic precipitator market are strengthening their presence by investing in R&D focused on improving capture efficiency, energy optimization, and reducing maintenance costs. Many firms are forming strategic alliances with petrochemical and chemical manufacturers to secure long-term contracts. Businesses are also expanding their footprints in fast-growing regions like Asia Pacific through localized manufacturing and service support. Additionally, integrating digital monitoring systems and AI-driven diagnostics into precipitator units allows companies to offer predictive maintenance solutions, ensuring uninterrupted performance.
Table of Contents
Chapter 1 Methodology & Scope
- 1.1 Research design
- 1.2 Base estimates & calculations
- 1.3 Forecast calculation
- 1.4 Primary research & validation
- 1.4.1 Primary sources
- 1.4.2 Data mining sources
- 1.5 Market definitions
Chapter 2 Executive Summary
- 2.1 Industry synopsis, 2021 - 2034
Chapter 3 Industry Insights
- 3.1 Industry ecosystem
- 3.2 Regulatory landscape
- 3.3 Industry impact forces
- 3.3.1 Growth drivers
- 3.3.2 Industry pitfalls & challenges
- 3.4 Growth potential analysis
- 3.5 Porter's analysis
- 3.5.1 Bargaining power of suppliers
- 3.5.2 Bargaining power of buyers
- 3.5.3 Threat of new entrants
- 3.5.4 Threat of substitutes
- 3.6 PESTEL analysis
Chapter 4 Competitive landscape, 2024
- 4.1 Introduction
- 4.2 Company market share
- 4.3 Strategic dashboard
- 4.4 Strategic initiative
- 4.5 Competitive benchmarking
- 4.6 Innovation & sustainability landscape
Chapter 5 Market Size and Forecast, By Design, 2021 - 2034 (USD Million)
- 5.1 Key trends
- 5.2 Plate
- 5.3 Tubular
Chapter 6 Market Size and Forecast, By System, 2021 - 2034 (USD Million)
- 6.1 Key trends
- 6.2 Dry
- 6.3 Wet
Chapter 7 Market Size and Forecast, By Region, 2021 - 2034 (USD Million)
- 7.1 Key trends
- 7.2 North America
- 7.2.1 U.S.
- 7.2.2 Canada
- 7.2.3 Mexico
- 7.3 Europe
- 7.3.1 Germany
- 7.3.2 UK
- 7.3.3 France
- 7.3.4 Spain
- 7.3.5 Italy
- 7.3.6 Netherlands
- 7.4 Asia Pacific
- 7.4.1 China
- 7.4.2 India
- 7.4.3 Japan
- 7.4.4 South Korea
- 7.4.5 Indonesia
- 7.4.6 Australia
- 7.5 Middle East & Africa
- 7.5.1 Saudi Arabia
- 7.5.2 UAE
- 7.5.3 South Africa
- 7.5.4 Nigeria
- 7.5.5 Angola
- 7.6 Latin America
- 7.6.1 Brazil
- 7.6.2 Argentina
- 7.6.3 Chile
- 7.6.4 Peru
Chapter 8 Company Profiles
- 8.1 ANDRITZ GROUP
- 8.2 Alstom
- 8.3 Babcock & Wilcox
- 8.4 Enviropol Engineers
- 8.5 ELEX
- 8.6 FLSmidth
- 8.7 GEA Group
- 8.8 HIMENVIRO
- 8.9 Isgec Heavy Engineering
- 8.10 KC Cottrell India
- 8.11 PPC Austria Holding
- 8.12 Thermax Group
- 8.13 Valmet
- 8.14 Wood