|
시장보고서
상품코드
1665075
상업선박용 선택식 촉매 환원 시스템 시장 기회, 성장 촉진요인, 산업 동향 분석 및 예측(2025-2034년)Commercial Marine Selective Catalytic Reduction Systems Market Opportunity, Growth Drivers, Industry Trend Analysis, and Forecast 2025 - 2034 |
||||||
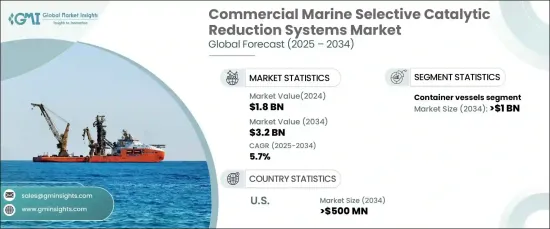
세계의 상업선박용 선택식 촉매 환원 시스템 시장은 2024년에 18억 달러의 평가액을 달성했으며 2025년부터 2034년까지 연평균 복합 성장률(CAGR) 5.7%로 성장할 것으로 예측됩니다.
이러한 시스템은 선박용 엔진에서 배출되는 질소산화물(NOx)을 극적으로 줄이기 위해 설계된 배출가스 제어기술에서 중요한 혁신입니다. 요소 기반 용액을 배기 스트림에 도입함으로써 선택식 촉매 환원 시스템은 촉매 상에서 화학 반응을 일으켜 유해한 NOx 가스를 무해한 질소 및 수증기로 전환시킵니다. 이 첨단 기술은 IMO의 Tier III 규정과 같은 엄격한 환경 기준에 대한 적합성을 보장할 뿐만 아니라 지속 가능한 해양 사업을 추진하는 광범위한 움직임에도 부합합니다. 환경에 배려한 선박운항이 중시되고 보다 대형이고 연료효율이 높은 선박의 생산이 증가하는 가운데 선택식 촉매 환원 시스템 수요는 세계적으로 높아지고 있습니다.

선박용 선택식 촉매 환원 시스템은 운항 효율 목표와 규제 요건을 모두 충족하는 데 있어서 매우 중요한 역할을 하기 때문에 화물선, 유조선, 벌크선, 롤온/롤오프선 등 다양한 유형의 선박에서 널리 채용되고 있습니다. 세계 무역이 계속 확대되고 있는 가운데, 해운에서 선진적인 배기가스 규제 솔루션의 필요성이 높아지고 있으며, 시장은 강력한 성장을 이루고 있습니다. 연료비 상승은 사업자들에게 연료 소비 최적화를 더욱 강력하게 하고, 배출 감축 시스템의 채용을 간접적으로 뒷받침하고 있습니다. 규제기관과 업계의 이해관계자가 배출가스규제의 국제수역으로의 확대에 대해 논의하는 가운데, 선택식 촉매 환원 기술의 채용에 대한 주목이 높아지고 있습니다. 이러한 시스템은 규정 준수를 강화할 뿐만 아니라 보다 깨끗한 해운 관행을 지원함으로써 업계의 장기적인 지속가능성에 대한 노력에도 기여하고 있습니다.
| 시장 범위 | |
|---|---|
| 시작 연도 | 2024년 |
| 예측 연도 | 2025-2034년 |
| 시작 금액 | 18억 달러 |
| 예측 금액 | 32억 달러 |
| CAGR | 5.7% |
시장 내 컨테이너선 부문은 컨테이너 무역의 급증과 더 큰 규모의 고성능 선박 건설을 반영하여 2034년까지 10억 달러를 창출할 것으로 예상됩니다. 환경 친화적 인 운송 방법을 촉진하는 인센티브는 운영자에게 선택식 촉매 환원 시스템의 도입을 더욱 촉구합니다. 이러한 이니셔티브는 해운 산업의 환경에 미치는 영향을 줄이고 지속 가능한 무역 경로를 육성하기 위한 세계의 노력과 일치합니다.
미국에서는 선박용 선택식 촉매 환원 시스템 시장이 2034년까지 5억 달러에 달할 것으로 예측되고 있으며 이는 배출량 감축을 목적으로 한 대상을 좁힌 인센티브 프로그램에 의한 것입니다. 클린 에너지 이니셔티브 하에서 제공되는 경우가 많고, 낡은 선박을 선진적인 배출 기술로 개조하기 위한 재정 지원은 채용의 주요한 추진력이 되고 있습니다. 녹색운송회랑과 기타 기후 변화에 초점을 맞춘 전략의 구현은 선택식 촉매 환원 시스템의 도입을 더욱 가속할 것으로 예상됩니다. 또한 동해안과 서해안의 미국항만은 제로에미션 정책을 진행하고 있어 선택식 촉매 환원 기술을 탑재한 선박의 정박료 감액과 우선처리 등의 특전을 제공합니다. 이러한 이니셔티브는 배기가스 규제 솔루션의 리더로서 지속가능한 해양 관행의 추진에 대한 헌신으로 이 지역이 주목받고 있음을 강조합니다.
목차
제1장 조사 방법과 조사 범위
- 조사 디자인
- 기본 추정과 계산
- 예측 모델
- 1차 조사와 검증
- 1차 정보
- 데이터 마이닝 소스
- 시장의 정의
제2장 주요 요약
제3장 업계 인사이트
- 업계 에코시스템
- 규제 상황
- 업계에 미치는 영향요인
- 성장 촉진요인
- 업계의 잠재적 위험 및 과제
- 성장 가능성 분석
- Porter's Five Forces 분석
- 공급기업의 협상력
- 구매자의 협상력
- 신규 참가업체의 위협
- 대체품의 위협
- PESTEL 분석
제4장 경쟁 구도
- 서론
- 전략 대시보드
- 혁신과 기술의 전망
제5장 시장 규모와 예측 : 용도별(2021-2034년), 10억 달러
- 주요 동향
- 컨테이너선
- 유조선
- 벌크선
- 롤온/롤오프
- 기타
제6장 시장 규모와 예측 : 지역별(2021-2034년), 10억 달러
- 주요 동향
- 북미
- 미국
- 캐나다
- 유럽
- 독일
- 영국
- 이탈리아
- 노르웨이
- 프랑스
- 러시아
- 덴마크
- 아시아태평양
- 중국
- 일본
- 인도
- 한국
- 호주
- 베트남
- 중동 및 아프리카
- 사우디아라비아
- 아랍에미리트(UAE)
- 남아프리카
- 앙골라
- 라틴아메리카
- 브라질
- 아르헨티나
- 멕시코
제7장 기업 프로파일
- Ceco Environmental
- DEC Marine
- HH Engineering &Service
- Hitachi Zosen Corporation
- Kwang Sung
- Lindenberg-Anlagen
- Mitsubishi Heavy Industries
- MAN Energy Solutions
- Nett Technologies
- Wartsila
- Yara International
The Global Commercial Marine Selective Catalytic Reduction Systems Market achieved a valuation of USD 1.8 billion in 2024 and is anticipated to grow at a CAGR of 5.7% from 2025 to 2034. These systems represent a critical innovation in emission control technology, designed to dramatically reduce nitrogen oxide (NOx) emissions from marine engines. By introducing a urea-based solution into exhaust streams, SCR systems trigger a chemical reaction over a catalyst, converting harmful NOx gases into harmless nitrogen and water vapor. This advanced technology not only ensures compliance with stringent environmental standards like the IMO Tier III regulations but also aligns with the broader push for sustainable marine operations. With the growing emphasis on eco-friendly shipping practices and the increasing production of larger, more fuel-efficient vessels, the demand for SCR systems is rising across the globe.
Marine SCR systems are widely adopted by various types of vessels, including cargo ships, tankers, bulk carriers, and roll-on/roll-off ships, as they play a pivotal role in meeting both operational efficiency goals and regulatory requirements. The market is poised for robust growth as global trade continues to expand, driven by the need for advanced emission-control solutions in shipping. Rising fuel costs further compel operators to optimize fuel consumption, indirectly bolstering the adoption of emission-reduction systems. As regulatory bodies and industry stakeholders discuss extending emission regulations to international waters, the focus on adopting SCR technologies is intensifying. These systems not only enhance compliance but also contribute to the industry's long-term sustainability efforts by supporting cleaner shipping practices.
| Market Scope | |
|---|---|
| Start Year | 2024 |
| Forecast Year | 2025-2034 |
| Start Value | $1.8 Billion |
| Forecast Value | $3.2 Billion |
| CAGR | 5.7% |
The container vessel segment within the market is projected to generate USD 1 billion by 2034, reflecting the surge in containerized trade and the construction of larger, more advanced ships. Incentives promoting environmentally friendly shipping methods are further encouraging operators to implement SCR systems. Such initiatives align with global efforts to reduce the maritime industry's environmental impact and foster sustainable trade routes.
In the United States, the marine SCR systems market is forecasted to reach USD 500 million by 2034, fueled by targeted incentive programs aimed at reducing emissions. Financial support for retrofitting older vessels with advanced emission technologies, often provided under clean energy initiatives, has been a key driver of adoption. The implementation of green shipping corridors and other climate-focused strategies is expected to further accelerate the deployment of SCR systems. Additionally, U.S. ports on the East and West Coasts are advancing zero-emission policies, offering benefits such as reduced docking fees and priority processing for vessels equipped with SCR technologies. These initiatives underscore the region's growing prominence as a leader in emission-control solutions and its commitment to advancing sustainable maritime practices.
Table of Contents
Chapter 1 Methodology & Scope
- 1.1 Research design
- 1.2 Base estimates & calculations
- 1.3 Forecast model
- 1.4 Primary research & validation
- 1.4.1 Primary sources
- 1.4.2 Data mining sources
- 1.5 Market Definitions
Chapter 2 Executive Summary
- 2.1 Industry synopsis, 2021 – 2034
Chapter 3 Industry Insights
- 3.1 Industry ecosystem
- 3.2 Regulatory landscape
- 3.3 Industry impact forces
- 3.3.1 Growth drivers
- 3.3.2 Industry pitfalls & challenges
- 3.4 Growth potential analysis
- 3.5 Porter's analysis
- 3.5.1 Bargaining power of suppliers
- 3.5.2 Bargaining power of buyers
- 3.5.3 Threat of new entrants
- 3.5.4 Threat of substitutes
- 3.6 PESTEL analysis
Chapter 4 Competitive landscape, 2024
- 4.1 Introduction
- 4.2 Strategic dashboard
- 4.3 Innovation & technology landscape
Chapter 5 Market Size and Forecast, By Application, 2021 – 2034 (USD Billion & Units)
- 5.1 Key trends
- 5.2 Container vessels
- 5.3 Tankers
- 5.4 Bulk carriers
- 5.5 Roll On/Roll Off
- 5.6 Others
Chapter 6 Market Size and Forecast, By Region, 2021 – 2034 (USD Billion & Units)
- 6.1 Key trends
- 6.2 North America
- 6.2.1 U.S.
- 6.2.2 Canada
- 6.3 Europe
- 6.3.1 Germany
- 6.3.2 UK
- 6.3.3 Italy
- 6.3.4 Norway
- 6.3.5 France
- 6.3.6 Russia
- 6.3.7 Denmark
- 6.4 Asia Pacific
- 6.4.1 China
- 6.4.2 Japan
- 6.4.3 India
- 6.4.4 South Korea
- 6.4.5 Australia
- 6.4.6 Vietnam
- 6.5 Middle East & Africa
- 6.5.1 Saudi Arabia
- 6.5.2 UAE
- 6.5.3 South Africa
- 6.5.4 Angola
- 6.6 Latin America
- 6.6.1 Brazil
- 6.6.2 Argentina
- 6.6.3 Mexico
Chapter 7 Company Profiles
- 7.1 Ceco Environmental
- 7.2 DEC Marine
- 7.3 H+H Engineering & Service
- 7.4 Hitachi Zosen Corporation
- 7.5 Kwang Sung
- 7.6 Lindenberg-Anlagen
- 7.7 Mitsubishi Heavy Industries
- 7.8 MAN Energy Solutions
- 7.9 Nett Technologies
- 7.10 Wartsila
- 7.11 Yara International