|
시장보고서
상품코드
1665256
분광학 소프트웨어 시장 : 기회, 성장 촉진요인, 산업 동향 분석, 예측(2025-2034년)Spectroscopy Software Market Opportunity, Growth Drivers, Industry Trend Analysis, and Forecast 2025 - 2034 |
||||||
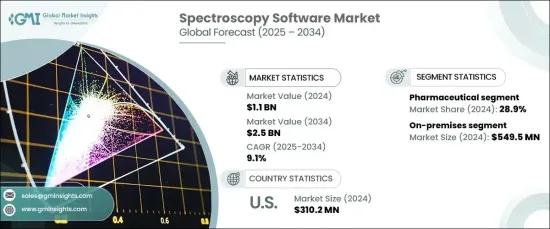
세계 분광학 소프트웨어 시장은 2024년 11억 달러로 평가되었으며 2025-2034년까지 CAGR 9.1%로 눈부신 성장이 예측되고 있습니다.
분광학 소프트웨어는 분광계와의 협력에서 중요한 역할을 하며, 광범위한 응용 분야에서 스펙트럼 데이터의 효율적인 수집, 분석 및 해석을 촉진합니다. 이 소프트웨어는 정밀하고 정확한 측정에 의존하는 산업에 필수적이며 다양한 부문에서 매우 중요한 도구입니다.

시장은 배포 유형별로 온프레미스 및 클라우드 솔루션으로 나뉩니다. 2024년에는 온프레미스가 시장을 선도해 5억 4,950만 달러의 수익을 창출했으며, 예측 기간 동안에도 견조한 성장이 예상됩니다. 온프레미스 솔루션은 산업 규제 준수에 필수적인 민감한 데이터 관리 강화를 필요로 하는 조직에 특히 지지됩니다. 의료 및 제약과 같은 데이터 보안이 가장 중요하게 여겨지는 산업에서는 온프레미스의 도입 모델이 강하게 지지되고 있습니다. 이러한 솔루션은 정보에 필요한 보안과 통제를 보장하고 엄격한 규제 기준을 충족하는 데 필수적입니다.
| 시장 범위 | |
|---|---|
| 시작 연도 | 2024년 |
| 예측 연도 | 2025-2034년 |
| 시작 금액 | 11억 달러 |
| 예측 금액 | 25억 달러 |
| CAGR | 9.1% |
용도별로 시장은 식품 검사, 환경 검사, 법의학, 의약품 및 기타 부문으로 구분됩니다. 제약산업은 2024년 시장 점유율의 28.9%를 차지했으며 향후 수년간 대폭적인 성장이 예상됩니다. 의약품 개발에 있어서 정밀하고 고품질의 표준물질에 대한 요구 증가와 규제 요건의 강화가 분광법 소프트웨어의 채용 확대를 뒷받침하고 있습니다. 또한, 의약품에서 고성능 스크리닝의 요구가 증가함에 따라 이러한 소프트웨어 솔루션의 사용에 박차를 가하고 있습니다. R&D는 대규모 데이터세트 관리, 워크플로우 합리화, 의약품 개발 및 임상 검사에서 연구 결과의 가속화를 위해 점점 분광학 소프트웨어에 의존하고 있습니다.
미국에서 분광학 소프트웨어 시장은 2024년 3억 1,020만 달러를 창출했습니다. 미국은 분광법 소프트웨어의 선도적인 개발 기업 및 장비 제조업체의 본거지이며 세계 시장에서 압도적인 힘을 유지하고 있습니다. 미국 연구소에서는 첨단 분석 기술이 널리 채택되고 있으며, 의약품 및 식품 안전과 같은 산업의 엄격한 규제 환경과 함께 최첨단 분광법 소프트웨어 솔루션에 대한 수요가 계속 증가하고 있습니다. 이러한 요인은 지속적인 기술 발전과 함께 미국 시장의 성장을 유지하고 향후 10년간 지속적인 확대에 기여할 것으로 예상됩니다.
목차
제1장 조사 방법과 조사 범위
- 시장 범위와 정의
- 조사 디자인
- 조사 접근
- 데이터 수집 방법
- 기본 추정과 계산
- 기준연도의 산출
- 시장 추정의 주요 동향
- 예측 모델
- 1차 조사와 검증
- 1차 정보
- 데이터 마이닝 소스
제2장 주요 요약
제3장 산업 인사이트
- 생태계 분석
- 산업에 미치는 영향요인
- 성장 촉진요인
- 제약산업에 있어서의 분광법 소프트웨어 수요 증가
- 환경과 식품안전규제
- 기술의 진보
- 학술연구기관에서 R&D 투자 증가
- 산업의 잠재적 리스크 및 과제
- 데이터 보안에 대한 우려
- 성장 촉진요인
- 성장 가능성 분석
- 규제 상황
- 미국
- 유럽
- 기술 동향
- 향후 시장 동향
- 주요 뉴스와 대처
- 갭 분석
- Porter's Five Forces 분석
- PESTEL 분석
제4장 경쟁 구도
- 소개
- 기업 점유율 분석
- 기업 매트릭스 분석
- 주요 시장 진출기업의 경쟁 분석
- 경쟁 포지셔닝 매트릭스
- 전략 대시보드
제5장 시장 추정·예측 : 전개 유형별, 2021-2034년
- 주요 동향
- 온프레미스
- 클라우드
제6장 시장 추정·예측 : 용도별, 2021-2034년
- 주요 동향
- 식품검사
- 환경 검사
- 법의학
- 의약품
- 기타
제7장 시장 추정·예측 : 지역별, 2021-2034년
- 주요 동향
- 북미
- 미국
- 캐나다
- 유럽
- 독일
- 영국
- 프랑스
- 스페인
- 이탈리아
- 네덜란드
- 아시아태평양
- 중국
- 일본
- 인도
- 호주
- 한국
- 라틴아메리카
- 브라질
- 멕시코
- 아르헨티나
- 중동 및 아프리카
- 남아프리카
- 사우디아라비아
- 아랍에미리트(UAE)
제8장 기업 프로파일
- Agilent Technologies
- Advanced Chemistry Development
- Bruker Corporation
- Danaher Corporation
- Genedata
- Lablicate
- Microsaic Systems
- OpenMS
- SCIEX
- Shimadzu Corporation
- SpectralWorks
- Spectrum Software Solutions
- StellarNet
- Thermo Fisher Scientific
- Waters Corporation
The Global Spectroscopy Software Market was valued at USD 1.1 billion in 2024 and is projected to grow at an impressive CAGR of 9.1% from 2025 to 2034. Spectroscopy software plays a crucial role in working with spectrometers, facilitating the efficient collection, analysis, and interpretation of spectral data across a wide range of applications. This software is essential for industries that rely on precise and accurate measurements, making it a pivotal tool in various sectors.
The market is divided by deployment type into on-premises and cloud-based solutions. In 2024, the on-premises segment led the market, generating USD 549.5 million in revenue, and is expected to continue experiencing robust growth throughout the forecast period. On-premises solutions are particularly favored by organizations that require enhanced control over sensitive data, which is critical for compliance with industry regulations. Industries such as healthcare and pharmaceuticals, where data security is paramount, strongly prefer on-premises deployment models. These solutions ensure the necessary security and control over information, making them indispensable in meeting stringent regulatory standards.
| Market Scope | |
|---|---|
| Start Year | 2024 |
| Forecast Year | 2025-2034 |
| Start Value | $1.1 Billion |
| Forecast Value | $2.5 Billion |
| CAGR | 9.1% |
In terms of application, the market is segmented into food testing, environmental testing, forensic science, pharmaceuticals, and other sectors. The pharmaceutical industry accounted for 28.9% of the market share in 2024 and is expected to experience substantial growth in the coming years. The increasing demand for precision and high-quality standards in drug development, along with tightening regulatory requirements, is driving the growing adoption of spectroscopy software. Furthermore, the rising need for high-throughput screening in drug discovery is fueling the use of these software solutions. Researchers are increasingly relying on spectroscopy software to manage large datasets, streamline workflows, and accelerate research outcomes in drug development and clinical testing.
In the United States, the spectroscopy software market generated USD 310.2 million in 2024. The U.S. remains a dominant force in the global market, home to leading developers of spectroscopy software and instrument manufacturers. The widespread adoption of advanced analytical technologies in U.S. laboratories, combined with the strict regulatory environment in industries such as pharmaceuticals and food safety, continues to drive the demand for cutting-edge spectroscopy software solutions. These factors, coupled with ongoing technological advancements, are expected to sustain the growth of the U.S. market and contribute to its continued expansion over the next decade.
Table of Contents
Chapter 1 Methodology & Scope
- 1.1 Market scope & definitions
- 1.2 Research design
- 1.2.1 Research approach
- 1.2.2 Data collection methods
- 1.3 Base estimates & calculations
- 1.3.1 Base year calculation
- 1.3.2 Key trends for market estimation
- 1.4 Forecast model
- 1.5 Primary research and validation
- 1.5.1 Primary sources
- 1.5.2 Data mining sources
Chapter 2 Executive Summary
- 2.1 Industry 3600 synopsis
Chapter 3 Industry Insights
- 3.1 Industry ecosystem analysis
- 3.2 Industry impact forces
- 3.2.1 Growth drivers
- 3.2.1.1 Growing demand of spectroscopy software in pharmaceutical industry
- 3.2.1.2 Environmental and food safety regulations
- 3.2.1.3 Technological advancements
- 3.2.1.4 Rise in research and development investments in academic and research institutions
- 3.2.2 Industry pitfalls & challenges
- 3.2.2.1 Data security concerns
- 3.2.1 Growth drivers
- 3.3 Growth potential analysis
- 3.4 Regulatory landscape
- 3.4.1 U.S.
- 3.4.2 Europe
- 3.5 Technology landscape
- 3.6 Future market trends
- 3.7 Key news and initiatives
- 3.8 Gap analysis
- 3.9 Porter’s analysis
- 3.10 PESTEL analysis
Chapter 4 Competitive Landscape, 2024
- 4.1 Introduction
- 4.2 Company market share analysis
- 4.3 Company matrix analysis
- 4.4 Competitive analysis of major market players
- 4.5 Competitive positioning matrix
- 4.6 Strategy dashboard
Chapter 5 Market Estimates and Forecast, By Deployment Type, 2021 – 2034 ($ Mn)
- 5.1 Key trends
- 5.2 On-premises
- 5.3 Cloud
Chapter 6 Market Estimates and Forecast, By Application, 2021 – 2034 ($ Mn)
- 6.1 Key trends
- 6.2 Food testing
- 6.3 Environmental testing
- 6.4 Forensic science
- 6.5 Pharmaceuticals
- 6.6 Other applications
Chapter 7 Market Estimates and Forecast, By Region, 2021 – 2034 ($ Mn)
- 7.1 Key trends
- 7.2 North America
- 7.2.1 U.S.
- 7.2.2 Canada
- 7.3 Europe
- 7.3.1 Germany
- 7.3.2 UK
- 7.3.3 France
- 7.3.4 Spain
- 7.3.5 Italy
- 7.3.6 Netherlands
- 7.4 Asia Pacific
- 7.4.1 China
- 7.4.2 Japan
- 7.4.3 India
- 7.4.4 Australia
- 7.4.5 South Korea
- 7.5 Latin America
- 7.5.1 Brazil
- 7.5.2 Mexico
- 7.5.3 Argentina
- 7.6 Middle East and Africa
- 7.6.1 South Africa
- 7.6.2 Saudi Arabia
- 7.6.3 UAE
Chapter 8 Company Profiles
- 8.1 Agilent Technologies
- 8.2 Advanced Chemistry Development
- 8.3 Bruker Corporation
- 8.4 Danaher Corporation
- 8.5 Genedata
- 8.6 Lablicate
- 8.7 Microsaic Systems
- 8.8 OpenMS
- 8.9 SCIEX
- 8.10 Shimadzu Corporation
- 8.11 SpectralWorks
- 8.12 Spectrum Software Solutions
- 8.13 StellarNet
- 8.14 Thermo Fisher Scientific
- 8.15 Waters Corporation