
|
시장보고서
상품코드
1666526
정밀 기어박스 기계 시장 기회, 성장 촉진요인, 산업 동향 분석, 예측(2025-2034년)Precision Gearbox Machinery Market Opportunity, Growth Drivers, Industry Trend Analysis, and Forecast 2025 - 2034 |
||||||
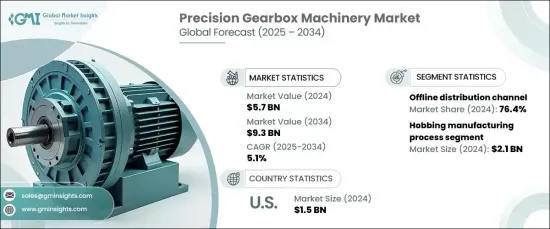
세계의 정밀 기어박스 기계 시장은 2024년에 57억 달러에 달하며, 2025-2034년에 CAGR 5.1%로 확대할 것으로 예측됩니다.
이러한 성장은 자동차, 항공우주, 에너지, 로봇 등 주요 분야에서 고성능 기어 시스템에 대한 수요가 증가하고 있음을 반영합니다. 산업이 기술적으로 계속 발전함에 따라 복잡한 기계의 효율적이고 안정적인 작동을 보장하기 위해 정밀 기어박스 솔루션에 대한 필요성이 급증하고 있습니다. 특히 자동차 및 항공우주 분야에서는 안전과 정밀도가 중요시되면서 까다로운 성능 및 신뢰성 기준을 충족하는 고급 기어박스의 채택이 증가하고 있습니다.

시장은 또한 제조 및 산업 공정에서 자동화 및 로봇 공학의 급속한 도입으로 인해 혜택을 받고 있습니다. 기업은 IoT 및 스마트 센서와 같은 첨단 기술을 기어 시스템에 통합하여 실시간 모니터링, 예지보전, 운영 효율성 향상을 가능하게 하고 있습니다. 이러한 혁신은 변속기를 최적화할 뿐만 아니라 에너지 손실을 줄여 지속가능성 목표도 지원합니다. 에너지 효율과 환경 영향 최소화에 대한 관심이 높아짐에 따라 첨단 기어박스 솔루션의 개발이 더욱 가속화되고 있으며, 현대 산업 운영의 핵심 요소로서의 역할이 강화되고 있습니다.
| 시장 범위 | |
|---|---|
| 시작연도 | 2024년 |
| 예측연도 | 2025-2034년 |
| 시작 금액 | 57억 달러 |
| 예상 금액 | 93억 달러 |
| CAGR | 5.1% |
호빙 가공은 2024년 21억 달러의 기여를 하고 있으며, 향후 10년간 5.5%의 연평균 복합 성장률(CAGR)로 견고한 성장세를 보일 것으로 예상됩니다. 호빙 가공은 고성능 용도에 필수적인 복잡한 형상과 미세한 톱니 모양의 기어를 제조할 수 있는 독보적인 능력으로 인해 업계에서 선호되고 있습니다. 이 제조 기술은 뛰어난 정확성, 일관성, 비용 효율성을 보장하므로 각 산업 분야의 정밀 기어 대량 생산에 적합합니다.
2024년에는 오프라인 유통 채널이 시장 점유율의 76.4%를 차지하며, 예측 기간 중 CAGR 5%로 성장할 것으로 예상됩니다. 오프라인 채널은 개별 서비스, 기술 상담, 직접 대화의 필요성 때문에 여전히 선호되는 선택입니다. 이러한 채널은 특히 자동차, 항공우주, 제조 등 구매 전 기어박스 솔루션의 신뢰성을 확인하기 위해 기술 사양에 대한 현장 평가를 우선시하는 분야에서는 필수적입니다.
미국의 정밀 기어박스 기계 시장은 2024년 15억 달러를 창출하며, 미국의 탄탄한 제조거점과 자동화 및 로봇 공학 분야의 리더십이 그 원동력이 되고 있습니다. 주요 기계 및 장비 제조업체의 본거지인 미국은 지속적인 기술 혁신을 촉진하고 최첨단 기어박스 기술의 안정적인 공급을 보장합니다. 산업 자동화 및 정밀 엔지니어링에 중점을 둔 미국은 고성능 기어 시스템에 대한 수요를 더욱 확대하여 세계 시장 성장에 기여하는 중요한 국가로 자리매김하고 있습니다.
목차
제1장 조사 방법과 조사 범위
- 시장 범위와 정의
- 기본 추정과 계산
- 예측 파라미터
- 데이터 소스
- 1차 데이터
- 2차 데이터
- 유료 정보원
- 공적 정보원
제2장 개요
제3장 업계 인사이트
- 에코시스템 분석
- 밸류체인에 영향을 미치는 요인
- 이익률 분석
- 파괴
- 향후 전망
- 제조업체
- 유통업체
- 소매업체
- 영향요인
- 촉진요인
- 모듈러 주방에 대한 선호도의 증가
- 혁신과 제품 개발
- 정리된 주방에 대한 수요
- 가처분소득의 증가
- 업계의 잠재적 리스크 & 과제
- 저품질 제품의 내구성 우려
- 표준화의 결여
- 촉진요인
- 기술 혁신 상황
- 소비자 구매 행동 분석
- 인구 동향
- 구매 결정에 영향을 미치는 요인
- 소비자의 제품 채택
- 선호 유통 채널
- 성장 가능성 분석
- 규제 상황
- 가격 분석
- Porter의 산업 분석
- PESTEL 분석
제4장 경쟁 구도
- 서론
- 기업 점유율 분석
- 경쟁 포지셔닝 매트릭스
- 전략 전망 매트릭스
제5장 시장 추산·예측 : 제조 프로세스별, 2021-2034년
- 주요 동향
- 호빙
- 연삭가공
- 선반가공
- 호닝
제6장 시장 추산·예측 : 제품별, 2021-2034년
- 주요 동향
- 유성
- 라이트 앵글
- 패러렐
제7장 시장 추산·예측 : 용도별, 2021-2034년
- 주요 동향
- 공작기계
- 자재관리
- 포장
- 로봇
- 자동차
- 오프로드차
- 윈도우 타워
- 농업
- 철도
- 해양
- 기타
제8장 시장 추산·예측 : 유통 채널별, 2021-2034년
- 주요 동향
- 온라인
- E-Commerce 사이트
- 오프라인
- OEM(Original Equipment Manufacturer)
- 전문점/쇼룸
제9장 시장 추산·예측 : 지역별, 2021-2034년
- 주요 동향
- 북미
- 미국
- 캐나다
- 유럽
- 독일
- 영국
- 프랑스
- 이탈리아
- 스페인
- 아시아태평양
- 중국
- 인도
- 일본
- 한국
- 호주
- 말레이시아
- 인도네시아
- 라틴아메리카
- 브라질
- 멕시코
- 중동 및 아프리카
- 사우디아라비아
- UAE
- 남아프리카공화국
제10장 기업 개요
- DANOBAT
- DMG MORI
- DVS Technology Group
- EMAG
- Gleason Corporation
- Lagun Engineering
- Liebherr-International Deutschland
- Matrix Precision
- Nidec
- Reishauer
- Samputensili Cutting Tools
- J.G. WEISSER SOHNE
- Starrag Group
The Global Precision Gearbox Machinery Market reached USD 5.7 billion in 2024 and is projected to expand at a CAGR of 5.1% from 2025 to 2034. This growth reflects the rising demand for high-performance gear systems across key sectors, including automotive, aerospace, energy, and robotics. As industries continue to advance technologically, the need for precision gearbox solutions has surged to ensure the efficient and reliable operation of complex machinery. In particular, the automotive and aerospace sectors emphasize safety and accuracy, driving the adoption of advanced gearboxes that meet stringent performance and reliability standards.
The market is also benefiting from the rapid adoption of automation and robotics in manufacturing and industrial processes. Businesses are integrating cutting-edge technologies such as IoT and smart sensors into gear systems to enable real-time monitoring, predictive maintenance, and enhanced operational efficiency. These innovations not only optimize power transmission but also support sustainability goals by reducing energy losses. The growing focus on energy efficiency and minimizing environmental impact further fuels the development of advanced gearbox solutions, reinforcing their role as a cornerstone of modern industrial operations.
| Market Scope | |
|---|---|
| Start Year | 2024 |
| Forecast Year | 2025-2034 |
| Start Value | $5.7 Billion |
| Forecast Value | $9.3 Billion |
| CAGR | 5.1% |
The hobbing manufacturing process contributed USD 2.1 billion in 2024 and is forecasted to grow at a robust CAGR of 5.5% during the next decade. Industries favor hobbing for its unparalleled ability to produce gears with intricate shapes and fine-tooth profiles, which are essential for high-performance applications. This manufacturing technique ensures exceptional accuracy, consistency, and cost efficiency, making it the go-to choice for large-scale production of precision gears across industries.
In 2024, offline distribution channels accounted for 76.4% of the market share and are projected to grow at a CAGR of 5% over the forecast period. Offline channels remain a preferred choice due to the need for personalized service, technical consultations, and direct interactions. These channels are particularly vital for sectors such as automotive, aerospace, and manufacturing, where businesses prioritize hands-on evaluations of technical specifications to ensure the reliability of gearbox solutions before purchase.
The US precision gearbox machinery market generated USD 1.5 billion in 2024, driven by the country's robust manufacturing base and leadership in automation and robotics. Home to leading machinery and equipment manufacturers, the US fosters continuous innovation and ensures a steady supply of cutting-edge gearbox technologies. The nation's focus on industrial automation and precision engineering further amplifies the demand for high-performance gear systems, solidifying its position as a key contributor to global market growth.
Table of Contents
Chapter 1 Methodology & Scope
- 1.1 Market scope & definition
- 1.2 Base estimates & calculations
- 1.3 Forecast parameters
- 1.4 Data sources
- 1.4.1 Primary
- 1.4.2 Secondary
- 1.4.2.1 Paid sources
- 1.4.2.2 Public sources
Chapter 2 Executive Summary
- 2.1 Industry 3600 synopsis, 2021 - 2034
Chapter 3 Industry Insights
- 3.1 Industry ecosystem analysis
- 3.1.1 Factors affecting the value chain
- 3.1.2 Profit margin analysis
- 3.1.3 Disruptions
- 3.1.4 Future outlook
- 3.1.5 Manufacturers
- 3.1.6 Distributors
- 3.1.7 Retailers
- 3.2 Impact forces
- 3.2.1 Growth drivers
- 3.2.1.1 Growing preference for modular kitchens
- 3.2.1.2 Innovation and product development
- 3.2.1.3 Demand for organized kitchens
- 3.2.1.4 Rise in disposable income
- 3.2.2 Industry pitfalls & challenges
- 3.2.2.1 Durability concerns in low-quality products
- 3.2.2.2 Lack of standardization
- 3.2.1 Growth drivers
- 3.3 Technology & innovation landscape
- 3.4 Consumer buying behavior analysis
- 3.4.1 Demographic trends
- 3.4.2 Factors affecting buying decision
- 3.4.3 Consumer product adoption
- 3.4.4 Preferred distribution channel
- 3.5 Growth potential analysis
- 3.6 Regulatory landscape
- 3.7 Pricing analysis
- 3.8 Porter’s analysis
- 3.9 PESTEL analysis
Chapter 4 Competitive Landscape, 2024
- 4.1 Introduction
- 4.2 Company market share analysis
- 4.3 Competitive positioning matrix
- 4.4 Strategic outlook matrix
Chapter 5 Market Estimates & Forecast, By Manufacturing Process, 2021 – 2034, (USD Billion) (Million Units)
- 5.1 Key trends
- 5.2 Hobbing
- 5.3 Grinding
- 5.4 Turning
- 5.5 Honing
Chapter 6 Market Estimates & Forecast, By Product, 2021 – 2034, (USD Billion) (Million Units)
- 6.1 Key trends
- 6.2 Planetary
- 6.3 Right angle
- 6.4 Parallel
Chapter 7 Market Estimates & Forecast, By Application, 2021 – 2034, (USD Billion) (Million Units)
- 7.1 Key trends
- 7.2 Machine tools
- 7.3 Material handling
- 7.4 Packaging
- 7.5 Robotics
- 7.6 Automobile
- 7.7 Off-road vehicles
- 7.8 Wind towers
- 7.9 Agriculture
- 7.10 Railways
- 7.11 Marine
- 7.12 Others
Chapter 8 Market Estimates & Forecast, By Distribution Channel, 2021 – 2034, (USD Billion) (Million Units)
- 8.1 Key trends
- 8.2 Online
- 8.2.1 E-commerce website
- 8.3 Offline
- 8.3.1 OEM (Original equipment manufacturer)
- 8.3.2 Specialty stores / showrooms
Chapter 9 Market Estimates & Forecast, By Region, 2021 – 2034, (USD Billion) (Million Units)
- 9.1 Key trends
- 9.2 North America
- 9.2.1 U.S.
- 9.2.2 Canada
- 9.3 Europe
- 9.3.1 Germany
- 9.3.2 UK
- 9.3.3 France
- 9.3.4 Italy
- 9.3.5 Spain
- 9.4 Asia Pacific
- 9.4.1 China
- 9.4.2 India
- 9.4.3 Japan
- 9.4.4 South Korea
- 9.4.5 Australia
- 9.4.6 Malaysia
- 9.4.7 Indonesia
- 9.5 Latin America
- 9.5.1 Brazil
- 9.5.2 Mexico
- 9.6 MEA
- 9.6.1 Saudi Arabia
- 9.6.2 UAE
- 9.6.3 South Africa
Chapter 10 Company Profiles (Business Overview, Financial Data, Product Landscape, Strategic Outlook, SWOT Analysis)
- 10.1 DANOBAT
- 10.2 DMG MORI
- 10.3 DVS Technology Group
- 10.4 EMAG
- 10.5 Gleason Corporation
- 10.6 Lagun Engineering
- 10.7 Liebherr-International Deutschland
- 10.8 Matrix Precision
- 10.9 Nidec
- 10.10 Reishauer
- 10.11 Samputensili Cutting Tools
- 10.12 J.G. WEISSER SOHNE
- 10.13 Starrag Group

