|
시장보고서
상품코드
1666959
타이어 열분해 오일 시장 기회, 성장 촉진요인, 산업 동향 분석, 예측(2025-2034년)Tire Pyrolysis Oil Market Opportunity, Growth Drivers, Industry Trend Analysis, and Forecast 2025 - 2034 |
||||||
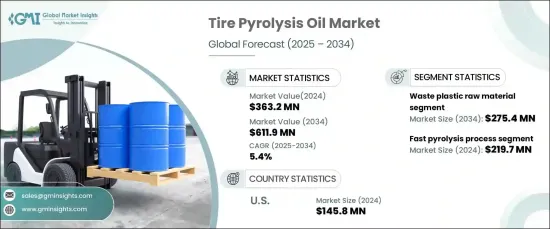
세계 타이어 열분해 오일 시장은 2024년 3억 6,320만 달러로 평가되며 2025년부터 2034년까지 연평균 5.4%로 확대될 것으로 예상됩니다.
이러한 성장에는 지속가능한 대체품에 대한 수요 증가와 폐기물 관리 기술의 지속적인 발전이 기여하고 있습니다. 산업계가 환경 친화적인 관행으로 전환하는 가운데, 폐기물을 열분해하여 얻은 타이어 열분해 오일(TPO)은 이산화탄소 배출을 줄이고 순환 경제를 촉진하기 위한 실행 가능한 솔루션으로 부상하고 있습니다. 세계 각국 정부는 매립 폐기물을 억제하기 위해 엄격한 규제를 도입하고 있으며, 이는 TPO의 채택을 더욱 촉진하고 있습니다. TPO는 기존의 화석연료를 대체할 수 있는 비용 효율적이고 환경 친화적인 오일로서 에너지, 제조, 운송 등의 산업에서 널리 사용되고 있습니다.

폐플라스틱과 폐타이어를 필두로 한 다양한 원료의 통합으로 시장은 강력한 성장세를 보이고 있습니다. 폐플라스틱은 발열량이 높아 TPO 생산의 주요 원료가 되고 있습니다. 이 부문은 2034년까지 2억 7,540만 달러에 달할 것으로 예상되며, 연평균 6.2%의 높은 성장률을 기록할 것으로 예상됩니다. 폐타이어는 환경에 미치는 영향을 최소화하고 매립지에 비생분해성 물질의 축적을 줄이기 위한 재활용 노력의 확산으로 인해 여전히 주요 원료로 사용되고 있습니다. 또한 석유 슬러지, 목재, 산업 잔류물 등의 원료가 열분해 공정에 통합되어 원료의 범위가 넓어지고 생산 효율이 향상되고 있습니다.
| 시장 범위 | |
|---|---|
| 시작 연도 | 2024년 |
| 예측 연도 | 2025-2034년 |
| 시작 금액 | 3억 6,320만 달러 |
| 예상 금액 | 6억 1,190만 달러 |
| CAGR | 5.4% |
고속 열분해가 기술 전망을 주도하고 있으며, 2024년 시장 점유율은 60.5%, 시장 규모는 2억 1,970만 달러에 달했습니다. 적은 에너지 소비로 높은 오일 수율을 효율적으로 얻을 수 있기 때문에 TPO 생산에 적합한 방법으로 자리 매김하고 있습니다. 급속 가열 기술을 이용하는 플래시 열분해는 생산물의 품질과 공정 효율을 최적화하기 위해 인기를 끌고 있습니다. 반면, 저속 열분해는 오일의 양은 적지만, 차(Char)나 철강과 같은 귀중한 제품들을 계속 생산하며, 이들은 중요한 산업용으로 사용되고 있습니다.
미국은 타이어 열분해 오일 시장의 주요 기업으로 부상하고 있으며, 2034년까지 연평균 5.1%의 CAGR로 1억 4,580만 달러에 도달할 것으로 예상됩니다. 성장의 원동력은 엄격한 환경 규제, 재활용 의무화, 첨단 열분해 시스템에 대한 투자 증가입니다. 지속가능한 기술을 장려하고 탄소발자국을 줄이기 위한 정부의 장려책은 다양한 분야에서 TPO의 채택을 더욱 촉진하고 있습니다. 기업들이 친환경 기술 도입에 집중하면서 미국 시장은 세계 타이어 열분해 오일 산업의 혁신과 확장의 최전선에 서게 될 것으로 보입니다.
목차
제1장 조사 방법과 조사 범위
- 시장 범위와 정의
- 기본 추정과 계산
- 예측 계산
- 데이터 소스
- 1차 데이터
- 2차 데이터
- 유료 정보 출처
- 공적 정보 출처
제2장 주요 요약
제3장 업계 인사이트
- 생태계 분석
- 밸류체인에 영향을 미치는 요인
- 이익률 분석
- 파괴
- 향후 전망
- 제조업체
- 유통업체
- 공급업체 상황
- 이익률 분석
- 주요 뉴스
- 규제 상황
- 영향요인
- 업계에 대한 영향요인
- 성장 촉진요인
- 환경에 대한 우려와 폐기물 처리 문제
- 연료 가격 상승과 경제 효과
- 다양한 용도에서 범용성과 적응성
- 시장 과제
- 기술적 한계와 생산 효율
- 성장 촉진요인
- 규제와 시장에 대한 영향
- Porters 분석
- PESTEL 분석
제4장 경쟁 구도
- 소개
- 기업 점유율 분석
- 경쟁 포지셔닝 매트릭스
- 전략 전망 매트릭스
제5장 시장 규모 및 예측 : 원료별, 2021-2034년
- 주요 동향
- 폐플라스틱
- 폐고무
- 목재
- 오일 슬러지
- 기타
제6장 시장 규모 및 예측 : 프로세스별, 2021-2034년
- 주요 동향
- 고속 열분해
- 플래시 열분해
- 저속 열분해
제7장 시장 규모 및 예측 : 최종 용도별, 2021-2034년
- 주요 동향
- 화학제품
- 연료
- 기타
제8장 시장 규모 및 예측 : 지역별, 2021-2034년
- 주요 동향
- 북미
- 미국
- 캐나다
- 유럽
- 영국
- 독일
- 프랑스
- 이탈리아
- 스페인
- 러시아
- 아시아태평양
- 중국
- 인도
- 일본
- 한국
- 호주
- 라틴아메리카
- 브라질
- 멕시코
- 중동 및 아프리카
- 남아프리카공화국
- 사우디아라비아
- 아랍에미리트
제9장 기업 개요
- Alterra Energy
- Bioenergy Ae Cote-Nord
- Bridgestone Corporation
- Ensyn
- Green Fuel Nordic Oy
- Mk Aromatics Limited
- New Energy Kft.
- New Hope Energy
- Nexus Circular
- Plastic Energy
The Global Tire Pyrolysis Oil Market, valued at USD 363.2 million in 2024, is projected to expand at a CAGR of 5.4% between 2025 and 2034. This growth is fueled by the increasing demand for sustainable alternatives and continuous advancements in waste management technologies. As industries shift toward environmentally friendly practices, tire pyrolysis oil (TPO), derived from the thermal decomposition of waste materials, is emerging as a viable solution for reducing carbon emissions and promoting a circular economy. Governments worldwide are introducing stringent regulations to curb landfill waste, further driving the adoption of TPO. The oil's ability to serve as a cost-effective and eco-friendly substitute for traditional fossil fuels is encouraging its widespread utilization across industries such as energy, manufacturing, and transportation.
The market is experiencing robust growth due to the integration of diverse feedstocks, with waste plastic and end-of-life tires at the forefront. Waste plastic, recognized for its high calorific content, is becoming a key raw material for TPO production. The segment is expected to reach USD 275.4 million by 2034, growing at a remarkable CAGR of 6.2%. End-of-life tires remain a dominant input, bolstered by widespread recycling initiatives designed to minimize environmental impact and reduce the accumulation of non-biodegradable materials in landfills. Additionally, feedstocks such as oil sludge, wood, and industrial residues are being incorporated into the pyrolysis process, broadening the range of raw materials and enhancing production efficiency.
| Market Scope | |
|---|---|
| Start Year | 2024 |
| Forecast Year | 2025-2034 |
| Start Value | $363.2 Million |
| Forecast Value | $611.9 Million |
| CAGR | 5.4% |
Fast pyrolysis is leading the technological landscape, holding a 60.5% market share in 2024 and valued at USD 219.7 million. Its ability to deliver high oil yields efficiently while consuming less energy positions it as a preferred method for TPO production. Flash pyrolysis, which utilizes rapid heating technologies, is gaining traction for optimizing output quality and process efficiency. On the other hand, slow pyrolysis, though yielding lower oil volumes, continues to produce valuable byproducts such as char and steel, which have significant industrial applications.
The United States is emerging as a key player in the tire pyrolysis oil market, anticipated to reach USD 145.8 million by 2034 with a CAGR of 5.1%. Growth is driven by stringent environmental regulations, recycling mandates, and increased investments in advanced pyrolysis systems. Government incentives to promote sustainable technologies and reduce carbon footprints are further encouraging the adoption of TPO across various sectors. As businesses focus on integrating green practices, the US market is poised to remain at the forefront of innovation and expansion in the global tire pyrolysis oil industry.
Table of Contents
Chapter 1 Methodology & Scope
- 1.1 Market scope & definition
- 1.2 Base estimates & calculations
- 1.3 Forecast calculation
- 1.4 Data sources
- 1.4.1 Primary
- 1.4.2 Secondary
- 1.4.2.1 Paid sources
- 1.4.2.2 Public sources
Chapter 2 Executive Summary
- 2.1 Industry synopsis, 2021-2034
Chapter 3 Industry Insights
- 3.1 Industry ecosystem analysis
- 3.1.1 Factor affecting the value chain
- 3.1.2 Profit margin analysis
- 3.1.3 Disruptions
- 3.1.4 Future outlook
- 3.1.5 Manufacturers
- 3.1.6 Distributors
- 3.2 Supplier landscape
- 3.3 Profit margin analysis
- 3.4 Key news & initiatives
- 3.5 Regulatory landscape
- 3.6 Impact forces
- 3.7 Industry impact forces
- 3.7.1 Growth drivers
- 3.7.1.1 Environmental concerns and waste disposal issues
- 3.7.1.2 Rising fuel prices and economic benefits
- 3.7.1.3 Versatility and adaptability in various applications
- 3.7.2 Market challenges
- 3.7.2.1 Technological limitations and production efficiency
- 3.7.1 Growth drivers
- 3.8 Regulations & market impact
- 3.9 Porter’s analysis
- 3.10 PESTEL analysis
Chapter 4 Competitive Landscape, 2024
- 4.1 Introduction
- 4.2 Company market share analysis
- 4.3 Competitive positioning matrix
- 4.4 Strategic outlook matrix
Chapter 5 Market Size and Forecast, By Raw Material, 2021-2034 (USD Million) (Kilo Tons)
- 5.1 Key trends
- 5.2 Waste plastic
- 5.3 Waste rubber
- 5.4 Wood
- 5.5 Oil sludge
- 5.6 Others
Chapter 6 Market Size and Forecast, By Process, 2021-2034 (USD Million) (Kilo Tons)
- 6.1 Key trends
- 6.2 Fast pyrolysis
- 6.3 Flash pyrolysis
- 6.4 Slow pyrolysis
Chapter 7 Market Size and Forecast, By End Use, 2021-2034 (USD Million) (Kilo Tons)
- 7.1 Key trends
- 7.2 Chemicals
- 7.3 Fuel
- 7.4 Others
Chapter 8 Market Size and Forecast, By Region, 2021-2034 (USD Million) (Kilo Tons)
- 8.1 Key trends
- 8.2 North America
- 8.2.1 U.S.
- 8.2.2 Canada
- 8.3 Europe
- 8.3.1 UK
- 8.3.2 Germany
- 8.3.3 France
- 8.3.4 Italy
- 8.3.5 Spain
- 8.3.6 Russia
- 8.4 Asia Pacific
- 8.4.1 China
- 8.4.2 India
- 8.4.3 Japan
- 8.4.4 South Korea
- 8.4.5 Australia
- 8.5 Latin America
- 8.5.1 Brazil
- 8.5.2 Mexico
- 8.6 MEA
- 8.6.1 South Africa
- 8.6.2 Saudi Arabia
- 8.6.3 UAE
Chapter 9 Company Profiles
- 9.1 Alterra Energy
- 9.2 Bioenergy Ae Cote-Nord
- 9.3 Bridgestone Corporation
- 9.4 Ensyn
- 9.5 Green Fuel Nordic Oy
- 9.6 Mk Aromatics Limited
- 9.7 New Energy Kft.
- 9.8 New Hope Energy
- 9.9 Nexus Circular
- 9.10 Plastic Energy