
|
시장보고서
상품코드
1667112
전동 수중 펌프 시장 기회, 성장 촉진 요인, 산업 동향 분석, 예측(2024-2032년)Electric Submersible Pump Market Opportunity, Growth Drivers, Industry Trend Analysis, and Forecast 2024 - 2032 |
||||||
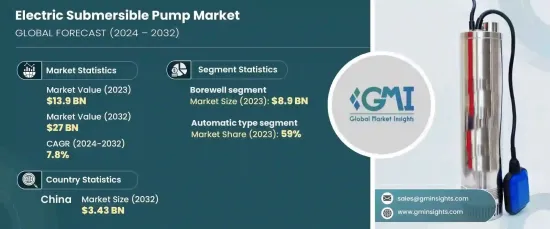
전동 수중 펌프의 세계 시장은 2023년 139억 달러로 평가되었고, 2024년부터 2032년까지 연평균 복합 성장률(CAGR) 7.8%로 성장할 것으로 예측되고 있습니다.
에너지 수요 증가와 첨단 물 관리 솔루션에 대한 요구는 이러한 성장을 가속하는 주요 요인입니다.

세계 에너지 소비 증가는 석유 및 가스 탐사에 많은 투자를 촉구하고 있습니다. 이 동향은 효율적인 채굴을 위해 전동 수중 펌프가 필수적인 해양 및 심해 프로젝트에서 특히 두드러집니다. 이 펌프는 극단적인 수심과 압력과 같은 엄격한 조건에서 대량의 작업을 처리하도록 설계되었습니다. 그 신뢰성과 성능은 원격지와 접근이 어려운 곳의 에너지 수요를 충족시키는 데 필수적입니다.
| 시장 범위 | |
|---|---|
| 시작연도 | 2023년 |
| 예측연도 | 2024년-2032년 |
| 시작금액 | 139억 달러 |
| 예측 금액 | 270억 달러 |
| CAGR | 7.8% |
물 부족이라는 과제의 심각화와 폐수 관리에 대한 주목의 고조도 전동 수중 펌프의 채택을 뒷받침하고 있습니다. 도시화와 인구 증가는 특히 물 스트레스를 경험하는 지역에서 지속 가능한 물 공급 시스템에 대한 수요를 강화하고 있습니다. 전동 수중 펌프는 지자체, 농업 및 산업용 지하수 추출 및 물 운송에 중요한 역할을 하고 있으며, 세계의 물 부족에 효과적으로 대처하기 위한 노력을 지원하고 있습니다.
제품 유형에서 시장은 보어웰 펌프와 오픈웰 펌프로 구분됩니다. 보어웰 ESP는 2023년 약 89억 달러의 매출을 차지하며 2032년까지 연평균 복합 성장률(CAGR) 7.9%로 성장할 것으로 예상됩니다. 범용성, 비용 효율성 및 효율성으로 다양한 분야에서 지하수 추출에 높은 인기가 있습니다. 에너지 효율적인 모터나 내구성이 높은 소재 등의 기술의 진보에 의해 신뢰성이 한층 더 높아져, 농촌와 도시의 양쪽 모두의 용도로 이용되고 있습니다.
또한 이 시장은 운영 유형별로 자동 및 반자동 전동 수중 펌프로 분류됩니다. 자동 전동 수중 펌프는 2023년 59%의 압도적인 시장 점유율을 차지하며 예측 기간 동안 CAGR8%로 성장할 것으로 예측됩니다. 이러한 펌프는 사용 편의성, 고급 제어 시스템, 실시간 조정으로 에너지 소비 최적화 능력으로 지원됩니다. 원격 모니터링 기능과 낮은 유지보수성으로 지속적이고 효율적인 운전이 필요한 산업에 이상적입니다.
아시아태평양에서는 중국이 시장을 독점하고 있으며, 2023년에는 16억 9,000만 달러의 매출을 올렸고, 2032년에는 34억 3,000만 달러에 이를 것으로 예상됩니다. 이 나라에서는 물 관리 및 에너지 프로젝트 등 대규모 인프라 개발에 주력하고 있으며, 이는 전동 수중 펌프 수요를 촉진하고 있습니다. 기술 혁신과 효율성을 중시하는 지역 시장의 리더십을 더욱 견고하게 만들고 있습니다.
목차
제1장 조사 방법과 조사 범위
- 시장 범위와 정의
- 기본 추정과 계산
- 예측 계산
- 데이터 소스
- 1차
- 2차
- 유료소스
- 공적소스
제2장 주요 요약
제3장 업계 인사이트
- 업계 생태계 분석
- 밸류체인에 영향을 주는 요인
- 이익률 분석
- 변혁
- 장래의 전망
- 제조업체
- 유통업체
- 공급자의 상황
- 이익률 분석
- 주요 뉴스와 대처
- 규제 상황
- 영향요인
- 성장 촉진요인
- 석유 및 가스 탐사 증가
- 도시화와 인프라의 성장
- 신재생에너지와 대체에너지의 중시
- 물 부족과 폐수 관리 요구 증가
- 업계의 잠재적 리스크 및 과제
- 높은 설치 비용과 유지 보수 비용
- 변동하는 석유 가격
- 성장 촉진요인
- 기술 개요
- 성장 가능성 분석
- Porter's Five Forces 분석
- PESTEL 분석
제4장 경쟁 구도
- 소개
- 기업의 시장 점유율 분석
- 경쟁 포지셔닝 매트릭스
- 전략 전망 매트릭스
제5장 시장 추정 및 예측 : 제품 유형별, 2021년-2032년
- 주요 동향
- 보아웰
- 오픈웰
제6장 시장 추정 및 예측 : 스테이지별, 2021년-2032년
- 주요 동향
- 싱글 스테이지
- 멀티스테이지
제7장 시장 추정 및 예측 : 유형별, 2021년-2032년
- 주요 동향
- 자동
- 반자동
제8장 시장 추정 및 예측 : 설치 장소별, 2021년-2032년
- 주요 동향
- 세로형 펌프
- 수평형 펌프
제9장 시장 추정 및 예측 : 최종 용도별, 2021년-2032년
- 주요 동향
- 주택용
- 상업용
- 산업용
- 석유 및 가스
- 상하수도
- 농업 및 관개
- 건설
- 광업
- 기타
제10장 시장 추정 및 예측 : 유통 채널별, 2021년-2032년
- 주요 동향
- 직접 판매
- 간접판매
제11장 시장 추정 및 예측 : 지역별, 2021년-2032년
- 주요 동향
- 북미
- 미국
- 캐나다
- 유럽
- 영국
- 독일
- 프랑스
- 이탈리아
- 스페인
- 아시아태평양
- 중국
- 인도
- 일본
- 호주
- 라틴아메리카
- 브라질
- 멕시코
- 중동 및 아프리카
- 남아프리카
- 사우디아라비아
- 아랍에미리트(UAE)
제12장 기업 프로파일
- Aqua Group
- Atlas Copco
- Baker Hughes
- Dab Pumps
- EBARA
- Flexachem
- Pedrollo
- Pleuger
- Proril Pumps
- SLB
- SPP Pumps
- Sumak Pump
- Weir Group
- Whisper Pumps
- Xylem
The Global Electric Submersible Pump Market, valued at USD 13.9 billion in 2023, is projected to expand at a CAGR of 7.8% from 2024 to 2032. The growing demand for energy and the need for advanced water management solutions are key factors driving this growth.
Increasing energy consumption worldwide is encouraging significant investments in oil and gas exploration. This trend is especially pronounced in offshore and deepwater projects, where ESPs are essential for efficient extraction. These pumps are engineered to handle high-volume operations under challenging conditions, such as extreme depths and pressures. Their reliability and performance make them indispensable in meeting the energy demands of remote and difficult-to-access locations.
| Market Scope | |
|---|---|
| Start Year | 2023 |
| Forecast Year | 2024-2032 |
| Start Value | $13.9 Billion |
| Forecast Value | $27 Billion |
| CAGR | 7.8% |
The escalating challenge of water scarcity and the rising focus on wastewater management are also boosting the adoption of ESPs. Urbanization and population growth are intensifying the demand for sustainable water supply systems, particularly in regions experiencing water stress. ESPs play a vital role in groundwater extraction and water transportation for municipal, agricultural, and industrial purposes, supporting efforts to address global water scarcity effectively.
In terms of product type, the market is segmented into borewell and open-well pumps. Borewell ESPs accounted for approximately USD 8.9 billion in revenue in 2023 and are expected to grow at a CAGR of 7.9% through 2032. Their versatility, cost-effectiveness, and efficiency make them highly popular for extracting groundwater across various sectors. Advancements in technology, such as energy-efficient motors and durable materials, further enhance their reliability and appeal for both rural and urban applications.
The market is also categorized by operation type into automatic and semi-automatic ESPs. Automatic ESPs held a dominant market share of 59% in 2023 and are forecast to grow at a CAGR of 8% over the forecast period. These pumps are favored for their ease of use, advanced control systems, and ability to optimize energy consumption through real-time adjustments. Their remote monitoring capabilities and low-maintenance features make them ideal for industries requiring continuous, efficient operations.
In the Asia-Pacific region, China dominates the market, generating USD 1.69 billion in revenue in 2023, with expectations to reach USD 3.43 billion by 2032. The country's focus on large-scale infrastructure development, including water management and energy projects, is driving demand for ESPs. Its emphasis on innovation and efficiency further solidifies its leadership in the regional market.
Table of Contents
Chapter 1 Methodology & Scope
- 1.1 Market scope & definitions
- 1.2 Base estimates & calculations
- 1.3 Forecast calculations
- 1.4 Data sources
- 1.4.1 Primary
- 1.4.2 Secondary
- 1.4.2.1 Paid sources
- 1.4.2.2 Public sources
Chapter 2 Executive Summary
- 2.1 Industry synopsis, 2021-2032
Chapter 3 Industry Insights
- 3.1 Industry ecosystem analysis
- 3.1.1 Factor affecting the value chain
- 3.1.2 Profit margin analysis
- 3.1.3 Disruptions
- 3.1.4 Future outlook
- 3.1.5 Manufacturers
- 3.1.6 Distributors
- 3.2 Supplier landscape
- 3.3 Profit margin analysis
- 3.4 Key news & initiatives
- 3.5 Regulatory landscape
- 3.6 Impact forces
- 3.6.1 Growth drivers
- 3.6.1.1 Increase in oil & gas exploration
- 3.6.1.2 Urbanization and infrastructure growth
- 3.6.1.3 Focus on renewable and alternative energy
- 3.6.1.4 Rising water scarcity and wastewater management needs
- 3.6.2 Industry pitfalls & challenges
- 3.6.2.1 High installation and maintenance costs
- 3.6.2.2 Fluctuating oil prices
- 3.6.1 Growth drivers
- 3.7 Technological overview
- 3.8 Growth potential analysis
- 3.9 Porter’s analysis
- 3.10 PESTEL analysis
Chapter 4 Competitive Landscape, 2023
- 4.1 Introduction
- 4.2 Company market share analysis
- 4.3 Competitive positioning matrix
- 4.4 Strategic outlook matrix
Chapter 5 Market Estimates & Forecast, By Product Type, 2021-2032 (USD Billion) (Thousand Units)
- 5.1 Key trends
- 5.2 Borewell
- 5.3 Open well
Chapter 6 Market Estimates & Forecast, By Stage, 2021-2032 (USD Billion) (Thousand Units)
- 6.1 Key trends
- 6.2 Single stage
- 6.3 Multistage
Chapter 7 Market Estimates & Forecast, By Type, 2021-2032 (USD Billion) (Thousand Units)
- 7.1 Key trends
- 7.2 Automatic
- 7.3 Semi-automatic
Chapter 8 Market Estimates & Forecast, By Installation, 2021-2032 (USD Billion) (Thousand Units)
- 8.1 Key trends
- 8.2 Vertical pump
- 8.3 Horizontal pump
Chapter 9 Market Estimates & Forecast, By End Use, 2021-2032 (USD Billion) (Thousand Units)
- 9.1 Key trends
- 9.2 Residential
- 9.3 Commercial
- 9.4 Industrial
- 9.4.1 Oil & Gas
- 9.4.2 Water & wastewater
- 9.4.3 Agricultural & irrigation
- 9.4.4 Construction
- 9.4.5 Mining
- 9.4.6 Others
Chapter 10 Market Estimates & Forecast, By Distribution Channel, 2021-2032 (USD Billion) (Thousand Units)
- 10.1 Key trends
- 10.2 Direct sales
- 10.3 Indirect sales
Chapter 11 Market Estimates & Forecast, By Region, 2021-2032 (USD Billion) (Thousand Units)
- 11.1 Key trends
- 11.2 North America
- 11.2.1 U.S.
- 11.2.2 Canada
- 11.3 Europe
- 11.3.1 UK
- 11.3.2 Germany
- 11.3.3 France
- 11.3.4 Italy
- 11.3.5 Spain
- 11.4 Asia Pacific
- 11.4.1 China
- 11.4.2 India
- 11.4.3 Japan
- 11.4.4 Australia
- 11.5 Latin America
- 11.5.1 Brazil
- 11.5.2 Mexico
- 11.6 MEA
- 11.6.1 South Africa
- 11.6.2 Saudi Arabia
- 11.6.3 UAE
Chapter 12 Company Profiles
- 12.1 Aqua Group
- 12.2 Atlas Copco
- 12.3 Baker Hughes
- 12.4 Dab Pumps
- 12.5 EBARA
- 12.6 Flexachem
- 12.7 Pedrollo
- 12.8 Pleuger
- 12.9 Proril Pumps
- 12.10 SLB
- 12.11 SPP Pumps
- 12.12 Sumak Pump
- 12.13 Weir Group
- 12.14 Whisper Pumps
- 12.15 Xylem
