|
시장보고서
상품코드
1667137
집광형 태양열발전 시장 : 기회, 성장 촉진요인, 산업 동향 분석, 예측(2025-2034년)Concentrated Solar Power Market Opportunity, Growth Drivers, Industry Trend Analysis, and Forecast 2025 - 2034 |
||||||
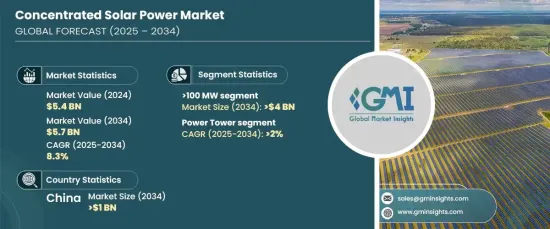
세계의 집광형 태양열발전 시장은 2024년에 54억 달러로 평가되었으며, 2025년부터 2034년까지 연평균 복합 성장률(CAGR) 8.3%로 성장할 것으로 예측됩니다.
집광형 태양열발전은 태양광을 집광하여 고온의 열을 발생시켜 전기로 변환하는 발전방법입니다. 태양광을 직접 전기로 변환하는 태양광 패널과 달리 집광형 태양열발전 시스템은 렌즈와 거울을 사용하여 태양광을 소면적(일반적으로 수신기)에 집광하여 열을 발생시키고 있습니다. 집광형 태양열발전의 주된 장점 중 하나는 에너지를 저장할 수 있다는 점에서 풍력 발전이나 태양열발전과 같은 간헐적인 재생 가능 에너지원에 비해 안정된 에너지의 이용이 가능하다는 큰 장점이 있습니다.
주택, 상업 및 산업 부문이 견인하는 세계 전력 수요 증가는 청정 에너지 솔루션으로의 전환을 뒷받침하고 있습니다. 이러한 변화는 기술 발전, 자금 조달 모델 개선, 보다 큰 집광형 태양열발전 도입과 함께 시장 성장을 가속하고 있습니다. 또한 R&D에 대한 투자 확대는 집광형 태양열발전을 다른 발전 기술에 비해 비용 경쟁력있는 에너지 옵션으로 만드는 데 도움이 됩니다. 세계 인구가 급증하고 전력 수요가 증가함에 따라 집광형 태양열발전과 같은 재생 가능 에너지 솔루션은 미래의 에너지 시스템에 필수적인 요소가되고 있습니다.
| 시장 범위 | |
|---|---|
| 시작 연도 | 2024 |
| 예측 연도 | 2025-2034년 |
| 시작 금액 | 54억 달러 |
| 예측 금액 | 57억 달러 |
| CAGR | 8.3% |
대규모 집광형 태양열발전 시스템에 대한 수요는 증가할 것으로 예상되며, 100MW를 초과하는 용량의 부문은 2034년까지 40억 달러 이상에 달할 것으로 예상됩니다. 이 성장의 원동력이 되는 것은 다양한 지역에서의 프로젝트 파이프라인 증가와 재생 가능 에너지 생산에 대한 주목 증가입니다. 집광형 태양열발전과 태양광 기술을 결합한 하이브리드 집광형 태양열발전 시스템은 에너지 생성과 저장을 최적화할 수 있다는 점에서 주목을 받고 있습니다. 또한 세계 에너지 수요 증가와 이산화탄소 배출 감소에 대한 압력도 시장 확대에 기여할 것으로 보입니다.
기술면에서 파워 타워 시스템은 높은 운용 효율과 집광율에 의해 2034년까지 연평균 복합 성장률(CAGR) 2%로 안정된 성장이 예상되고 있습니다. 첨단 태양 추적형 헬리오스탯을 사용하면 이러한 시스템이 더 높은 온도에서 작동하고 더 나은 저장 능력을 제공할 수 있으므로 수요가 더욱 높아질 것으로 예상됩니다. 보조금 및 고정 가격 임베디드 제도를 포함한 정부 인센티브는 집광형 태양열발전 플랜트 개발에 중요한 역할을 하고 있으며, 많은 국가들이 도입을 장려하는 재정 지원을 제공합니다.
집광형 태양열발전 시장은 중국과 같은 지역에서도 강한 성장을 이루고 있으며, 높은 태양 방사조도와 경쟁력 있는 제조 비용은 더욱 확대를 위한 견고한 기반이 되고 있습니다. 또한 환경 규제 강화가 집광형 태양열발전과 같은 깨끗한 에너지 원으로의 전환을 가속화하고 재생 가능 기술의 채택을 뒷받침하고 있습니다. 열저장, 시스템 효율, 비용 절감의 기술 혁신은 집광형 태양열발전 시스템의 경쟁력을 지속적으로 높여 시장 전체 확대에 기여할 것으로 보입니다.
목차
제1장 조사 방법과 조사 범위
- 조사 디자인
- 기본 추정과 계산
- 예측 모델
- 1차 조사와 검증
- 1차 정보
- 데이터 마이닝 소스
- 시장 정의
제2장 주요 요약
제3장 업계 인사이트
- 업계 에코시스템
- 규제 상황
- 업계에 미치는 영향요인
- 성장 촉진요인
- 업계의 잠재적 위험 및 과제
- 성장 가능성 분석
- Porter's Five Forces 분석
- 공급기업의 협상력
- 구매자의 협상력
- 신규 참가업체의 위협
- 대체품의 위협
- PESTEL 분석
제4장 경쟁 구도
- 서론
- 전략 대시보드
- 혁신과 기술 전망
제5장 시장 규모와 예측 : 기술별(2021-2034년)
- 주요 동향
- 포물선형 트로프
- 선형 FR
- 파워 타워
제6장 시장 규모와 예측 : 용량별(2021-2034년)
- 주요 동향
- 50MW 이하
- 50MW-100MW 이상
- 100MW 이상
제7장 시장 규모와 예측 : 스토리지별(2021-2034년)
- 주요 동향
- 스토리지 포함
- 용융 소금
- 기타
- 스토리지 미포함
제8장 시장 규모와 예측 : 국가별(2021-2034년)
- 주요 동향
- 그리스
- 프랑스
- 중국
- 인도
- 이스라엘
- UAE
- 쿠웨이트
- 모로코
- 남아프리카
- 사우디아라비아
- 칠레
- 브라질
제9장 기업 프로파일
- ACCIONA
- ACWA Power
- Abengoa SA
- Atlantica Sustainable Infrastructure plc
- Chiyoda Corporation
- Dornier Suntrace GmbH
- Eastman Chemical Company
- Engie
- Enel Green Power SpA
- FRENELL GmbH
- GE Renewable Energy
- Grupo Sener
- New BrightSource, Ltd
- TSK
The Global Concentrated Solar Power Market, valued at USD 5.4 billion in 2024, is forecast to grow at a CAGR of 8.3% between 2025 and 2034. CSP is a method of generating electricity by concentrating sunlight to produce high-temperature heat, which is then converted into electricity. Unlike photovoltaic solar panels, which directly convert sunlight into electricity, concentrated solar power systems count on lenses or mirrors to concentrate sunlight onto a small area, usually a receiver, to generate heat. One of the key advantages of CSP is its ability to store energy, providing a significant benefit over intermittent renewable sources like wind and solar power, which depend on consistent energy availability.

The growing global demand for electricity, driven by residential, commercial, and industrial sectors, is propelling the shift toward clean energy solutions. This shift, combined with technological advancements, improved financing models, and larger-scale CSP deployments, is fueling market growth. Additionally, higher investments in research and development are helping to make CSP a more cost-competitive energy option compared to other power generation technologies. With the surge in global population and the increasing demand for electricity, renewable energy solutions like CSP are becoming an essential component of future energy systems.
| Market Scope | |
|---|---|
| Start Year | 2024 |
| Forecast Year | 2025-2034 |
| Start Value | $5.4 Billion |
| Forecast Value | $5.7 Billion |
| CAGR | 8.3% |
The demand for larger CSP systems is expected to increase, with the >100 MW capacity segment projected to exceed USD 4 billion by 2034. This growth is driven by a rising project pipeline in various regions and an increasing focus on renewable energy production. Hybrid CSP systems, which combine CSP with photovoltaic solar technology, are gaining attention due to their ability to optimize energy generation and storage. Additionally, the escalating global energy demand and the pressure to reduce carbon emissions will contribute to market expansion.
In terms of technology, power tower systems are expected to experience a steady growth rate of 2% CAGR through 2034 due to their high operational efficiency and concentration ratios. The use of advanced solar tracking heliostats, which allow these systems to operate at higher temperatures and offer better storage capacity, is expected to further boost demand. Government incentives, including subsidies and feed-in tariffs, are playing a crucial role in the development of CSP plants, with many countries offering financial support to encourage their adoption.
The CSP market is also witnessing strong growth in regions like China, where high solar irradiance and competitive manufacturing costs provide a solid foundation for further expansion. In addition, stricter environmental regulations are accelerating the transition to cleaner energy sources like CSP, helping drive the adoption of renewable technologies. Innovations in heat storage, system efficiency, and cost reductions will continue to enhance the competitiveness of CSP systems, contributing to the overall market expansion.
Table of Contents
Chapter 1 Methodology & Scope
- 1.1 Research design
- 1.2 Base estimates & calculations
- 1.3 Forecast model
- 1.4 Primary research & validation
- 1.4.1 Primary sources
- 1.4.2 Data mining sources
- 1.5 Market definitions
Chapter 2 Executive Summary
- 2.1 Industry synopsis, 2021 – 2034
Chapter 3 Industry Insights
- 3.1 Industry ecosystem
- 3.2 Regulatory landscape
- 3.3 Industry impact forces
- 3.3.1 Growth drivers
- 3.3.2 Industry pitfalls & challenges
- 3.4 Growth potential analysis
- 3.5 Porter's analysis
- 3.5.1 Bargaining power of suppliers
- 3.5.2 Bargaining power of buyers
- 3.5.3 Threat of new entrants
- 3.5.4 Threat of substitutes
- 3.6 PESTEL analysis
Chapter 4 Competitive landscape, 2024
- 4.1 Introduction
- 4.2 Strategic dashboard
- 4.3 Innovation & technology landscape
Chapter 5 Market Size and Forecast, By Technology, 2021 – 2034 (USD Million & MW)
- 5.1 Key trends
- 5.2 Parabolic trough
- 5.3 Linear FR
- 5.4 Power tower
Chapter 6 Market Size and Forecast, By Capacity, 2021 – 2034 (USD Million & MW)
- 6.1 Key trends
- 6.2 ≤ 50MW
- 6.3 >50 MW to ≤100 MW
- 6.4 >100 MW
Chapter 7 Market Size and Forecast, By Storage, 2021 – 2034 (USD Million & MW)
- 7.1 Key trends
- 7.2 With storage
- 7.2.1 Molten salt
- 7.2.2 Others
- 7.3 Without storage
Chapter 8 Market Size and Forecast, By Country, 2021 – 2034 (USD Million & MW)
- 8.1 Key trends
- 8.2 Greece
- 8.3 France
- 8.4 China
- 8.5 India
- 8.6 Israel
- 8.7 UAE
- 8.8 Kuwait
- 8.9 Morocco
- 8.10 South Africa
- 8.11 Saudi Arabia
- 8.12 Chile
- 8.13 Brazil
Chapter 9 Company Profiles
- 9.1 ACCIONA
- 9.2 ACWA Power
- 9.3 Abengoa S.A.
- 9.4 Atlantica Sustainable Infrastructure plc
- 9.5 Chiyoda Corporation
- 9.6 Dornier Suntrace GmbH
- 9.7 Eastman Chemical Company
- 9.8 Engie
- 9.9 Enel Green Power S.p.A.
- 9.10 FRENELL GmbH
- 9.11 GE Renewable Energy
- 9.12 Grupo Sener
- 9.13 New BrightSource, Ltd
- 9.14 TSK