
|
시장보고서
상품코드
1667199
FPSO 시장 : 기회, 성장 촉진요인, 산업 동향 분석(2025-2034년)FPSO Market Opportunity, Growth Drivers, Industry Trend Analysis, and Forecast 2025 - 2034 |
||||||
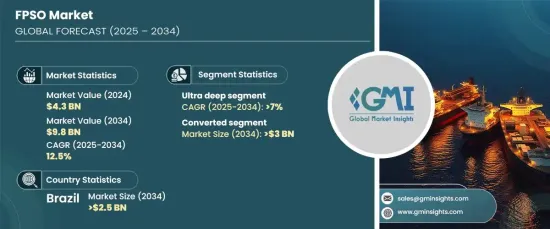
세계의 FPSO 시장은 2024년에 43억 달러로 평가되었으며, 2025년부터 2034년에 걸쳐 연평균 성장률(CAGR) 12.5%로 견조하게 성장할 것으로 예측됩니다.
이러한 성장의 주요 촉진요인은 해양 탐사에 대한 막대한 투자와 심해 기술의 발전이 있습니다. 육상 석유 매장량이 감소하고 육상 인프라 개발과 관련된 비용이 증가함에 따라 고정 구조물 없이도 운영할 수 있는 FPSO의 선호도가 점점 높아지고 있습니다. 이러한 해양 운영의 유연성은 시장 확대를 이끄는 중요한 요소입니다. 또한, 비용 효율적인 방식으로 석유 및 가스 생산을 가속화할 수 있는 FPSO의 능력과 외딴 해양 지역의 한계 매장량 탐사에 대한 사용 증가로 인해 업계 전반에서 채택이 강화되고 있습니다.
또한 2034년까지 30억 달러를 넘어설 것으로 예상되는 개조형 FPSO에 대한 수요도 급증하고 있습니다. 개조된 설비는 자본 비용 절감, 신속한 배치, 운영 유연성 향상 등 신규 건조에 비해 주목할 만한 이점을 제공합니다. 이 부문은 용도를 변경할 수 있는 퇴역한 FPSO와 유조선을 활용할 수 있기 때문에 비슷한 기능을 갖춘 신조 선박에 비해 투자 비용이 훨씬 적게 든다는 이점이 있습니다. 따라서 운영업체들은 초기 비용을 절감하고 프로젝트 일정을 개선하기 위해 개조된 FPSO를 점점 더 많이 선택하고 있습니다.
| 시장 범위 | |
|---|---|
| 시작 연도 | 2024년 |
| 예측 연도 | 2025-2034년 |
| 시작 금액 | 43억 달러 |
| 예측 금액 | 98억 달러 |
| CAGR | 12.5% |
또한 초심해 FPSO 부문은 2034년까지 7% 이상의 연평균 성장률을 보이며 꾸준히 성장할 것으로 예상됩니다. 지진 및 시추 기술의 발전과 함께 초심해 탐사로의 전환은 더 깊은 해양 분지에서 FPSO의 채택을 촉진하고 있습니다. 석유 매장량이 많은 이 지역은 향상된 탐사 기술 덕분에 점점 더 접근성이 좋아지고 있어 FPSO 배치에 유리한 조건을 갖추고 있습니다.
브라질의 FPSO 시장은 2034년까지 25억 달러를 넘어설 것으로 예상됩니다. 이러한 성장은 정부의 우호적인 정책과 석유 및 가스 탐사 부문에 대한 막대한 투자에 힘입어 방대한 해상 석유 매장량이 발견됨에 따라 크게 촉진되고 있습니다. 또한, 배출량 감축과 에너지원 다변화에 대한 관심이 높아지면서 운영업체들이 효율적인 해양 운영을 유지하면서 엄격한 환경 기준을 충족하기 위해 노력함에 따라 이 지역의 FPSO 시장의 미래가 형성되고 있습니다.
목차
제1장 조사 방법과 조사 범위
- 시장의 정의
- 기본 추정과 계산
- 예측 계산
- 데이터 소스
- 1차 데이터
- 2차 데이터
- 유상
- 공적
제2장 주요 요약
제3장 업계 인사이트
- 생태계 분석
- 규제 상황
- 업계에 미치는 영향요인
- 성장 촉진요인
- 업계의 잠재적 위험 및 과제
- 성장 가능성 분석
- Porter's Five Forces 분석
- 공급기업의 협상력
- 구매자의 협상력
- 신규 참가업체의 위협
- 대체품의 위협
- PESTEL 분석
제4장 경쟁 구도
- 소개
- 전략 대시보드
- 혁신과 지속가능성의 전망
제5장 시장 규모와 예측 : 제품별(2021-2034년)
- 주요 동향
- 전환
- 신규
제6장 시장 규모와 예측 : 수심별(2021-2034년)
- 주요 동향
- 천해
- 심해
- 초심해
제7장 시장 규모와 예측 : 국가별(2021-2034년)
- 주요 동향
- 미국
- 영국
- 노르웨이
- 중국
- 인도
- 인도네시아
- 호주
- 브라질
- 가이아나
- 세계 기타 지역
제8장 기업 프로파일
- Bumi Armada
- BW Offshore
- CNOOC
- DNV
- Hanhwa
- Hyundai Heavy Industries
- KBR
- MODEC
- Petrobras
- Saipem
- SBM Offshore
- Shell
- SHI-MCI
- TechnipFMC
- Woodside
- Yinson
The Global FPSO Market, valued at USD 4.3 billion in 2024, is projected to grow at a robust CAGR of 12.5% from 2025 to 2034. The key drivers of this growth include substantial investments in offshore exploration and the advancement of deepwater technologies. As onshore oil reserves decline and the costs associated with onshore infrastructure development rise, FPSOs are becoming increasingly favorable due to their ability to operate without the need for fixed structures. This flexibility in offshore operations is a significant factor in driving market expansion. Furthermore, FPSOs' capacity to accelerate oil and gas production in a cost-effective manner and their increasing use in the exploration of marginal reserves in remote offshore areas are strengthening their adoption across the industry.
The market is also witnessing a surge in the demand for converted FPSOs, expected to surpass USD 3 billion by 2034. Converted units offer notable advantages over new builds, including reduced capital expenses, faster deployment, and enhanced operational flexibility. This segment benefits from the availability of retired FPSOs and oil tankers that can be repurposed, requiring only a fraction of the investment compared to newly constructed vessels with comparable features. As a result, operators are increasingly opting for converted FPSOs to reduce upfront costs and improve project timelines.
| Market Scope | |
|---|---|
| Start Year | 2024 |
| Forecast Year | 2025-2034 |
| Start Value | $4.3 Billion |
| Forecast Value | $9.8 Billion |
| CAGR | 12.5% |
Additionally, the ultra-deepwater FPSO segment is anticipated to grow steadily, with a projected CAGR of over 7% through 2034. The shift toward ultra-deepwater exploration, combined with advances in seismic and drilling technologies, is boosting the adoption of FPSOs in deeper offshore basins. These regions, which often contain larger oil reserves, are becoming increasingly accessible thanks to improved exploration technologies, creating favorable conditions for FPSO deployment.
The FPSO market in Brazil is expected to exceed USD 2.5 billion by 2034. This growth is largely driven by the discovery of vast offshore oil reserves, supported by favorable government policies and significant investments in the oil and gas exploration sector. Additionally, the increasing focus on reducing emissions and diversifying energy sources is shaping the future of the FPSO market in the region as operators work to meet stringent environmental standards while maintaining efficient offshore operations.
Table of Contents
Chapter 1 Methodology & Scope
- 1.1 Market definitions
- 1.2 Base estimates & calculations
- 1.3 Forecast calculation
- 1.4 Data sources
- 1.4.1 Primary
- 1.4.2 Secondary
- 1.4.2.1 Paid
- 1.4.2.2 Public
Chapter 2 Executive Summary
- 2.1 Industry synopsis, 2021 - 2034
Chapter 3 Industry Insights
- 3.1 Industry ecosystem analysis
- 3.2 Regulatory landscape
- 3.3 Industry impact forces
- 3.3.1 Growth drivers
- 3.3.2 Industry pitfalls & challenges
- 3.4 Growth potential analysis
- 3.5 Porter's analysis
- 3.5.1 Bargaining power of suppliers
- 3.5.2 Bargaining power of buyers
- 3.5.3 Threat of new entrants
- 3.5.4 Threat of substitutes
- 3.6 PESTEL analysis
Chapter 4 Competitive Landscape, 2024
- 4.1 Introduction
- 4.2 Strategic dashboard
- 4.3 Innovation & sustainability landscape
Chapter 5 Market Size and Forecast, By Product, 2021 – 2034 (USD Million, Units, ‘000 BOPD)
- 5.1 Key trends
- 5.2 Converted
- 5.3 New built
Chapter 6 Market Size and Forecast, By Water Depth, 2021 – 2034 (USD Million, Units, ‘000 BOPD)
- 6.1 Key trends
- 6.2 Shallow
- 6.3 Deep
- 6.4 Ultra-deep
Chapter 7 Market Size and Forecast, By Country, 2021 – 2034 (USD Million, Units, ‘000 BOPD)
- 7.1 Key trends
- 7.2 U.S.
- 7.3 UK
- 7.4 Norway
- 7.5 China
- 7.6 India
- 7.7 Indonesia
- 7.8 Australia
- 7.9 Brazil
- 7.10 Guyana
- 7.11 Rest of the World
Chapter 8 Company Profiles
- 8.1 Bumi Armada
- 8.2 BW Offshore
- 8.3 CNOOC
- 8.4 DNV
- 8.5 Hanwha
- 8.6 Hyundai Heavy Industries
- 8.7 KBR
- 8.8 MODEC
- 8.9 Petrobras
- 8.10 Saipem
- 8.11 SBM Offshore
- 8.12 Shell
- 8.13 SHI-MCI
- 8.14 TechnipFMC
- 8.15 Woodside
- 8.16 Yinson

