|
시장보고서
상품코드
1685174
음료 포장 시장 : 기회, 성장 촉진요인, 산업 동향 분석(2025-2034년)Beverage Packaging Market Opportunity, Growth Drivers, Industry Trend Analysis, and Forecast 2025 - 2034 |
||||||
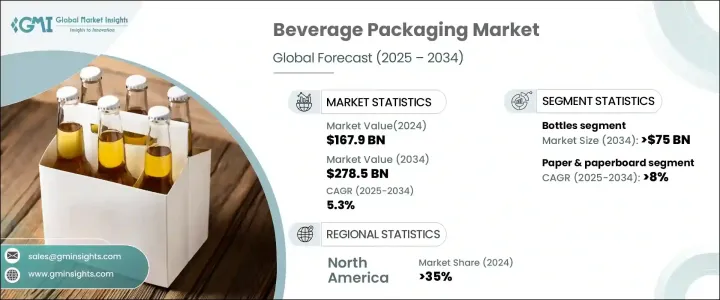
세계의 음료 포장 시장은 2024년에 1,679억 달러에 달했으며, 2025년부터 2034년까지 연평균 성장률(CAGR) 5.3%로 성장할 것으로 예측됩니다.
이러한 성장은 주로 지속 가능하고 친환경적인 포장 솔루션에 대한 소비자 수요 증가에 의해 주도되고 있습니다. 환경에 대한 인식이 지속적으로 높아지면서 소비자와 제조업체 모두 기존 포장 방식에 대한 대안을 찾고 있습니다. 재활용, 생분해 또는 재사용이 가능한 소재에 대한 요구가 높아지면서 기업들은 보다 지속 가능한 옵션을 혁신하고 채택하고 있습니다. 또한 즉석 음료의 성장 추세는 시장 확대에 더욱 기여하고 있습니다. 이동 중에도 편리하게 마실 수 있는 옵션에 대한 수요가 증가하고 있으며, 이러한 변화는 음료 포장 산업에 영향을 미치고 있습니다. 또한 포장 기술의 발전으로 효율성을 개선하고 환경에 미치는 영향을 줄이면서 가볍고 기능적일 뿐만 아니라 환경을 고려한 솔루션을 제공하고 있습니다. 이러한 발전은 기업이 지속 가능성 목표에 부합하는 동시에 환경을 생각하는 소비자의 진화하는 요구를 충족하는 데 도움이 되고 있습니다. 전 세계적으로 규제 압력이 증가함에 따라 친환경 포장재 및 기술로의 전환은 더욱 가속화될 것으로 예상됩니다.

음료 포장 시장은 병, 캔, 상자, 파우치 등 여러 제품 유형으로 분류됩니다. 병은 계속해서 시장을 지배하고 있으며 2034년까지 750억 달러의 매출을 올릴 것으로 예상됩니다. 병의 지속적인 인기는 다용도성, 내구성, 장기간 음료 품질을 보존할 수 있는 능력 덕분입니다. 또한 병은 휴대성과 재밀봉이 가능한 뚜껑을 갖추고 있어 특히 이동이 잦은 소비자들에게 편리함을 더해줍니다. 가볍고 재활용 가능한 페트병과 같은 혁신을 통해 이 부문은 지속 가능성 목표에 부합하며 환경을 생각하는 쇼핑객의 수요 증가를 이끌고 있습니다.
| 시장 범위 | |
|---|---|
| 시작 연도 | 2024년 |
| 예측 연도 | 2025-2034년 |
| 시작 금액 | 1,679억 달러 |
| 예측 금액 | 2,785억 달러 |
| CAGR | 5.3% |
소재별로 시장은 플라스틱, 유리, 금속, 종이, 판지로 구분됩니다. 그 중에서도 종이 및 판지는 급성장하고 있으며 2025년부터 2034년에 걸쳐 CAGR 8%를 나타낼 것으로 예측됩니다. 이러한 빠른 성장은 지속 가능한 대체재로 전환하는 추세에 기인합니다. 플라스틱 폐기물에 대한 우려가 커지면서 소비자와 브랜드 모두 종이와 판지와 같은 친환경 소재를 선택하고 있습니다. 이러한 소재는 생분해성 및 재활용이 가능하기 때문에 재생 가능하고 가벼운 포장이 필요한 주스 및 유제품 음료와 같은 제품에 특히 인기가 있습니다.
북미에서는 2024년 음료 포장 시장이 세계 점유율의 35%를 차지하고 있습니다. 미국은 지속 가능하고 편리한 포장 솔루션에 대한 수요가 빠르게 증가하고 있습니다. 소비자들이 구매가 환경에 미치는 영향에 더욱 주의를 기울이면서 재활용 및 생분해성 포장재에 대한 수요가 더욱 높아지고 있습니다. 기능성 음료의 급증과 개인 맞춤형 포장의 증가 추세는 시장 성장을 더욱 촉진하고 있습니다. 또한 플라스틱 폐기물을 줄이고 재활용 노력을 강화해야 한다는 규제 압력이 높아지면서 기업들은 이러한 새로운 선호도를 충족하는 새로운 포장 기술과 디자인을 채택하고 있습니다.
목차
제1장 조사 방법과 조사 범위
- 시장 범위와 정의
- 기본 추정과 계산
- 예측 계산
- 데이터 소스
제2장 주요 요약
제3장 업계 인사이트
- 생태계 분석
- 밸류체인에 영향을 주는 요인
- 이익률 분석
- 혼란
- 장래 전망
- 제조업체
- 유통업체
- 주요 뉴스와 대처
- 규제 상황
- 영향요인
- 성장 촉진요인
- 도시화 및 가처분 소득 증가
- 심미적이고 혁신적인 포장 디자인에 대한 소비자 선호도
- 즉석 음료 및 기능성 음료의 인기 상승
- 휴대가 편리한 음료 패키지에 대한 소비자 수요 증가
- 지속 가능하고 환경 친화적인 포장 솔루션에 대한 수요 증가
- 업계의 잠재적 위험 및 과제
- 포장 비용에 영향을 미치는 원자재 가격의 변동성
- 포장재 및 재활용 관행에 대한 규제 제한
- 성장 촉진요인
- 성장 가능성 분석
- Porter's Five Forces 분석
- PESTEL 분석
제4장 경쟁 구도
- 소개
- 기업 점유율 분석
- 경쟁 포지셔닝 매트릭스
- 전략 전망 매트릭스
제5장 시장 추계 및 예측 : 소재별(2021-2034년)
- 주요 동향
- 플라스틱
- 유리
- 금속
- 종이 및 판지
- 기타
제6장 시장 추계 및 예측 : 제품 유형별(2021-2034년)
- 주요 동향
- 병
- 캔
- 판지
- 파우치
- 기타
제7장 시장 추계 및 예측 : 음료 유형별(2021-2034년)
- 주요 동향
- 알코올 음료
- 무알코올 음료
- 유제품 음료
제8장 시장 추계 및 예측 : 지역별, 2021-2034년
- 주요 동향
- 북미
- 미국
- 캐나다
- 유럽
- 영국
- 독일
- 프랑스
- 이탈리아
- 스페인
- 러시아
- 아시아태평양
- 중국
- 인도
- 일본
- 한국
- 호주
- 라틴아메리카
- 브라질
- 멕시코
- 중동 및 아프리카
- 남아프리카
- 사우디아라비아
- 아랍에미리트(UAE)
제9장 기업 프로파일
- Amcor
- Ardagh Group
- Ball Corporation
- Berry Global Group
- Can-Pack
- CCL Containers
- CPMC Holdings
- Crown Holdings
- Graham Packaging Company
- Graphic Packaging International
- 노벨리스
- Plastipak Holdings
- SIG
- Silgan Holdings
- Smurfit Kappa
- Stora Enso
- Tetra Pak International
- Visy Industries
- WestRock
The Global Beverage Packaging Market reached USD 167.9 billion in 2024 and is projected to expand at a CAGR of 5.3% from 2025 to 2034. This growth is primarily driven by rising consumer demand for sustainable and eco-friendly packaging solutions. As environmental awareness continues to grow, both consumers and manufacturers are increasingly seeking alternatives to traditional packaging methods. There is a clear push for recyclable, biodegradable, or reusable materials, leading companies to innovate and adopt more sustainable options. Additionally, the growing trend of ready-to-drink beverages further contributes to the market's expansion. The demand for convenient, on-the-go options is rising, and this shift is influencing the beverage packaging industry. Moreover, advancements in packaging technologies are improving efficiency and reducing environmental impact, offering solutions that are not only lightweight and functional but also environmentally conscious. These developments are helping companies stay aligned with sustainability goals while meeting the evolving demands of eco-conscious consumers. As regulatory pressures increase globally, the shift toward eco-friendly packaging materials and technologies is expected to accelerate.
The beverage packaging market is categorized into several product types, including bottles, cans, cartons, pouches, and others. Bottles continue to dominate the market and are projected to generate USD 75 billion by 2034. Their enduring popularity is due to their versatility, durability, and ability to preserve beverage quality over extended periods. Bottles also offer portability and resealable caps, which add convenience, especially for on-the-go consumers. With innovations such as lightweight and recyclable PET bottles, this segment aligns with sustainability goals, driving increased demand from environmentally conscious shoppers.
| Market Scope | |
|---|---|
| Start Year | 2024 |
| Forecast Year | 2025-2034 |
| Start Value | $167.9 Billion |
| Forecast Value | $278.5 Billion |
| CAGR | 5.3% |
When it comes to materials, the market is segmented into plastic, glass, metal, paper, and paperboard. Among these, paper and paperboard are experiencing the fastest growth, projected to rise at a CAGR of 8% between 2025 and 2034. This rapid growth is attributed to the increasing shift toward sustainable alternatives. With the growing concerns over plastic waste, consumers and brands alike are opting for eco-friendly materials like paper and paperboard. These materials are biodegradable and recyclable, making them particularly popular for products like juices and dairy beverages, where renewable and lightweight packaging is desired.
In North America, the beverage packaging market accounted for 35% of the global share in 2024. The U.S. is seeing rapid growth in demand for sustainable and convenient packaging solutions. Consumers are becoming more mindful of the environmental impact of their purchases, pushing the demand for recyclable and biodegradable packaging even higher. The surge in functional beverages and the rising trend for personalized packaging are further propelling market growth. Additionally, increasing regulatory pressures to reduce plastic waste and enhance recycling efforts are driving companies to adopt new packaging technologies and designs that meet these emerging preferences.
Table of Contents
Chapter 1 Methodology & Scope
- 1.1 Market scope & definitions
- 1.2 Base estimates & calculations
- 1.3 Forecast calculations
- 1.4 Data sources
- 1.4.1 Primary
- 1.4.2 Secondary
- 1.4.2.1 Paid sources
- 1.4.2.2 Public sources
Chapter 2 Executive Summary
- 2.1 Industry synopsis, 2022-2034
Chapter 3 Industry Insights
- 3.1 Industry ecosystem analysis
- 3.1.1 Factor affecting the value chain
- 3.1.2 Profit margin analysis
- 3.1.3 Disruptions
- 3.1.4 Future outlook
- 3.1.5 Manufacturers
- 3.1.6 Distributors
- 3.2 Key news & initiatives
- 3.3 Regulatory landscape
- 3.4 Impact forces
- 3.4.1 Growth drivers
- 3.4.1.1 Urbanization and rising disposable incomes
- 3.4.1.2 Consumer preference for aesthetic and innovative packaging designs
- 3.4.1.3 Rising popularity of ready-to-drink and functional beverages
- 3.4.1.4 Increased consumer demand for convenient, on-the-go beverage packaging
- 3.4.1.5 Rising demand for sustainable and environmentally friendly packaging solutions
- 3.4.2 Industry pitfalls & challenges
- 3.4.2.1 Volatility in raw material prices affecting packaging costs
- 3.4.2.2 Regulatory restrictions on packaging materials and recycling practices
- 3.4.1 Growth drivers
- 3.5 Growth potential analysis
- 3.6 Porter’s analysis
- 3.7 PESTEL analysis
Chapter 4 Competitive Landscape, 2024
- 4.1 Introduction
- 4.2 Company market share analysis
- 4.3 Competitive positioning matrix
- 4.4 Strategic outlook matrix
Chapter 5 Market Estimates & Forecast, By Material, 2021-2034 (USD Billion & Kilo Tons)
- 5.1 Key trends
- 5.2 Plastic
- 5.3 Glass
- 5.4 Metal
- 5.5 Paper & Paperboard
- 5.6 Others
Chapter 6 Market Estimates & Forecast, By Product Type, 2021-2034 (USD Billion & Kilo Tons)
- 6.1 Key trends
- 6.2 Bottles
- 6.3 Cans
- 6.4 Cartons
- 6.5 Pouches
- 6.6 Others
Chapter 7 Market Estimates & Forecast, By Beverages Type, 2021-2034 (USD Billion & Kilo Tons)
- 7.1 Key trends
- 7.2 Alcoholic beverages
- 7.3 Non-alcoholic beverages
- 7.4 Dairy beverages
Chapter 8 Market Estimates & Forecast, By Region, 2021-2034 (USD Billion & Kilo Tons)
- 8.1 Key trends
- 8.2 North America
- 8.2.1 U.S.
- 8.2.2 Canada
- 8.3 Europe
- 8.3.1 UK
- 8.3.2 Germany
- 8.3.3 France
- 8.3.4 Italy
- 8.3.5 Spain
- 8.3.6 Russia
- 8.4 Asia Pacific
- 8.4.1 China
- 8.4.2 India
- 8.4.3 Japan
- 8.4.4 South Korea
- 8.4.5 Australia
- 8.5 Latin America
- 8.5.1 Brazil
- 8.5.2 Mexico
- 8.6 MEA
- 8.6.1 South Africa
- 8.6.2 Saudi Arabia
- 8.6.3 UAE
Chapter 9 Company Profiles
- 9.1 Amcor
- 9.2 Ardagh Group
- 9.3 Ball Corporation
- 9.4 Berry Global Group
- 9.5 Can-Pack
- 9.6 CCL Containers
- 9.7 CPMC Holdings
- 9.8 Crown Holdings
- 9.9 Graham Packaging Company
- 9.10 Graphic Packaging International
- 9.11 Novelis
- 9.12 Plastipak Holdings
- 9.13 SIG
- 9.14 Silgan Holdings
- 9.15 Smurfit Kappa
- 9.16 Stora Enso
- 9.17 Tetra Pak International
- 9.18 Visy Industries
- 9.19 WestRock