|
시장보고서
상품코드
1698511
저전압 와이어 및 케이블 시장 기회, 성장 촉진요인, 산업 동향 분석, 예측(2025-2034년)Low Voltage Wire and cable Market Opportunity, Growth Drivers, Industry Trend Analysis, and Forecast 2025-2034 |
||||||
세계의 저전압 와이어 및 케이블 시장은 2024년에 1,457억 달러에 이르렀고, 2025년부터 2034년에 걸쳐 CAGR 7.2%를 나타낼 것으로 예측되고 있습니다.
이 성장의 원동력은 급속한 도시화, 산업화, 세계의 스마트 시티 구상에 대한 투자 증가입니다. 신뢰할 수 있는 저전압 케이블 솔루션에 대한 수요에 박차를 가하고 있습니다.

특히 신흥 경제 국가에서는 인프라 개발이 중시되고 있으며 시장 확대의 주된 촉매가 되고 있습니다. 이를 위해 전기 프로젝트를 선도하고 있으며, 엄격한 에너지 규제와 지속가능성에 대한 노력이 환경 친화적이고 고효율적인 케이블 시스템으로의 전환을 촉진하고 있습니다.
| 시장 범위 | |
|---|---|
| 시작 연도 | 2024년 |
| 예측 연도 | 2025-2034년 |
| 시작 금액 | 1,457억 달러 |
| 예측 금액 | 3,020억 달러 |
| CAGR | 7.2% |
시장 세분화는 저전압 와이어 및 케이블의 다양한 용도를 돋보이게 하고 있습니다. 다양한 제품 유형 중에서 전력, 통신, 제어 케이블이 큰 점유율을 차지하고 있습니다. 비교적 확대, 특히 HVAC, 조명, 보안 용도 등 주택 및 상업 공간에서의 자동화 수요가 높아지면서 이러한 제품의 채용을 뒷받침하고 있습니다.
유틸리티 용도는 2024년에 27% 시장 점유율을 차지했으며, 향후 10년간은 강력한 성장이 예상됩니다. 세계 각국의 정부가 신재생에너지의 도입 확대를 추진하는 중 송전망의 안정성과 효율성은 여전히 중요한 과제입니다.
미국의 저전압 와이어 및 케이블 산업은 2024년 150억 달러로 평가되었으며, 북미에서는 노후화된 전기 인프라 업그레이드에 지속적인 투자가 이루어지고 있습니다. 이 자금을 통해 송전 및 배전 네트워크가 크게 개선되고 첨단 저전압 케이블의 필요성이 높아지고 있습니다.
목차
제1장 조사 방법과 조사 범위
- 시장의 정의
- 기본 추정과 계산
- 예측 계산
- 데이터 소스
제2장 주요 요약
제3장 업계 인사이트
- 생태계 분석
- 규제 상황
- 업계에 미치는 영향요인
- 성장 촉진요인
- 업계의 잠재적 위험 및 과제
- 성장 가능성 분석
- Porter's Five Forces 분석
- PESTEL 분석
제4장 경쟁 구도
- 전략 대시보드
- 혁신과 기술의 전망
제5장 시장 규모와 예측 : 제품별(2021-2034년)
- 주요 동향
- 동축 케이블/전자 와이어
- 광섬유 케이블
- 전원 케이블
- 신호 및 제어 케이블
- 통신 및 데이터 케이블
제6장 시장 규모와 예측 : 용도별(2021-2034년)
- 주요 동향
- 식음료
- 자동차
- 자재취급/물류
- 엔터테인먼트/레저
- 유틸리티
- 철도
- 가전제품
- 빌딩 인프라
- 기타
제7장 시장 규모와 예측 : 지역별(2021-2034년)
- 주요 동향
- 북미
- 미국
- 캐나다
- 멕시코
- 유럽
- 영국
- 프랑스
- 네덜란드
- 이탈리아
- 스페인
- 스웨덴
- 덴마크
- 벨기에
- 독일
- 러시아
- 아시아태평양
- 중국
- 인도
- 일본
- 한국
- 호주
- 인도네시아
- 필리핀
- 뉴질랜드
- 말레이시아
- 태국
- 중동 및 아프리카
- 사우디아라비아
- 아랍에미리트(UAE)
- 이라크
- 쿠웨이트
- 카타르
- 남아프리카
- 이집트
- 나이지리아
- 라틴아메리카
- 브라질
- 아르헨티나
- 페루
제8장 기업 프로파일
- alfanar Group
- Bahra Cables
- BELDEN
- Brugg Kabel AG
- Ducab
- Elsewedy Electric
- Federal Cables
- Fujikura
- HELUKABEL MiddleEast
- Jeddah Cables
- KEI Industries
- Midal Cables
- Naficon
- Nexans
- NIBE Industrier AB
- NKT A/S
- Power Plus Cables
- Prysmian Group
- Riyadh Cables
- Saudi Cable Company
- Sumitomo Electric Industries
- ZTT
The Global Low Voltage Wire And Cable Market reached USD 145.7 billion in 2024 and is projected to expand at a CAGR of 7.2% from 2025 to 2034. This growth is driven by rapid urbanization, industrialization, and increasing investments in smart city initiatives worldwide. Governments and private sector players are directing substantial funds toward advanced electrical networks, automation systems, and renewable energy projects, fueling demand for reliable low voltage cabling solutions. As smart grids and distributed energy systems gain traction, manufacturers are actively developing innovative solutions to meet evolving industry needs.
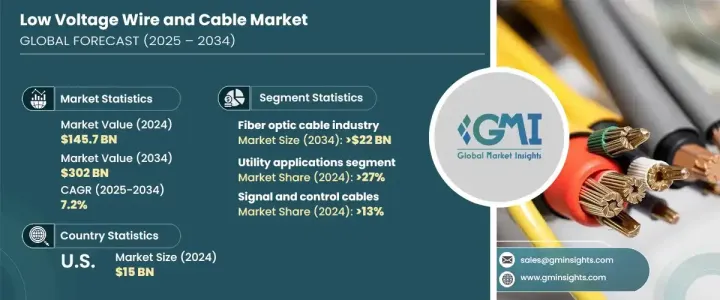
The rising emphasis on infrastructure development, particularly in emerging economies, is a key catalyst for market expansion. As cities modernize and industries adopt automation, the need for efficient power transmission solutions is escalating. Countries across Asia-Pacific, the Middle East, and Latin America are prioritizing electrification projects to support growing populations and economic activities. Additionally, stringent energy regulations and sustainability initiatives are prompting a shift toward environmentally friendly, high-efficiency cabling systems. Smart buildings, IoT integration, and electric vehicle charging networks further contribute to the increasing adoption of low voltage cables.
| Market Scope | |
|---|---|
| Start Year | 2024 |
| Forecast Year | 2025-2034 |
| Start Value | $145.7 Billion |
| Forecast Value | $302 Billion |
| CAGR | 7.2% |
Market segmentation highlights the diverse applications of low voltage wires and cables. Among the various product types, power, communication, and control cables hold a significant share. Signal and control cables accounted for 13% of the market in 2024, largely due to their expanding role in intelligent building systems. The growing demand for automation in residential and commercial spaces, particularly for HVAC, lighting, and security applications, is propelling the adoption of these products. Builders and developers are integrating advanced cabling systems into modern infrastructure, ensuring seamless connectivity and operational efficiency.
Utility applications held a 27% market share in 2024, with robust growth anticipated over the next decade. The ongoing transition to renewable energy sources is amplifying the need for high-performance power cables to facilitate the integration of solar and wind energy into existing grids. As governments worldwide push for increased renewable energy adoption, grid stability and efficiency remain critical concerns. Reliable low voltage wiring solutions are essential for ensuring uninterrupted power distribution and enhancing the resilience of modern energy infrastructure.
U.S. low voltage wire and cable industry was valued at USD 15 billion in 2024, with North America witnessing continuous investments in upgrading aging electrical infrastructure. The U.S. government allocated over USD 2 billion in 2024 to modernize grid systems and accommodate rising energy demands. This funding is driving substantial improvements in power transmission and distribution networks, accelerating the need for advanced low voltage cables. As the energy sector continues to evolve, sustained investments in electrification and infrastructure upgrades are expected to support long-term market expansion across the region.
Table of Contents
Chapter 1 Methodology & Scope
- 1.1 Market definitions
- 1.2 Base estimates & calculations
- 1.3 Forecast calculation
- 1.4 Data sources
- 1.4.1 Primary
- 1.4.2 Secondary
- 1.4.2.1 Paid
- 1.4.2.2 Public
Chapter 2 Executive Summary
- 2.1 Industry synopsis, 2021 - 2034
Chapter 3 Industry Insights
- 3.1 Industry ecosystem analysis
- 3.2 Regulatory landscape
- 3.3 Industry impact forces
- 3.3.1 Growth drivers
- 3.3.2 Industry pitfalls & challenges
- 3.4 Growth potential analysis
- 3.5 Porter's analysis
- 3.5.1 Bargaining power of suppliers
- 3.5.2 Bargaining power of buyers
- 3.5.3 Threat of new entrants
- 3.5.4 Threat of substitutes
- 3.6 PESTEL analysis
Chapter 4 Competitive landscape, 2024
- 4.1 Strategic dashboard
- 4.2 Innovation & technology landscape
Chapter 5 Market Size and Forecast, By Product, 2021 – 2034 (USD Million)
- 5.1 Key trends
- 5.2 Coaxial cables/electronic wires
- 5.3 Fiber optics cables
- 5.4 Power cables
- 5.5 Signal & control cable
- 5.6 Telecom & data cables
Chapter 6 Market Size and Forecast, By Application, 2021 – 2034 (USD Million)
- 6.1 Key trends
- 6.2 Food & beverages
- 6.3 Automotive
- 6.4 Material handling/logistics
- 6.5 Entertainment/leisure
- 6.6 Utilities
- 6.7 Railways
- 6.8 Consumer electronics
- 6.9 Building infrastructure
- 6.10 Others
Chapter 7 Market Size and Forecast, By Region, 2021 – 2034 (MWh & USD Million)
- 7.1 Key trends
- 7.2 North America
- 7.2.1 U.S.
- 7.2.2 Canada
- 7.2.3 Mexico
- 7.3 Europe
- 7.3.1 UK
- 7.3.2 France
- 7.3.3 Netherlands
- 7.3.4 Italy
- 7.3.5 Spain
- 7.3.6 Sweden
- 7.3.7 Denmark
- 7.3.8 Belgium
- 7.3.9 Germany
- 7.3.10 Russia
- 7.4 Asia Pacific
- 7.4.1 China
- 7.4.2 India
- 7.4.3 Japan
- 7.4.4 South Korea
- 7.4.5 Australia
- 7.4.6 Indonesia
- 7.4.7 Philippines
- 7.4.8 New Zealand
- 7.4.9 Malaysia
- 7.4.10 Thailand
- 7.5 Middle East & Africa
- 7.5.1 Saudi Arabia
- 7.5.2 UAE
- 7.5.3 Iraq
- 7.5.4 Kuwait
- 7.5.5 Qatar
- 7.5.6 South Africa
- 7.5.7 Egypt
- 7.5.8 Nigeria
- 7.6 Latin America
- 7.6.1 Brazil
- 7.6.2 Argentina
- 7.6.3 Peru
Chapter 8 Company Profiles
- 8.1 alfanar Group
- 8.2 Bahra Cables
- 8.3 BELDEN
- 8.4 Brugg Kabel AG
- 8.5 Ducab
- 8.6 Elsewedy Electric
- 8.7 Federal Cables
- 8.8 Fujikura
- 8.9 HELUKABEL MiddleEast
- 8.10 Jeddah Cables
- 8.11 KEI Industries
- 8.12 Midal Cables
- 8.13 Naficon
- 8.14 Nexans
- 8.15 NIBE Industrier AB
- 8.16 NKT A/S
- 8.17 Power Plus Cables
- 8.18 Prysmian Group
- 8.19 Riyadh Cables
- 8.20 Saudi Cable Company
- 8.21 Sumitomo Electric Industries
- 8.22 ZTT