|
시장보고서
상품코드
1698606
태양광 추적기 시장 - 기회, 성장 촉진요인, 산업 동향 분석, 예측(2025-2034년)Solar Tracker Market Opportunity, Growth Drivers, Industry Trend Analysis, and Forecast 2025-2034 |
||||||
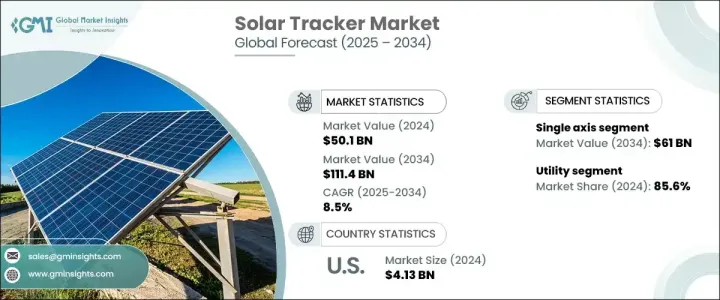
세계의 태양광 추적기 시장 규모는 2024년 501억 달러로, 2025년부터 2034년까지 연평균 복합 성장률(CAGR) 8.5%로 성장할 것으로 예측됩니다.
태양광 발전 시스템의 효율 향상과 태양광 추적기의 비용 저하가 합쳐 업계의 성장을 견인하고 있습니다. 단축 트래커를 탑재한 이면식 태양전지 모듈의 채용이 증가하고 있어 기존 단면식 시스템에 비해 전력 요금의 평준화 코스트를 약 16% 삭감할 수 있을 것으로 예상되어, 제품 수요를 한층 더 촉진하고 있습니다.
시장은 또한 에너지 저장 솔루션의 통합, 하이브리드 태양 추적 시스템의 출현, 환경에 미치는 영향을 최소화하기 위해 친환경 재료를 사용함으로써 혜택을 받고 있습니다.
| 시장 범위 | |
|---|---|
| 시작 연도 | 2024년 |
| 예측 연도 | 2025-2034년 |
| 시작 금액 | 501억 달러 |
| 예측 금액 | 1,114억 달러 |
| CAGR | 8.5% |
제품별로는 단축 트래커와 2축 트래커로 분류됩니다. 단축 트래커는 고정 틸트 시스템에 비해 25-35%의 효율 향상을 실현하여 2034년까지 610억 달러 이상을 창출할 것으로 예측되고 있습니다. 재료와 설계의 진보에 의해 신뢰성이 향상되어, 유지관리 비용의 삭감과 수명의 연장이 실현되고, 제품의 채용이 진행되고 있습니다.
시장은 주택용, 상업·공업용, 유틸리티용으로 구분됩니다. 복수 세대가 태양광 추적 시스템을 공유하는 커뮤니티 솔라 프로젝트의 인기가 상승하는 것이 부문 확대에 기여하고 있으며, 스마트 홈 기술과의 통합이 진행됨에 따라 주택 소유자가 에너지 소비를 보다 효과적으로 감시 및 최적화할 수 있게 되어 시장 성장을 가속하고 있습니다.
지역별 분석에서 미국의 태양광 추적기 시장은 2022년 26억 달러, 2023년 41억 달러, 2024년에는 41억 3,000만 달러를 기록했습니다. 2024년에 세계 시장 점유율의 8.5% 이상을 차지했으며, 이는 유리한 정책, 풍부한 태양광 자원, 대규모 유틸리티의 확대가 원동력이 되고 있습니다. 우대 조치와 주거용 용도을 위한 트래커를 보다 저렴한 가격으로 사용하기 쉽게 하는 지속적인 기술 혁신이 업계 전망을 강화할 것으로 예상됩니다.
목차
제1장 조사 방법과 조사 범위
- 조사 디자인
- 기본 추정과 계산
- 예측 모델
- 1차 조사와 검증
- 시장 정의
제2장 주요 요약
제3장 업계 인사이트
- 업계 에코시스템
- 규제 상황
- 업계에 미치는 영향요인
- 성장 촉진요인
- 업계의 잠재적 위험 및 과제
- 성장 가능성 분석
- 가격 동향 분석
- Porter's Five Forces 분석
- PESTEL 분석
제4장 경쟁 구도
- 소개
- 전략 대시보드
- 혁신과 기술의 전망
제5장 시장 규모와 예측 : 제품별, 2021-2034년
- 주요 동향
- 단일축
- 수평축
- 수직축
- 2축
제6장 시장 규모와 예측 : 기술별, 2021-2034년
- 주요 동향
- 태양광 발전
- CSP
제7장 시장 규모와 예측 : 용도별, 2021-2034년
- 주요 동향
- 주택
- 상업 및 산업
- 유틸리티
제8장 시장 규모와 예측 : 지역별, 2021-2034년
- 주요 동향
- 북미
- 미국
- 캐나다
- 멕시코
- 유럽
- 영국
- 프랑스
- 네덜란드
- 독일
- 스웨덴
- 스페인
- 오스트리아
- 아시아태평양
- 중국
- 일본
- 한국
- 인도
- 호주
- 인도네시아
- 말레이시아
- 싱가포르
- 태국
- 뉴질랜드
- 필리핀
- 베트남
- 중동
- 사우디아라비아
- 아랍에미리트(UAE)
- 요르단
- 이스라엘
- 아프리카
- 남아프리카
- 이집트
- 알제리
- 나이지리아
- 모로코
- 라틴아메리카
- 브라질
- 칠레
제9장 기업 프로파일
- ArcelorMittal
- Array Technologies
- Arctech
- All Earth Renewables
- Convert Italia
- Degerenergie
- GameChange Solar
- Gonvarri Solar Steel
- Haosolar
- Ideematec
- Mecasolar
- Nclave
- Nextracker
- Powerway Renewable Energy
- PVHardware
- Scorpius Trackers
- SmartTrak Solar Systems
- Soltec
- STI Norland
- SunPower Corporation
- Trina Solar
The Global Solar Tracker Market was valued at USD 50.1 billion in 2024 and is projected to grow at a CAGR of 8.5% from 2025 to 2034. The increasing efficiency of solar power systems, coupled with the declining costs of solar trackers, is driving industry growth. These systems enhance solar panel performance, with single-axis trackers boosting energy output by 10-25% and dual-axis trackers by up to 40% compared to fixed-tilt installations. The integration of smart grid technologies and IoT allows for improved monitoring, control, and optimization of energy production, accelerating market expansion. The rising adoption of bifacial solar modules with single-axis trackers is expected to reduce the levelized cost of electricity by around 16% compared to traditional monofacial systems, further fueling product demand. Ongoing advancements in solar tracker technology are reshaping the industry by lowering costs, enhancing efficiency, and increasing the accessibility of solar energy across multiple applications.

The market is also benefiting from the integration of energy storage solutions, the emergence of hybrid solar tracking systems, and the use of eco-friendly materials to minimize environmental impact. Supportive regulatory policies, incentive programs, and government initiatives such as the U.S. Inflation Reduction Act and Australia's Solar Sunshot program are expected to strengthen business prospects.
| Market Scope | |
|---|---|
| Start Year | 2024 |
| Forecast Year | 2025-2034 |
| Start Value | $50.1 Billion |
| Forecast Value | $111.4 Billion |
| CAGR | 8.5% |
By product, the market is categorized into single-axis and dual-axis trackers. Single-axis trackers are projected to generate over USD 61 billion by 2034, offering an efficiency increase of 25-35% compared to fixed-tilt systems. Advancements in materials and design have improved reliability, reducing maintenance costs and extending lifespan, which enhances product adoption. Additionally, higher energy yields and efficiency improvements lead to better returns on investment, strengthening the industry landscape.
The market is segmented into residential, commercial & industrial, and utility applications. In 2024, the utility sector held an 85.6% share of the market. The growing popularity of community solar projects, where multiple households benefit from shared solar tracking systems, is contributing to segment expansion. Increasing integration with smart home technologies is also enabling homeowners to monitor and optimize energy consumption more effectively, fostering market growth.
In regional analysis, the U.S. solar tracker market recorded values of USD 2.6 billion in 2022, USD 4.1 billion in 2023, and USD 4.13 billion in 2024. North America held over 8.5% of the global market share in 2024, driven by favorable policies, abundant solar resources, and the expansion of large-scale utility projects. Federal and state incentives, along with continuous innovations aimed at making trackers more affordable and user-friendly for residential applications, are expected to reinforce the industry outlook. The ongoing development of cost-effective tracking solutions, alongside increasing investments in solar infrastructure, will continue to create significant growth opportunities across the region.
Table of Contents
Chapter 1 Methodology & Scope
- 1.1 Research Design
- 1.2 Base estimates & calculations
- 1.3 Forecast model
- 1.4 Primary research & validation
- 1.4.1 Primary sources
- 1.4.2 Data mining sources
- 1.5 Market definitions
Chapter 2 Executive Summary
- 2.1 Industry 3600 synopsis, 2021 – 2034
Chapter 3 Industry Insights
- 3.1 Industry ecosystem
- 3.2 Regulatory landscape
- 3.3 Industry impact forces
- 3.3.1 Growth drivers
- 3.3.2 Industry pitfalls & challenges
- 3.4 Growth potential analysis
- 3.5 Price trend analysis
- 3.6 Porter's analysis
- 3.6.1 Bargaining power of suppliers
- 3.6.2 Bargaining power of buyers
- 3.6.3 Threat of new entrants
- 3.6.4 Threat of substitutes
- 3.7 PESTEL analysis
Chapter 4 Competitive landscape, 2024
- 4.1 Introduction
- 4.2 Strategic dashboard
- 4.3 Innovation & technology landscape
Chapter 5 Market Size and Forecast, By Product, 2021 – 2034 (USD Billion & MW)
- 5.1 Key trends
- 5.2 Single axis
- 5.2.1 Horizontal
- 5.2.2 Vertical
- 5.3 Dual axis
Chapter 6 Market Size and Forecast, By Technology, 2021 – 2034 (USD Billion & MW)
- 6.1 Key trends
- 6.2 PV
- 6.3 CSP
Chapter 7 Market Size and Forecast, By Application, 2021 – 2034 (USD Billion & MW)
- 7.1 Key trends
- 7.2 Residential
- 7.3 Commercial & industrial
- 7.4 Utility
Chapter 8 Market Size and Forecast, By Region, 2021 – 2034 (USD Billion & MW)
- 8.1 Key trends
- 8.2 North America
- 8.2.1 U.S.
- 8.2.2 Canada
- 8.2.3 Mexico
- 8.3 Europe
- 8.3.1 UK
- 8.3.2 France
- 8.3.3 Netherlands
- 8.3.4 Germany
- 8.3.5 Sweden
- 8.3.6 Spain
- 8.3.7 Austria
- 8.4 Asia Pacific
- 8.4.1 China
- 8.4.2 Japan
- 8.4.3 South Korea
- 8.4.4 India
- 8.4.5 Australia
- 8.4.6 Indonesia
- 8.4.7 Malaysia
- 8.4.8 Singapore
- 8.4.9 Thailand
- 8.4.10 New Zealand
- 8.4.11 Philippines
- 8.4.12 Vietnam
- 8.5 Middle East
- 8.5.1 Saudi Arabia
- 8.5.2 UAE
- 8.5.3 Jordan
- 8.5.4 Israel
- 8.6 Africa
- 8.6.1 South Africa
- 8.6.2 Egypt
- 8.6.3 Algeria
- 8.6.4 Nigeria
- 8.6.5 Morocco
- 8.7 Latin America
- 8.7.1 Brazil
- 8.7.2 Chile
Chapter 9 Company Profiles
- 9.1 ArcelorMittal
- 9.2 Array Technologies
- 9.3 Arctech
- 9.4 All Earth Renewables
- 9.5 Convert Italia
- 9.6 Degerenergie
- 9.7 GameChange Solar
- 9.8 Gonvarri Solar Steel
- 9.9 Haosolar
- 9.10 Ideematec
- 9.11 Mecasolar
- 9.12 Nclave
- 9.13 Nextracker
- 9.14 Powerway Renewable Energy
- 9.15 PVHardware
- 9.16 Scorpius Trackers
- 9.17 SmartTrak Solar Systems
- 9.18 Soltec
- 9.19 STI Norland
- 9.20 SunPower Corporation
- 9.21 Trina Solar