|
시장보고서
상품코드
1699325
상업용 와이어 및 케이블 시장 기회, 성장 촉진요인, 산업 동향 분석, 예측(2025-2034년)Commercial Wire and Cable Market Opportunity, Growth Drivers, Industry Trend Analysis, and Forecast 2025-2034 |
||||||
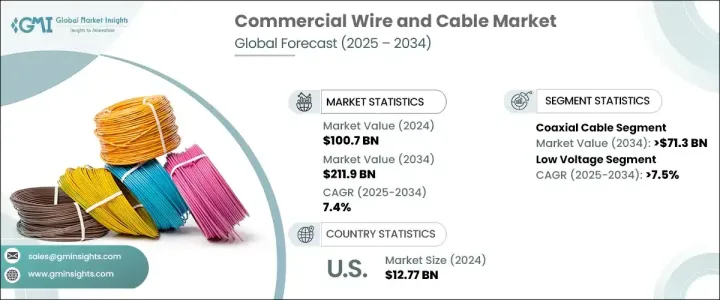
세계의 상업용 와이어 및 케이블 시장은 2024년에 1,007억 달러에 이르렀으며, 2025년부터 2034년까지의 CAGR은 7.4%를 나타낼 것으로 예측되어 큰 성장이 예상되고 있습니다.
이 시장 확대의 원동력이 되고 있는 것은 각 업계에 있어서의 급속한 상업화이며, 고품질의 와이어 및 케이블 솔루션 수요에 박차를 가하고 있습니다. 고도의 접속 솔루션에의 의존의 고조, 인프라 개발 프로젝트 증가, 엄격한 규제 기준에 의해 시장 관계자는 경쟁 구도에서 우위에 서기 위해 생산 능력을 강화해, 신제품을 혁신할 필요에 강요되고 있습니다.

통신 부문은 계속해서 상업용 와이어 및 케이블 시장 수요를 크게 촉진하고 있습니다. 광섬유 케이블 분야만으로도, 2034년까지 400억 달러의 매출이 전망되고 있어, 이것은 통신 및 상업 분야에 있어서의 신뢰성이 높은 고속 접속에 대한 요구 증가가 요인이 되고 있습니다. 네트워크 업그레이드에 매년 평균 500억 달러를 투자하고 있으며, 상업용 와이어 및 케이블 솔루션의 중요성이 높아지고 있습니다.
| 시장 범위 | |
|---|---|
| 시작 연도 | 2024년 |
| 예측 연도 | 2025-2034년 |
| 시작 금액 | 1,007억 달러 |
| 예측 금액 | 2,119억 달러 |
| CAGR | 7.4% |
전압별로 보면 저전압 분야는 2034년까지 연평균 복합 성장률(CAGR) 7.5%를 나타낼 것으로 예측되고 있으며, 이는 주로 인프라 개발 프로젝트에 있어서의 와이어 및 케이블 수요 증가에 의한 것입니다. 2023년에는 중국에서만 전력망 건설 프로젝트에 590억 달러가 할당되었으며 미래의 도시화 및 산업 발전에 전력을 공급하는 상업용 와이어 및 케이블의 중요한 역할이 강조되었습니다.
미국의 상업용 와이어 및 케이블 시장은 2024년에 127억 7,000만 달러로 평가되었으며, 전기 인프라에 대한 많은 투자로 안정적인 성장이 예상됩니다. 재생 에너지 도입에 대한 중국의 강력한 추진은 첨단 와이어 및 케이블 솔루션에 대한 수요를 더욱 촉진하고 있습니다.
목차
제1장 조사 방법과 조사 범위
- 시장의 정의
- 기본 추정과 계산
- 예측 계산
- 데이터 소스
제2장 주요 요약
제3장 업계 인사이트
- 생태계 분석
- 규제 상황
- 업계에 미치는 영향요인
- 성장 촉진요인
- 업계의 잠재적 위험 및 과제
- 성장 가능성 분석
- Porter's Five Forces 분석
- PESTEL 분석
제4장 경쟁 구도
- 전략 대시보드
- 혁신과 지속가능성의 전망
제5장 시장 규모와 예측 : 제품별(2021-2034년)
- 주요 동향
- 동축 케이블/전자 와이어
- 광섬유 케이블
- 신호 및 제어 케이블
- 통신 및 데이터 케이블
- 기타
제6장 시장 규모와 예측 : 전압별(2021-2034년)
- 주요 동향
- 낮음
- 중간
제7장 시장 규모와 예측 : 용도별(2021-2034년)
- 주요 동향
- 자재취급/물류
- 엔터테인먼트/레저
- 가전제품
- 빌딩 인프라
- 기타
제8장 시장 규모와 예측 : 지역별(2021-2034년)
- 주요 동향
- 북미
- 미국
- 캐나다
- 멕시코
- 유럽
- 영국
- 프랑스
- 네덜란드
- 이탈리아
- 스페인
- 독일
- 러시아
- 아시아태평양
- 중국
- 인도
- 일본
- 한국
- 호주
- 중동 및 아프리카
- 사우디아라비아
- 아랍에미리트(UAE)
- 카타르
- 쿠웨이트
- 남아프리카
- 이집트
- 라틴아메리카
- 브라질
- 아르헨티나
- 페루
제9장 기업 프로파일
- Bergen Cable Technology
- Belden Inc.
- FURUKAWA ELECTRIC CO., LTD.
- Havell India Ltd.
- KEI Industries Limited
- Klaus Faber AG
- LS Cables
- Leoni Cables
- NKT A/S
- Polycab
- Prysmian Group
- RR Kabel
- Riyadh Cables
- Sumitomo Electric Industries, Ltd.
- Southwire Company LLC
- Top Cables
- Thermo Cables
- ZM Cables
The Global Commercial Wire And Cable Market reached USD 100.7 billion in 2024 and is poised for significant growth, with projections indicating a CAGR of 7.4% between 2025 and 2034. This expansion is driven by rapid commercialization across industries, fueling the demand for high-quality wire and cable solutions. As urbanization and industrialization accelerate, businesses are investing heavily in electrical infrastructure to support their operations. The increasing reliance on advanced connectivity solutions, rising infrastructure development projects, and stringent regulatory standards are prompting market players to enhance their production capabilities and innovate new product offerings to stay ahead in the competitive landscape.
The telecommunications sector continues to be a significant driver of demand in the commercial wire and cable market. The fiber optics cable segment alone is expected to generate USD 40 billion by 2034, fueled by the rising need for reliable and high-speed connectivity in telecommunications and commercial sectors. Over the past decade, the telecom industry has invested an average of USD 50 billion annually in upgrading networks, reinforcing the importance of commercial wire and cable solutions. Companies operating in this sector are allocating substantial resources to enhance production capacity and meet growing industry requirements, further solidifying market expansion over the coming years.
| Market Scope | |
|---|---|
| Start Year | 2024 |
| Forecast Year | 2025-2034 |
| Start Value | $100.7 Billion |
| Forecast Value | $211.9 Billion |
| CAGR | 7.4% |
Based on voltage, the low voltage segment is projected to grow at a CAGR of 7.5% by 2034, primarily driven by the increasing demand for wire and cable in infrastructure development projects. Governments and private enterprises worldwide are investing heavily in electrical grid modernization, contributing to market expansion. In 2023, China alone allocated USD 59 billion for electric power grid construction projects, emphasizing the critical role of commercial wire and cable in powering the future of urbanization and industrial advancements.
The U.S. commercial wire and cable market, valued at USD 12.77 billion in 2024, is set to witness steady growth owing to substantial investments in electrical infrastructure. In 2022, the U.S. invested approximately USD 89 billion in electricity networks, marking one of the highest expenditures in recent years. The country's strong push towards renewable energy adoption further drives the demand for advanced wire and cable solutions. North America is positioning itself as a leader in energy transition, enhancing the market potential for commercial wire and cable manufacturers.
Table of Contents
Chapter 1 Methodology & Scope
- 1.1 Market definitions
- 1.2 Base estimates & calculations
- 1.3 Forecast calculation
- 1.4 Data sources
- 1.4.1 Primary
- 1.4.2 Secondary
- 1.4.2.1 Paid
- 1.4.2.2 Public
Chapter 2 Executive Summary
- 2.1 Industry synopsis, 2021 - 2034
Chapter 3 Industry Insights
- 3.1 Industry ecosystem analysis
- 3.2 Regulatory landscape
- 3.3 Industry impact forces
- 3.3.1 Growth drivers
- 3.3.2 Industry pitfalls & challenges
- 3.4 Growth potential analysis
- 3.5 Porter's analysis
- 3.5.1 Bargaining power of suppliers
- 3.5.2 Bargaining power of buyers
- 3.5.3 Threat of new entrants
- 3.5.4 Threat of substitutes
- 3.6 PESTEL analysis
Chapter 4 Competitive landscape, 2024
- 4.1 Strategic dashboard
- 4.2 Innovation & sustainability landscape
Chapter 5 Market Size and Forecast, By Product, 2021 – 2034 (USD Million)
- 5.1 Key trends
- 5.2 Coaxial Cables/Electronic Wires
- 5.3 Fiber optics cables
- 5.4 Signal & Control cable
- 5.5 Telecom & data cables
- 5.6 Others
Chapter 6 Market Size and Forecast, By Voltage 2021 – 2034 (USD Million)
- 6.1 Key trends
- 6.2 Low
- 6.3 Medium
Chapter 7 Market Size and Forecast, By Application 2021 – 2034 (USD Million)
- 7.1 Key trends
- 7.2 Material Handling/Logistics
- 7.3 Entertainment/Leisure
- 7.4 Consumer electronics
- 7.5 Building infrastructure
- 7.6 Others
Chapter 8 Market Size and Forecast, By Region, 2021 – 2034 (USD Million)
- 8.1 Key trends
- 8.2 North America
- 8.2.1 U.S.
- 8.2.2 Canada
- 8.2.3 Mexico
- 8.3 Europe
- 8.3.1 UK
- 8.3.2 France
- 8.3.3 Netherlands
- 8.3.4 Italy
- 8.3.5 Spain
- 8.3.6 Germany
- 8.3.7 Russia
- 8.4 Asia Pacific
- 8.4.1 China
- 8.4.2 India
- 8.4.3 Japan
- 8.4.4 South Korea
- 8.4.5 Australia
- 8.5 Middle East & Africa
- 8.5.1 Saudi Arabia
- 8.5.2 UAE
- 8.5.3 Qatar
- 8.5.4 Kuwait
- 8.5.5 South Africa
- 8.5.6 Egypt
- 8.6 Latin America
- 8.6.1 Brazil
- 8.6.2 Argentina
- 8.6.3 Peru
Chapter 9 Company Profiles
- 9.1 Bergen Cable Technology
- 9.2 Belden Inc.
- 9.3 FURUKAWA ELECTRIC CO., LTD.
- 9.4 Havell India Ltd.
- 9.5 KEI Industries Limited
- 9.6 Klaus Faber AG
- 9.7 LS Cables
- 9.8 Leoni Cables
- 9.9 NKT A/S
- 9.10 Polycab
- 9.11 Prysmian Group
- 9.12 RR Kabel
- 9.13 Riyadh Cables
- 9.14 Sumitomo Electric Industries, Ltd.
- 9.15 Southwire Company LLC
- 9.16 Top Cables
- 9.17 Thermo Cables
- 9.18 ZM Cables