|
시장보고서
상품코드
1699387
항공용 가스 터빈 시장 기회, 성장 촉진요인, 산업 동향 분석 및 예측(2025-2034년)Aeroderivative Gas Turbine Market Opportunity, Growth Drivers, Industry Trend Analysis, and Forecast 2025-2034 |
||||||
항공용 가스 터빈 세계 시장은 2024년에 34억 달러에 달했으며, 2025-2034년 5.9%의 연평균 복합 성장률(CAGR)을 반영하여 2034년에는 61억 달러에 달할 것으로 예상됩니다.
에너지 효율 표준에 대한 중요성이 높아지고 재생 가능 에너지원의 통합으로 전환되면서 이러한 터빈의 채택이 촉진되고 있습니다. 천연가스 보급 및 채굴에 대한 대규모 투자와 세계 에너지 소비 증가는 시장 성장에 기여하고 있습니다. 또한, 마이크로그리드 인프라의 확대와 대규모 화력 발전소의 자본 비용 절감에 대한 관심이 높아짐에 따라 이러한 터빈에 대한 수요가 증가하고 있습니다. 피크 부하 및 백업 전원 시나리오에서 효율적으로 작동할 수 있을 뿐만 아니라, 연료의 유연성과 짧은 시동 시간으로 인해 그리드 전원과 독립 전원 시스템 모두에 매우 적합합니다.

디지털 트윈 기술, AI를 활용한 예지보전, 재생에너지원과 터빈의 원활한 통합과 같은 기술 발전은 이러한 시스템의 성능과 운영 효율을 향상시키고 있습니다. 에너지 안보, 비용 효율성, 지속가능성에 대한 관심이 높아지면서 이러한 제품의 보급 확대에 유리한 사업 환경이 조성되고 있습니다. 빠른 시동과 안정적인 발전이 가능한 항공용 가스 터빈은 다양하고 신뢰할 수 있는 에너지 솔루션을 제공함으로써 경쟁이 치열하고 빠르게 변화하는 시장에서 매력적인 제품으로 자리매김하고 있습니다.
| 시장 범위 | |
|---|---|
| 시작 연도 | 2024년 |
| 예측 연도 | 2025-2034년 |
| 시작 금액 | 34억 달러 |
| 예상 금액 | 61억 달러 |
| CAGR | 5.9% |
시장은 용량별로 50kW 이하, 50-500kW, 500kW-1MW, 1-30MW, 30-70MW, 70MW 이상으로 구분됩니다. 용량 50kW 부문은 2034년까지 연평균 복합 성장률(CAGR)이 6%를 상회할 것으로 예상됩니다. 이 부문은 그리드 연결이 제한된 지역에서 안정적인 전력 공급을 보장하는 분산형 에너지 시스템에 대한 수요가 증가함에 따라 원격지 및 산업 분야에서 견인력을 얻고 있습니다.
기술별로 보면, 시장은 오픈 사이클 시스템과 복합 사이클 시스템으로 나뉩니다. 오픈 사이클 부문은 산업계 전반에서 분산형 발전에 대한 관심이 높아짐에 따라 2024년 전체 매출의 12.3% 이상을 차지할 것으로 예상됩니다. 연료 효율을 개선하고 엄격한 배출 규제를 준수하기 위한 터빈 기술의 지속적인 발전은 이 부문을 더욱 강화시키고 있습니다. 한편, 복합화력 분야는 청정 대체 에너지로의 전환과 석탄 화력 발전소로부터의 탈피로 인해 2024년 87.7% 시장 점유율을 차지하며 시장을 장악할 것으로 예상됩니다.
용도에 따라 시장은 석유 및 가스, 발전소, 발전소, 공정 플랜트, 항공, 해양, 기타 부문으로 구분됩니다. 발전소 분야는 청정 에너지 솔루션으로의 전환과 전력망 안정성을 향상시키기 위해 재생 에너지 시스템에 가스 터빈을 통합하는 움직임이 활발해짐에 따라 2034년까지 20억 달러를 넘어설 것으로 예상됩니다. 석유 및 가스 부문은 급속한 산업 확장과 엄격한 에너지 효율 요구사항으로 인해 견고한 발전 시스템의 채택이 증가함에 따라 2034년까지 5.5% 이상의 CAGR로 성장할 것으로 예상됩니다.
미국의 항공용 가스 터빈 시장은 2022년 2억 6,790만 달러, 2023년 2억 3,810만 달러, 2024년 2억 5,470만 달러로 평가되었습니다. 기존 발전소에서 가스 터빈 기술로의 전환이 제품 채택을 촉진하는 한편, 이산화탄소 배출량 감소와 엄격한 환경 기준 준수에 대한 관심이 높아지면서 고효율 터빈에 대한 수요가 더욱 증가하고 있습니다. 북미 시장은 2034년까지 연평균 6% 이상 성장할 것으로 예상되며, 이는 산업 활동 증가와 운영 효율을 높이고 신뢰할 수 있는 전력 솔루션에 대한 수요 증가에 대응하기 위한 지속적인 기술 혁신에 힘입어 성장할 것으로 전망됩니다.
목차
제1장 조사 방법과 조사 범위
제2장 주요 요약
제3장 업계 인사이트
- 생태계 분석
- 규제 상황
- 업계에 대한 영향요인
- 성장 촉진요인
- 업계의 잠재적 리스크&과제
- 성장 가능성 분석
- Porter's Five Forces 분석
- PESTEL 분석
제4장 경쟁 구도
- 서론
- 전략적 전망
- 혁신과 지속가능성 전망
제5장 시장 규모와 예측 : 용량별, 2021년-2034년
- 주요 동향
- 50kW 이하
- 50-500kW
- 500kW-1MW
- 1-30MW
- 30-70MW
- 70MW 이상
제6장 시장 규모와 예측 : 기술별, 2021년-2034년
- 주요 동향
- 오픈 사이클
- 복합 사이클
제7장 시장 규모와 예측 : 용도별, 2021년-2034년
- 주요 동향
- 발전소
- 석유 및 가스
- 프로세스 플랜트
- 항공
- 해양
- 기타
제8장 시장 규모와 예측 : 지역별, 2021년-2034년
- 주요 동향
- 북미
- 미국
- 캐나다
- 멕시코
- 유럽
- 영국
- 프랑스
- 독일
- 러시아
- 이탈리아
- 네덜란드
- 덴마크
- 폴란드
- 스웨덴
- 아시아태평양
- 중국
- 호주
- 일본
- 한국
- 인도네시아
- 태국
- 말레이시아
- 중동 및 아프리카
- 사우디아라비아
- 아랍에미리트(UAE)
- 카타르
- 오만
- 이집트
- 튀르키예
- 이라크
- 남아프리카공화국
- 알제리
- 라틴아메리카
- 브라질
- 아르헨티나
- 칠레
제9장 기업 개요
- Ansaldo Energia
- Baker Hughes Company
- Capstone Green Energy
- Collins Aerospace
- Destinus Energy
- Doosan Enerbility
- General Electric
- Harbin Electric
- Honeywell International
- IHI Corporation
- Kawasaki Heavy Industries
- MAN Energy Solutions
- Mitsubishi Heavy Industries
- Nanjing Turbine &Electric Machinery
- Pratt &Whitney
- Rolls-Royce
- Safran
- Siemens Energy
- Vericor
- Wartsila
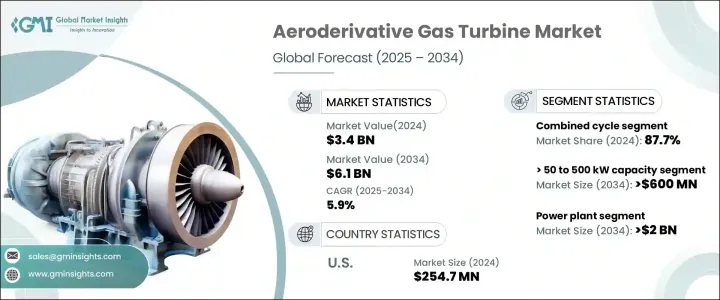
The Global Aeroderivative Gas Turbine Market reached USD 3.4 billion in 2024 and is projected to reach USD 6.1 billion by 2034, reflecting a CAGR of 5.9% between 2025 and 2034. Increasing emphasis on energy efficiency standards and the shift toward integrating renewable energy sources are driving the adoption of these turbines. Extensive investments in natural gas distribution and extraction, coupled with rising global energy consumption, are contributing to market growth. Additionally, the expansion of microgrid infrastructure and the growing preference for reducing capital costs of large-scale thermal power plants are expected to fuel demand for these turbines. Their ability to operate efficiently during peak load and backup power scenarios, along with their high fuel flexibility and low startup times, makes them highly suitable for both grid power and independent power systems.
Technological advancements such as digital twin technology, AI-powered predictive maintenance, and the seamless integration of turbines with renewable energy sources are enhancing the performance and operational efficiency of these systems. The growing emphasis on energy security, cost-efficiency, and sustainability is creating a favorable business environment for the increased penetration of these products. With their ability to deliver quick startups and reliable power generation, aeroderivative gas turbines offer a versatile and dependable energy solution, making them appealing in competitive and rapidly changing markets.
| Market Scope | |
|---|---|
| Start Year | 2024 |
| Forecast Year | 2025-2034 |
| Start Value | $3.4 Billion |
| Forecast Value | $6.1 Billion |
| CAGR | 5.9% |
The market is segmented by capacity into <= 50 kW, > 50 to 500 kW, > 500 kW to 1 MW, > 1 to 30 MW, > 30 to 70 MW, and > 70 MW. The 50 kW capacity segment is expected to witness a CAGR of over 6% through 2034. This segment is gaining traction in remote areas and industrial applications due to the increasing need for decentralized energy systems, ensuring stable power supply in areas with limited grid connectivity.
By technology, the market is divided into open cycle and combined cycle systems. The open cycle segment accounted for over 12.3% of total revenue in 2024, driven by the rising focus on decentralized power generation across industries. Ongoing advancements in turbine technology aimed at improving fuel efficiency and adhering to stringent emission norms are further strengthening this segment. Meanwhile, the combined cycle segment dominated the market with an 87.7% share in 2024, benefiting from the global shift toward cleaner energy alternatives and the transition away from coal-fired power plants.
Based on application, the market is segmented into oil and gas, power plants, process plants, aviation, marine, and other sectors. The power plant segment is projected to surpass USD 2 billion by 2034, driven by the increasing shift toward cleaner energy solutions and the incorporation of gas turbines into renewable energy systems to improve grid stability. The oil and gas sector is expected to grow at a CAGR of over 5.5% through 2034, as rapid industrial expansion and stringent energy efficiency requirements are driving the adoption of robust power generation systems.
The US aeroderivative gas turbine market was valued at USD 267.9 million in 2022, USD 238.1 million in 2023, and USD 254.7 million in 2024. The shift from traditional power plants to gas turbine technology is boosting product adoption, while a heightened focus on reducing carbon footprints and meeting strict environmental standards is further driving demand for these high-efficiency turbines. The North American market is anticipated to grow at a CAGR of over 6% through 2034, supported by increasing industrial activities and continuous technological innovations that enhance operational efficiency and meet the growing demand for reliable power solutions.
Table of Contents
Chapter 1 Methodology & Scope
- 1.1 Market scope & definitions
- 1.2 Market estimates & forecast parameters
- 1.3 Forecast calculation
- 1.4 Data sources
- 1.4.1 Primary
- 1.4.2 Secondary
- 1.4.2.1 Paid
- 1.4.2.2 Public
Chapter 2 Executive Summary
- 2.1 Industry synopsis, 2021 - 2034
Chapter 3 Industry Insights
- 3.1 Industry ecosystem analysis
- 3.2 Regulatory landscape
- 3.3 Industry impact forces
- 3.3.1 Growth drivers
- 3.3.2 Industry pitfalls & challenges
- 3.4 Growth potential analysis
- 3.5 Porter's Analysis
- 3.5.1 Bargaining power of suppliers
- 3.5.2 Bargaining power of buyers
- 3.5.3 Threat of new entrants
- 3.5.4 Threat of substitutes
- 3.6 PESTEL Analysis
Chapter 4 Competitive Landscape, 2024
- 4.1 Introduction
- 4.2 Strategic outlook
- 4.3 Innovation & sustainability landscape
Chapter 5 Market Size and Forecast, By Capacity, 2021 – 2034 (MW & USD Million)
- 5.1 Key trends
- 5.2 ≤ 50 kW
- 5.3 > 50 to 500 kW
- 5.4 > 500 kW to 1 MW
- 5.5 > 1 to 30 MW
- 5.6 > 30 to 70 MW
- 5.7 > 70 MW
Chapter 6 Market Size and Forecast, By Technology, 2021 – 2034 (MW & USD Million)
- 6.1 Key trends
- 6.2 Open cycle
- 6.3 Combined cycle
Chapter 7 Market Size and Forecast, By Application, 2021 – 2034 (MW & USD Million)
- 7.1 Key trends
- 7.2 Power plants
- 7.3 Oil & gas
- 7.4 Process plants
- 7.5 Aviation
- 7.6 Marine
- 7.7 Others
Chapter 8 Market Size and Forecast, By Region, 2021 – 2034 (MW & USD Million)
- 8.1 Key trends
- 8.2 North America
- 8.2.1 U.S.
- 8.2.2 Canada
- 8.2.3 Mexico
- 8.3 Europe
- 8.3.1 UK
- 8.3.2 France
- 8.3.3 Germany
- 8.3.4 Russia
- 8.3.5 Italy
- 8.3.6 Netherlands
- 8.3.7 Denmark
- 8.3.8 Poland
- 8.3.9 Sweden
- 8.4 Asia Pacific
- 8.4.1 China
- 8.4.2 Australia
- 8.4.3 Japan
- 8.4.4 South Korea
- 8.4.5 Indonesia
- 8.4.6 Thailand
- 8.4.7 Malaysia
- 8.5 Middle East & Africa
- 8.5.1 Saudi Arabia
- 8.5.2 UAE
- 8.5.3 Qatar
- 8.5.4 Oman
- 8.5.5 Egypt
- 8.5.6 Turkey
- 8.5.7 Iraq
- 8.5.8 South Africa
- 8.5.9 Algeria
- 8.6 Latin America
- 8.6.1 Brazil
- 8.6.2 Argentina
- 8.6.3 Chile
Chapter 9 Company Profiles
- 9.1 Ansaldo Energia
- 9.2 Baker Hughes Company
- 9.3 Capstone Green Energy
- 9.4 Collins Aerospace
- 9.5 Destinus Energy
- 9.6 Doosan Enerbility
- 9.7 General Electric
- 9.8 Harbin Electric
- 9.9 Honeywell International
- 9.10 IHI Corporation
- 9.11 Kawasaki Heavy Industries
- 9.12 MAN Energy Solutions
- 9.13 Mitsubishi Heavy Industries
- 9.14 Nanjing Turbine & Electric Machinery
- 9.15 Pratt & Whitney
- 9.16 Rolls-Royce
- 9.17 Safran
- 9.18 Siemens Energy
- 9.19 Vericor
- 9.20 Wartsila