|
시장보고서
상품코드
1708236
자율주행 버스 소프트웨어 시장 기회, 성장 촉진요인, 산업 동향 분석, 예측(2025-2034년)Autonomous Bus Software Market Opportunity, Growth Drivers, Industry Trend Analysis, and Forecast 2025 - 2034 |
||||||
세계의 자율주행 버스 소프트웨어 시장은 2024년에 8억 5,510만 달러로 평가되며, 2025-2034년에 24.2%의 CAGR이 예상되어 대폭적인 성장을 보일 것으로 예측됩니다.
이러한 견고한 시장 확대는 주로 공유 모빌리티 및 주문형 교통 서비스에 대한 수요 급증에 기인합니다. 소비자들이 유연하고 비용 효율적인 여행 솔루션을 찾는 경향이 높아지면서 자율주행 버스가 완벽한 대응책으로 떠오르고 있습니다. 이 버스는 고정된 경로에 의존하는 기존 대중교통 시스템과 달리 승객 수요 변화에 따라 경로를 조정하여 적응할 수 있습니다. 이러한 적응성을 통해 승객은 보다 편리하고 저렴한 교통 수단을 이용할 수 있으며, 자율주행 버스는 도시 이동에 이상적인 선택이 될 수 있습니다.

자율주행 버스 소프트웨어 시장은 차량 관리, 자율주행, 교통 관리, 승객 관리, 안전 및 보안, 버스 노선 설계 등의 기능을 기반으로 분류되며, 2024년에는 차량 관리 소프트웨어 부문이 27.8% 시장 점유율을 차지할 것으로 예측됩니다. 이 소프트웨어는 자율주행 버스의 운행 효율성을 높이는 데 필수적입니다. 실시간 원격 모니터링, IoT 기반 유지보수 예측, 연료 소비 추적, 노선 최적화를 통해 차량 관리 시스템은 버스 사업자의 생산성 향상, 다운타임 최소화, 원활한 운행을 가능하게 합니다.
| 시장 범위 | |
|---|---|
| 시작연도 | 2024년 |
| 예측연도 | 2025-2034년 |
| 시작 금액 | 8억 5,510만 달러 |
| 예상 금액 | 73억 달러 |
| CAGR | 24.2% |
또한 자율주행 버스 소프트웨어 시장은 자동화 수준, 레벨 3, 레벨 4, 레벨 5로 구분됩니다. 레벨 4 자율주행 버스는 2024년 시장 점유율의 43%를 차지할 것으로 예측됩니다. 이들 버스는 비즈니스 거리나 스마트 시티 등 미리 정의된 지역 내에서 완전 자율주행합니다. 고급 인공지능(AI), 머신러닝, 예측 분석을 활용하여 다양한 도로 상황과 교통 패턴을 탐색하므로 도시 환경에 매우 적합하며, AI 기술의 지속적인 개선으로 레벨 4 자율주행 버스의 채택은 특히 인구 밀도가 높은 대도시 지역에서 급증할 것으로 예측됩니다.
북미 자율주행 버스 소프트웨어 시장은 2024년 세계 시장 점유율의 38%를 차지할 것으로 예측됩니다. 이 지역의 자율주행 기술에 대한 투자와 정부의 지원 정책은 자율주행 버스의 개발 및 배치를 가속화하고 있습니다. 이미 몇몇 도시들이 시범 프로젝트를 시작했으며, 유망한 성과를 거두어 자율주행 버스 시스템 보급에 탄력을 받을 것으로 기대되고 있습니다. 이러한 버스가 대중교통에 통합되면 배출가스 감소, 교통 혼잡 완화, 도시 모빌리티의 전반적인 효율성이 향상될 것으로 기대되며, 이는 보다 지속가능하고 스마트한 교통 시스템을 향한 광범위한 추세와도 일치합니다.
목차
제1장 조사 방법과 조사 범위
제2장 개요
제3장 업계 인사이트
- 에코시스템 분석
- 공급업체 상황
- OEM
- 소프트웨어 프로바이더
- 클라우드 서비스 프로바이더
- 시스템 통합사업자
- 최종 용도
- 이익률 분석
- 테크놀러지와 혁신 전망
- 특허 분석
- 주요 뉴스와 구상
- 규제 상황
- 영향요인
- 촉진요인
- 공유 모빌리티와 온디맨드 교통에 대한 수요 증가
- 안전성과 교통 관리의 향상
- 일반 시민 의식과 수용의 증가
- 자율주행차에 대한 관심의 증가
- 업계의 잠재적 리스크 & 과제
- 규제와 법적 과제
- 높은 개발·운영 비용
- 촉진요인
- 성장 가능성 분석
- Porter의 산업 분석
- PESTEL 분석
제4장 경쟁 구도
- 서론
- 기업 점유율 분석
- 경쟁 포지셔닝 매트릭스
- 전략 전망 매트릭스
제5장 시장 추산·예측 : 기능별, 2021-2034년
- 주요 동향
- 플릿 관리 소프트웨어
- 자율주행
- 교통 관리
- 승객 관리
- 안전과 보안
- 버스 노선 설계
제6장 시장 추산·예측 : 자동화 레벨별, 2021-2034년
- 주요 동향
- 레벨 3
- 레벨 4
- 레벨 5
제7장 시장 추산·예측 : 배포 모델별, 2021-2034년
- 주요 동향
- 온프레미스
- 클라우드 기반
- 하이브리드
제8장 시장 추산·예측 : 용도별, 2021-2034년
- 주요 동향
- 대중교통
- 캠퍼스·기업 셔틀
- 공항 셔틀
- 기타
제9장 시장 추산·예측 : 최종 용도별, 2021-2034년
- 주요 동향
- 대중교통
- 민간 운송 사업자
- 기업 플릿
제10장 시장 추산·예측 : 지역별, 2021-2034년
- 주요 동향
- 북미
- 미국
- 캐나다
- 유럽
- 영국
- 독일
- 프랑스
- 스페인
- 이탈리아
- 러시아
- 북유럽
- 아시아태평양
- 중국
- 인도
- 일본
- 한국
- 뉴질랜드
- 동남아시아
- 라틴아메리카
- 브라질
- 멕시코
- 아르헨티나
- 중동 및 아프리카
- UAE
- 남아프리카공화국
- 사우디아라비아
제11장 기업 개요
- Aurora
- Baidu Apollo
- EasyMile
- Imagry
- ioki
- Karsan
- LILEE Systems
- May Mobility
- Mobileye
- Navya
- NVIDIA
- Oxa
- T-Hive
- Via Transportation
- Volvo Bus
The Global Autonomous Bus Software Market was valued at USD 855.1 million in 2024 and is projected to witness substantial growth, with an expected CAGR of 24.2% from 2025 to 2034. This robust market expansion is primarily driven by the surging demand for shared mobility and on-demand transportation services. As consumers increasingly seek flexible, cost-effective travel solutions, autonomous buses emerge as a perfect response. These buses adapt to shifting passenger demands by adjusting routes, unlike traditional public transit systems that rely on fixed paths. This adaptability ensures that passengers receive more convenient and affordable transportation options, positioning autonomous buses as an ideal choice for urban mobility.
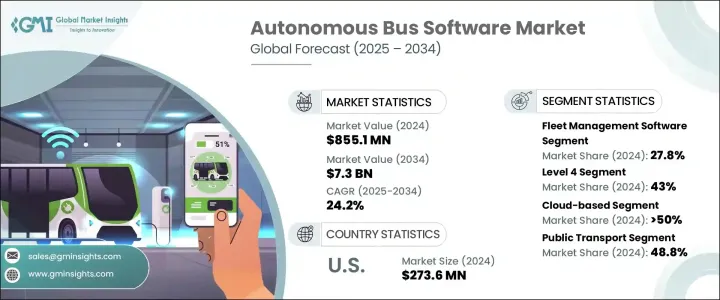
The market for autonomous bus software is categorized based on functionality, which includes fleet management, autonomous driving, traffic management, passenger management, safety and security, and bus route design. In 2024, the fleet management software segment accounted for a 27.8% market share. This software is essential in enhancing the operational efficiency of self-driving buses. Through real-time remote monitoring, IoT-based maintenance forecasting, fuel consumption tracking, and route optimization, fleet management systems enable bus operators to boost productivity, minimize downtime, and ensure smoother operations.
| Market Scope | |
|---|---|
| Start Year | 2024 |
| Forecast Year | 2025-2034 |
| Start Value | $855.1 Million |
| Forecast Value | $7.3 Billion |
| CAGR | 24.2% |
Further, the autonomous bus software market is segmented by automation levels-Level 3, Level 4, and Level 5 automation. The Level 4 autonomous buses held 43% of the market share in 2024. These buses are fully autonomous within predefined areas, such as business districts or smart cities. They leverage advanced artificial intelligence (AI), machine learning, and predictive analytics to navigate through varying road conditions and traffic patterns, making them highly suitable for urban environments. With the continued refinement of AI technologies, the adoption of Level 4 autonomous buses is expected to surge, especially in densely populated metropolitan areas.
North America Autonomous Bus Software Market accounted for 38% of the global market share in 2024. The region's investments in autonomous technology, coupled with supportive government policies, are accelerating the development and deployment of self-driving buses. Several cities are already launching pilot projects with promising results, which are expected to fuel the wider adoption of autonomous bus systems. As these buses become more integrated into public transportation, they offer the potential to reduce emissions, alleviate traffic congestion, and improve overall efficiency in urban mobility, aligning with the broader trend toward more sustainable, smart transportation systems.
Table of Contents
Chapter 1 Methodology & Scope
- 1.1 Research design
- 1.1.1 Research approach
- 1.1.2 Data collection methods
- 1.2 Base estimates and calculations
- 1.2.1 Base year calculation
- 1.2.2 Key trends for market estimates
- 1.3 Forecast model
- 1.4 Primary research & validation
- 1.4.1 Primary sources
- 1.4.2 Data mining sources
- 1.5 Market definitions
Chapter 2 Executive Summary
- 2.1 Industry 360º synopsis, 2021 - 2034
Chapter 3 Industry Insights
- 3.1 Industry ecosystem analysis
- 3.2 Supplier landscape
- 3.2.1 OEM
- 3.2.2 Software provider
- 3.2.3 Cloud service providers
- 3.2.4 System integrators
- 3.2.5 End Use
- 3.3 Profit margin analysis
- 3.4 Technology & innovation landscape
- 3.5 Patent analysis
- 3.6 Key news & initiatives
- 3.7 Regulatory landscape
- 3.8 Impact forces
- 3.8.1 Growth drivers
- 3.8.1.1 Rising demand for shared mobility and on-demand transport
- 3.8.1.2 Improved safety and traffic management
- 3.8.1.3 Growing public awareness and acceptance
- 3.8.1.4 Rising interest in autonomous vehicles
- 3.8.2 Industry pitfalls & challenges
- 3.8.2.1 Regulatory and legal challenges
- 3.8.2.2 High development and operational costs
- 3.8.1 Growth drivers
- 3.9 Growth potential analysis
- 3.10 Porter's analysis
- 3.11 PESTEL analysis
Chapter 4 Competitive Landscape, 2024
- 4.1 Introduction
- 4.2 Company market share analysis
- 4.3 Competitive positioning matrix
- 4.4 Strategic outlook matrix
Chapter 5 Market Estimates & Forecast, By Functionality, 2021 - 2034 ($Bn)
- 5.1 Key trends
- 5.2 Fleet management software
- 5.3 Autonomous driving
- 5.4 Traffic management
- 5.5 Passenger management
- 5.6 Safety & security
- 5.7 Bus route design
Chapter 6 Market Estimates & Forecast, By Level of Automation, 2021 - 2034 ($Bn)
- 6.1 Key trends
- 6.2 Level 3
- 6.3 Level 4
- 6.4 Level 5
Chapter 7 Market Estimates & Forecast, By Deployment Model, 2021 - 2034 ($Bn)
- 7.1 Key trends
- 7.2 On-premises
- 7.3 Cloud-based
- 7.4 Hybrid
Chapter 8 Market Estimates & Forecast, By Application, 2021 - 2034 ($Bn)
- 8.1 Key trends
- 8.2 Public transport
- 8.3 Campus and corporate shuttles
- 8.4 Airport shuttles
- 8.5 Others
Chapter 9 Market Estimates & Forecast, By End Use, 2021 - 2034 ($Bn)
- 9.1 Key trends
- 9.2 Public transportation authorities
- 9.3 Private transport operators
- 9.4 Corporate fleets
Chapter 10 Market Estimates & Forecast, By Region, 2021 - 2034 ($Bn)
- 10.1 Key trends
- 10.2 North America
- 10.2.1 U.S.
- 10.2.2 Canada
- 10.3 Europe
- 10.3.1 UK
- 10.3.2 Germany
- 10.3.3 France
- 10.3.4 Spain
- 10.3.5 Italy
- 10.3.6 Russia
- 10.3.7 Nordics
- 10.4 Asia Pacific
- 10.4.1 China
- 10.4.2 India
- 10.4.3 Japan
- 10.4.4 South Korea
- 10.4.5 ANZ
- 10.4.6 Southeast Asia
- 10.5 Latin America
- 10.5.1 Brazil
- 10.5.2 Mexico
- 10.5.3 Argentina
- 10.6 MEA
- 10.6.1 UAE
- 10.6.2 South Africa
- 10.6.3 Saudi Arabia
Chapter 11 Company Profiles
- 11.1 Aurora
- 11.2 Baidu Apollo
- 11.3 EasyMile
- 11.4 Imagry
- 11.5 ioki
- 11.6 Karsan
- 11.7 LILEE Systems
- 11.8 May Mobility
- 11.9 Mobileye
- 11.10 Navya
- 11.11 NVIDIA
- 11.12 Oxa
- 11.13 T-Hive
- 11.14 Via Transportation
- 11.15 Volvo Bus