


|
시장보고서
상품코드
1716598
비주류 포장 시장 기회, 성장 촉진요인, 산업 동향 분석 및 예측(2025-2034년)Non-alcoholic Beverage Packaging Market Opportunity, Growth Drivers, Industry Trend Analysis, and Forecast 2025 - 2034 |
||||||
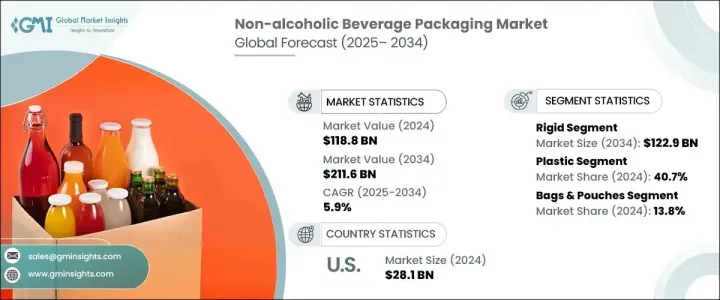
세계의 비주류 포장 시장은 2024년에 1,188억 달러에 달했고, 2025년부터 2034년까지 연평균 복합 성장률(CAGR) 5.9%를 나타낼 것으로 예측됩니다.
소비자 선호도가 더 건강한 음료 선택으로 전환함에 따라 혁신적이고 지속 가능한 포장 솔루션에 대한 수요가 높아지고 있습니다. 수수료, 본격적인 과즙 음료, 기능성 음료의 인기가 높아짐에 적극적으로 대응하고 있습니다.
건강 지향 소비자가 기능성 음료 수요를 견인하는 동안 브랜드는 제품의 매력과 지속가능성을 높이는 전략적 도구로 포장을 활용하게 되어 있습니다. 뿐만 아니라, 소비자의 기대에 부응하는 포장이 요구되고 있습니다.경량으로 재활용 가능한 소재, 생분해성 옵션, 지속 가능한 포장·이노베이션은 음료 제조업체가 편리성과 환경 책임의 밸런스를 추구하는 가운데 급속하게 보급되고 있습니다.
| 시장 범위 | |
|---|---|
| 시작 연도 | 2024년 |
| 예측 연도 | 2025-2034년 |
| 시작 금액 | 1,188억 달러 |
| 예측 금액 | 2,116억 달러 |
| CAGR | 5.9% |
시장은 경질 포장과 연포장으로 구분되며 경질포장은 2034년까지 1,229억 달러를 창출할 것으로 예측되고 있습니다. 수요가 계속 증가하는 가운데, 제조업체는 환경 의식이 높은 소비자에 대응하기 위해, 알루미늄이나 유리와 같은 지속 가능한 소재를 채용하고 있습니다. 이 동향은 특히 프리미엄 주스나 기능성 음료의 분야에서 현저하고, 각 브랜드는 패키지의 아름다움, 리사이클성, 제품의 차별화를 중시하고 있습니다.
2024년 비주류 포장 시장의 40.7%를 플라스틱 부문이 차지하고 합리적인 가격과 적응성으로 우위를 유지했습니다. 바이오플라스틱의 채용은 기세를 늘리고 있으며, 기업은 리필용이나 재이용 가능한 페트병에의 대처에 투자하고 있습니다.
북미는 2024년 비주류 포장 시장에서 27.1%의 점유율을 차지하며 주요 지역 기업로서의 지위를 강화했습니다. 대응하는 싱글서브나 온더고의 포맷에의 기호가 합쳐져 추진되고 있습니다.
목차
제1장 조사 방법과 조사 범위
제2장 주요 요약
제3장 업계 인사이트
- 생태계 분석
- 업계에 미치는 영향요인
- 성장 촉진요인
- 청량음료 매출 증가
- 이동 중에도 소비하는 습관으로의 전환
- 보다 건강한 음료에 대한 수요 증가
- 캔이 들어간 비주류의 보급
- 성인용 청량 음료의 인기 상승
- 업계의 잠재적 위험 및 과제
- 불안정한 원료 가격과 엄격한 환경 규제
- 플라스틱의 환경 영향
- 성장 촉진요인
- 성장 가능성 분석
- 규제 상황
- 기술 상황
- 향후 시장 동향
- 갭 분석
- Porter's Five Forces 분석
- PESTEL 분석
제4장 경쟁 구도
- 서론
- 기업 점유율 분석
- 주요 시장 기업의 경쟁 분석
- 경쟁 포지셔닝 매트릭스
- 전략 대시보드
제5장 시장 추계·예측 : 유형별(2021-2034년)
- 주요 동향
- 경질
- 연질
제6장 시장 추계·예측 : 재료별(2021-2034년)
- 주요 동향
- 플라스틱
- PET
- PP
- HDPE
- LDPE
- 기타
- 금속
- 유리
- 종이 및 판지
- 기타
제7장 시장 추계·예측 : 제품별(2021-2034년)
- 주요 동향
- 가방 및 파우치
- 병 및 자
- 캔
- 배럴 및 드럼
- 상자 및 판지
- 기타
제8장 시장 추계·예측 : 용도별(2021-2034년)
- 주요 동향
- 탄산음료
- 주스
- 즉석 차 및 커피
- 기능성 음료
- 유제품
- 기타
제9장 시장 추계·예측 : 지역별(2021-2034년)
- 주요 동향
- 북미
- 미국
- 캐나다
- 유럽
- 독일
- 영국
- 프랑스
- 스페인
- 이탈리아
- 네덜란드
- 아시아태평양
- 중국
- 인도
- 일본
- 호주
- 한국
- 라틴아메리카
- 브라질
- 멕시코
- 아르헨티나
- 중동 및 아프리카
- 사우디아라비아
- 남아프리카
- 아랍에미리트(UAE)
제10장 기업 프로파일
- Anchor Glass Container
- Airlite Plastics
- Ardagh Group
- Ball Corporation
- Can Corporation of America
- Can Pack Group
- CL Smith
- Crown Holdings
- Envases Group
- International Paper
- Mondi
- OI Glass
- Pactiv Evergreen
- Silgan Containers
- Smurfit Kappa
- Stora Enso
- Tetra Pak
- Verallia
- WestRock
The Global Non-Alcoholic Beverage Packaging Market reached USD 118.8 billion in 2024 and is projected to grow at a CAGR of 5.9% between 2025 and 2034. As consumer preferences shift toward healthier beverage choices, the demand for innovative and sustainable packaging solutions is on the rise. Brands are actively responding to the growing popularity of low-sugar drinks, real juice beverages, and functional drinks by adopting packaging that preserves freshness, ensures nutritional integrity, and meets stringent regulatory requirements. The trend toward eco-friendly materials and portion-controlled packaging formats further fuels the market, as companies aim to enhance convenience while minimizing environmental impact.

With health-conscious consumers driving the demand for functional beverages, brands are increasingly leveraging packaging as a strategic tool to enhance product appeal and sustainability. The rising popularity of energy drinks, flavored water, and low-calorie options has created a need for packaging that not only maintains product integrity but also aligns with evolving consumer expectations. Lightweight, recyclable materials, biodegradable options, and sustainable packaging innovations are rapidly gaining traction as beverage companies seek to balance convenience with environmental responsibility.
| Market Scope | |
|---|---|
| Start Year | 2024 |
| Forecast Year | 2025-2034 |
| Start Value | $118.8 Billion |
| Forecast Value | $211.6 Billion |
| CAGR | 5.9% |
The market is segmented into rigid and flexible packaging types, with rigid packaging projected to generate USD 122.9 billion by 2034. Rigid packaging remains a preferred choice due to its durability, superior product protection, and versatility, making it an ideal solution for premium and functional beverages. As demand for high-quality beverages continues to rise, manufacturers are embracing sustainable materials like aluminum and glass to cater to eco-conscious consumers. This trend is particularly evident in the premium juice and functional beverage segment, where brands emphasize packaging aesthetics, recyclability, and product differentiation.
The plastic segment accounted for 40.7% of the non-alcoholic beverage packaging market in 2024, maintaining its dominance due to affordability and adaptability. However, growing environmental concerns surrounding non-biodegradable plastic waste are prompting manufacturers to transition toward sustainable alternatives. The adoption of recycled PET (rPET) and bioplastics is gaining momentum, with companies investing in refillable and reusable plastic bottle initiatives. These efforts align with global sustainability targets while ensuring continued convenience for consumers who seek portable and on-the-go beverage options.
North America held a 27.1% share in the non-alcoholic beverage packaging market in 2024, reinforcing its position as a key regional player. The market expansion in this region is driven by strong consumer demand for sustainable packaging, coupled with a preference for single-serve and on-the-go formats that cater to fast-paced lifestyles. Continuous innovation in eco-friendly materials, smart packaging technologies, and functional beverage packaging solutions further strengthens North America's role in shaping global industry trends.
Table of Contents
Chapter 1 Methodology and Scope
- 1.1 Market scope and definitions
- 1.2 Research design
- 1.2.1 Research approach
- 1.2.2 Data collection methods
- 1.3 Base estimates and calculations
- 1.3.1 Base year calculation
- 1.3.2 Key trends for market estimation
- 1.4 Forecast model
- 1.5 Primary research and validation
- 1.5.1 Primary sources
- 1.5.2 Data mining sources
Chapter 2 Executive Summary
- 2.1 Industry 3600 synopsis
Chapter 3 Industry Insights
- 3.1 Industry ecosystem analysis
- 3.2 Industry impact forces
- 3.2.1 Growth drivers
- 3.2.1.1 Increasing sales of soft drinks
- 3.2.1.2 Shift towards on-the-go consumption habits
- 3.2.1.3 Rising demand for healthier beverages
- 3.2.1.4 Proliferation of non-alcoholic beverages in cans
- 3.2.1.5 Rising popularity of adult soft drinks
- 3.2.2 Industry pitfalls and challenges
- 3.2.2.1 Volatile raw material prices and stringent environmental regulations
- 3.2.2.2 Environmental effects of plastic
- 3.2.1 Growth drivers
- 3.3 Growth potential analysis
- 3.4 Regulatory landscape
- 3.5 Technology landscape
- 3.6 Future market trends
- 3.7 Gap analysis
- 3.8 Porter's analysis
- 3.9 PESTEL analysis
Chapter 4 Competitive Landscape, 2024
- 4.1 Introduction
- 4.2 Company market share analysis
- 4.3 Competitive analysis of major market players
- 4.4 Competitive positioning matrix
- 4.5 Strategy dashboard
Chapter 5 Market Estimates and Forecast, By Type, 2021 - 2034 (USD Bn & Kilo Tons)
- 5.1 Key trends
- 5.2 Rigid
- 5.3 Flexible
Chapter 6 Market Estimates and Forecast, By Material, 2021 - 2034 (USD Bn & Kilo Tons)
- 6.1 Key trends
- 6.2 Plastic
- 6.2.1 PET
- 6.2.2 PP
- 6.2.3 HDPE
- 6.2.4 LDPE
- 6.2.5 Others
- 6.3 Metal
- 6.4 Glass
- 6.5 Paper & paperboard
- 6.6 Others
Chapter 7 Market Estimates and Forecast, By Product, 2021 - 2034 (USD Bn & Kilo Tons)
- 7.1 Key trends
- 7.2 Bags & pouch
- 7.3 Bottles & jars
- 7.4 Cans
- 7.5 Barrels & drums
- 7.6 Boxes & cartons
- 7.7 Others
Chapter 8 Market Estimates and Forecast, By Application, 2021 - 2034 (USD Bn & Kilo Tons)
- 8.1 Key trends
- 8.2 Carbonated soft drinks
- 8.3 Juices
- 8.4 Ready-to-drink tea & coffee
- 8.5 Functional drinks
- 8.6 Dairy products
- 8.7 Others
Chapter 9 Market Estimates and Forecast, By Region, 2021 - 2034 (USD Bn & Kilo Tons)
- 9.1 Key trends
- 9.2 North America
- 9.2.1 U.S.
- 9.2.2 Canada
- 9.3 Europe
- 9.3.1 Germany
- 9.3.2 UK
- 9.3.3 France
- 9.3.4 Spain
- 9.3.5 Italy
- 9.3.6 Netherlands
- 9.4 Asia Pacific
- 9.4.1 China
- 9.4.2 India
- 9.4.3 Japan
- 9.4.4 Australia
- 9.4.5 South Korea
- 9.5 Latin America
- 9.5.1 Brazil
- 9.5.2 Mexico
- 9.5.3 Argentina
- 9.6 Middle East and Africa
- 9.6.1 Saudi Arabia
- 9.6.2 South Africa
- 9.6.3 UAE
Chapter 10 Company Profiles
- 10.1 Anchor Glass Container
- 10.2 Airlite Plastics
- 10.3 Ardagh Group
- 10.4 Ball Corporation
- 10.5 Can Corporation of America
- 10.6 Can Pack Group
- 10.7 C.L. Smith
- 10.8 Crown Holdings
- 10.9 Envases Group
- 10.10 International Paper
- 10.11 Mondi
- 10.12 O-I Glass
- 10.13 Pactiv Evergreen
- 10.14 Silgan Containers
- 10.15 Smurfit Kappa
- 10.16 Stora Enso
- 10.17 Tetra Pak
- 10.18 Verallia
- 10.19 WestRock
