|
시장보고서
상품코드
1822612
부유식 발전소 시장 : 기회, 성장 촉진요인, 산업 동향 분석, 예측(2025-2034년)Floating Power Plants Market Opportunity, Growth Drivers, Industry Trend Analysis, and Forecast 2025 - 2034 |
||||||
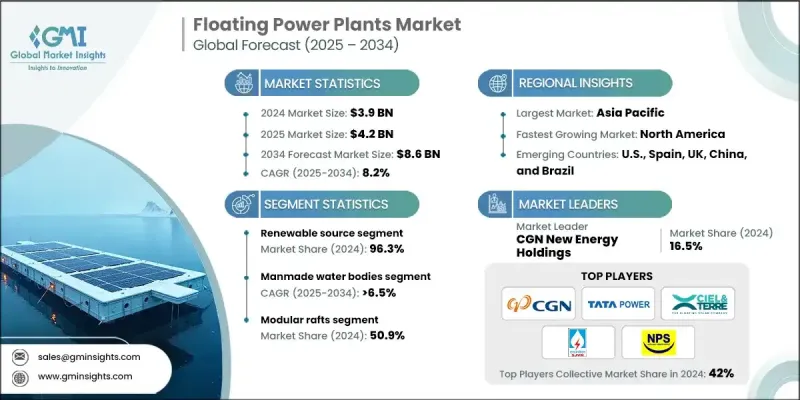
Global Market Insights, Inc.가 발행한 최신 보고서에 따르면 세계의 부유식 발전소 시장은 2024년에 39억 달러로 평가되었으며, 2025년 42억 달러에서 2034년까지 86억 달러로 성장하여 CAGR 8.2%로 확대될 것으로 예측되고 있습니다.

부유식 발전소(FPP)는 물이 풍부하지만 토지가 제한된 지역의 에너지 수요를 충족시키기 위한 신속하고 배포 가능하고 유연한 옵션으로 부상하고 있습니다. 이러한 발전소는 재생에너지원을 통합하고, 송전 손실을 줄이고, 대량의 토지를 필요로 하지 않고 부하 요건을 조정하는 능력을 제공합니다.
| 시장 범위 | |
|---|---|
| 시작 연도 | 2024년 |
| 예측 연도 | 2025-2034년 |
| 시장 매출 | 39억 달러 |
| 예측 금액 | 86억 달러 |
| CAGR | 8.2% |
주요 촉진요인
1. 신재생에너지 통합의 중요성 : 부유식 태양열/풍력 플랫폼의 출현으로 각국은 제한된 토지 자원을 빼앗지 않고 청정 에너지 목표를 달성할 수 있습니다.
2. 연안 및 섬 지역에서의 신속한 배치 필요성 : 송전망을 확장하지 않고 불리한 위치에 있는 연안 및 섬 지역에 탄력적인 에너지를 제공하는 FPP의 능력은 헤아릴 수 없습니다.
3. 토지 제한 및 수역 이용 문제 : 공공 부문은 깨끗한 전력을 생산하기 위해 인공 호수와 저수지를 이용하는 것을 추진하고 있습니다.
4. 모듈식 및 하이브리드 기술의 발전 : 태양광, 풍력 및 저장을 활용하는 하이브리드 플로팅 발전 플랫폼의 발전은 유틸리티 규모의 자연 에너지 도입에 변화를 가져오고 있습니다.
주요 기업
- 부유식 발전소 시장의 주요 기업은 CGN New Energy Holdings, Tata Power, Ciel & Terre, SJVN Green Energy, National Power Supply Public Company의 5개사로 2024년 시장의 약 42%를 차지하고 있습니다.
- 2025 회계연도 3분기 Siemens Energy는 수익이 비교 기준으로 13.5% 증가하여 113억 달러로 3분기 실적이 호조를 보였다고 발표했습니다.
- 2025년 상반기 GE Vernova는 171억 달러의 매출을 기록했습니다.
- 2025년 3분기 Kawasaki Heavy Industries는 33억 달러의 매출을 기록했습니다.
주요 과제 :
- 높은 도입 자본 비용 :
- 환경 및 규제 요건 : 여기에는 입지와 관련된 허가 및 수리권, 특히 영향을 받기 쉬운 해양 서식지에서의 배치에 영향을 미칠 수 있는 환경 문제가 포함됩니다.
- 모든 유형의 비정상적인 기상에서 유지 보수 및 계류 : 해양 부체 구조물은 염수로 인한 부식과 바람과 파도 조건에 항상 노출되는 것을 고려해야합니다.
1. 전원별 - 재생에너지
2024년 시장 점유율은 재생가능 에너지(특히 태양광과 풍력)가 독점했습니다. 엄격함을 늘리는 환경규제와 탈탄소화 목표가 전력회사를 하이브리드나 태양강 주도의 부유식 발전기술로 밀어 올리고 있습니다.
2. 용도별 - 인공수역이 최전선
간단한 허가와 안정된 수위를 위해 저수지, 연못, 인공 호수, 운하 등의 인공 수역이 가장 눈에 띄는 설치 장소입니다. 이러한 장소는 조수와 풍파의 영향을 최소화하고 장기적인 FPP의 실행 가능성을 유지할 수 있습니다.
3. 전개별 - 모듈러 래프트가 기동성을 제공
모듈형 래프트 시스템은 2024년 시장에서 가장 우세한 시스템이었습니다. 이 시스템은 표준화된 제조 공정을 가진 유닛으로의 이동과 동원을 제공하며, 이러한 유닛은 그리드 상황뿐만 아니라 농촌 전기화 프로젝트를 위한 유틸리티 스케일 모두에서 가치가 있습니다. 이 접근법의 검증은 유지 보수 감소 및 업그레이드까지의 시간 단축으로도 달성됩니다.
청정 에너지에 대한 열망으로 북미는 급성장 시장으로 인식되고 있습니다. 육상 및 해상 풍력(미국 동해안), 저수지 기반의 부유식 태양광(캘리포니아, 텍사스 주) 및 기타 분야가 이 지역의 부유식 발전 용량을 견인하고 있습니다.
부유식 발전소 시장의 주요 벤더는 BW Ideol, CGN New Energy Holdings, CHN Energy, Ciel & Terre, Electric Generation Authority, Terre, Electricity Generating Authority of Thailand, Equinor, Floating Power Plant, GE Vernova, HEXKawane Industries, MAN Energy Solutions, Mitsubishi Heavy Industries, National Power Supply Public Company, Orsted, RWE, Siemens Energy, SJVN Green Energy, Sterling & Wilson Renewable Energy, Swimsol, Tata Power, Vestas, Wartsila 등이 있습니다.
경쟁력을 강화하기 위해 선도적인 회사는 하이브리드 시스템, 세계 파트너십 및 확장 가능한 모듈 설계에 중점을 둡니다. BW Ideol과 Equinor는 유럽과 북미에서 부유식 해상 풍력 발전 용량을 늘리고 있습니다. Karadeniz Holding은 신흥국에서의 긴급 전력 공급을 위해 현재도 'Power Ships'을 파견하고 있습니다. GE Vernova와 Siemens Energy는 부유식 자연 에너지를 가스 터빈 및 축전지와 통합하는 데 중점을 둡니다. Vestas와 Mitsubishi Heavy Industries와 같은 협업은 풍력 터빈을 통합한 플로팅 플랫폼을 추진하고 있습니다. 각 회사는 또한 지역 규정 및 기후 요구 사항을 충족하도록 설계된 지역에 맞는 배치로 인공 수역 분야에 진입합니다.
목차
제1장 조사 방법과 범위
제2장 주요 요약
제3장 업계 인사이트
- 업계 생태계 분석
- 원재료 가용성 및 조달 분석
- 제조 능력 평가
- 공급망의 탄력성과 위험요인
- 배전망 해석
- 규제 상황
- 업계에 미치는 영향요인
- 성장 촉진요인
- 업계의 잠재적 리스크 및 과제
- 성장 가능성 분석
- Porter's Five Forces 분석
- PESTEL 분석
- 부유식 발전소의 비용 구조 분석
- 가격 동향 분석
- 지역별
- 용량별
- 새로운 기회와 동향
- 디지털화와 IoT의 통합
- 신흥 시장에 침투
- 투자분석과 전망
제4장 경쟁 구도
- 소개
- 기업의 시장 점유율 분석 : 지역별
- 북미
- 유럽
- 아시아태평양
- 중동 및 아프리카
- 라틴아메리카
- 전략적 대시보드
- 전략적 노력
- 주요 파트너십 및 협업
- 주요 M&A 활동
- 제품의 혁신과 발매
- 시장 확대 전략
- 경쟁 벤치마킹
- 혁신과 기술의 상황
제5장 시장 규모와 예측 : 전원별, 2021-2034년
- 주요 동향
- 재생 가능
- 태양광
- 풍력
- 재생 불가능
- 가스터빈
- IC 엔진
제6장 시장 규모와 예측 : 용량별, 2021-2034년
- 주요 동향
- 1-5MW 이상
- 5-20MW 이상
- 20-100MW 이상
- 100MW 이상
제7장 시장 규모와 예측 : 전개별, 2021-2034년
- 주요 동향
- 선박
- 바지선
- 모듈러 래프트
- 기타
제8장 시장 규모와 예측 : 용도별, 2021-2034년
- 주요 동향
- 인공수역
- 천연수역
제9장 시장 규모와 예측 : 지역별, 2021-2034년
- 주요 동향
- 북미
- 미국
- 캐나다
- 멕시코
- 유럽
- 영국
- 독일
- 프랑스
- 스페인
- 아시아태평양
- 중국
- 인도
- 일본
- 호주
- 중동 및 아프리카
- 아랍에미리트(UAE)
- 사우디아라비아
- 라틴아메리카
- 브라질
- 아르헨티나
제10장 기업 프로파일
- BW Ideol
- CGN New Energy Holdings
- CHN Energy
- Ciel & Terre
- Electricity Generating Authority of Thailand
- Equinor
- Floating Power Plant
- GE Vernova
- HEXA Renewables
- Karadeniz Holding
- Kawasaki Heavy Industries
- MAN Energy Solutions
- Mitsubishi Heavy Industries
- National Power Supply Public Company
- Orsted
- RWE
- Siemens Energy
- SJVN Green Energy
- Sterling & Wilson Renewable Energy
- Swimsol
- Tata Power
- Vestas
- Wartsila
The global floating power plants market was valued at USD 3.9 billion in 2024 and is projected to grow from USD 4.2 billion in 2025 to USD 8.6 billion by 2034, expanding at a CAGR of 8.2%, according to the latest report published by Global Market Insights, Inc.
Floating power plants (FPPs) are on the rise as fast, deployable, flexible options to meet energy needs in regions with an abundance of water but a limited amount of land. These plants provide the ability to integrate renewable sources, lower transmission losses, and modulate load requirements without the need for large amounts of land.
| Market Scope | |
|---|---|
| Start Year | 2024 |
| Forecast Year | 2025-2034 |
| Start Value | $3.9 Billion |
| Forecast Value | $8.6 Billion |
| CAGR | 8.2% |
Key Drivers:
1. Emphasis on renewable energy integration: The emergence of floating solar/wind platforms allows countries to achieve clean energy goals without competing for limited land resources.
2. Need for fast deployment in offshore and island areas: The ability for FPPs to provide resilient energy to disadvantaged coastal and island communities without grid extension is immeasurable.
3. Land limitations and waterbody utilization issue: The public sector is pushing to use manmade lakes and reservoirs to produce clean power.
4. Modular and hybrid technology advancements: The advancement of hybrid floating producing platforms, which use solar, wind, and storage, is transforming the implementation of utility-scale renewables.
Key Players:
- The 5 leading players in the floating power plants market are CGN New Energy Holdings, Tata Power, Ciel & Terre, SJVN Green Energy, and National Power Supply Public Company, accounting for approximately 42% of the 2024 market.
- In quarter 3 FY 2025, Siemens Energy announced strong financial performance in the third quarter with revenue increasing by 13.5% on a comparable basis to USD 11.3 billion.
- In the first half of 2025, GE Vernova reported revenue of USD 17.1 billion.
- In Q3, 2025, Kawasaki Heavy Industries garnered revenue of USD 3.3 billion.
Key Challenges:
- High capital costs of deployment: The benefits of modularity have lessened costs, but the costs for the mooring and installation systems are still high for the first time.
- Environmental and regulatory requirements: This includes permitting and water rights related to site and environmental issues that may affect deployment, especially in sensitive marine habitats.
- Maintenance and mooring in all types of extreme weather: Offshore floating structures need to factor in saltwater corrosion and exposure to wind and wave conditions at all times.
1. By Power Source - Renewable Leading
Renewable floating power plants (especially solar and wind) dominated the market share in 2024. Increasingly rigorous environmental regulations and decarbonization goals are pushing utilities towards hybrid and solar-led floating generation technologies.
2. By Application - Manmade Water Bodies are at the Forefront
Due to simple permitting and consistent, steady water levels, manmade water bodies such as reservoirs, ponds, artificial lakes, and canals were the most prominent deployment locations. These job sites minimize potential complications around tides and wind wave action, preserving long-term FPP viability.
3. By Deployment - Modular Rafts Provide Mobilization
Modular raft systems were the most dominant system in the market in 2024. They offer mobilization and mobilization to units with standardization manufacturing, making these units valuable at both utility scale for grid situations as well as for rural electrification projects. Validation in this approach is also realized with lower maintenance and shorter times to upgrade.
With aspirational ambitions for clean energy, North America is being identified as a rapidly growing market. Onshore and offshore wind (U.S. East Coast), reservoir-based floating solar (California, Texas), and other segments are driving the floating power capacity of the region.
Key vendors in the floating power plants market are BW Ideol, CGN New Energy Holdings, CHN Energy, Ciel & Terre, Electricity Generating Authority of Thailand, Equinor, Floating Power Plant, GE Vernova, HEXA Renewables, Karadeniz Holding, Kawasaki Heavy Industries, MAN Energy Solutions, Mitsubishi Heavy Industries, National Power Supply Public Company, Orsted, RWE, Siemens Energy, SJVN Green Energy, Sterling & Wilson Renewable Energy, Swimsol, Tata Power, Vestas, and Wartsila.
To promote competitiveness, leading players are emphasizing hybrid systems, global partnerships, and scalable modular designs. BW Ideol and Equinor are increasing floating offshore wind capacity across Europe and North America. Karadeniz Holding is still sending its "Power Ships" out for emergency power supply in emerging markets. GE Vernova and Siemens Energy are emphasizing integrating floating renewables with gas turbines and battery storage. Collaborations like the one between Vestas and Mitsubishi Heavy Industries are driving wind-turbine-integrated floating platforms. Firms are also entering the manmade water bodies space with locally adapted deployments designed to meet regional regulatory and climatic requirements.
Table of Contents
Chapter 1 Methodology & Scope
- 1.1 Research design
- 1.1.1 Research approach
- 1.1.2 Data collection methods
- 1.1.3 Base estimates and calculations
- 1.1.4 Base year calculation
- 1.1.5 Key trends for market estimates
- 1.2 Forecast model
- 1.3 Primary research and validation
- 1.4 Some of the primary sources (but not limited to)
- 1.5 Data mining sources
- 1.5.1 Secondary
- 1.5.1.1 Paid sources
- 1.5.1.2 Public sources
- 1.5.1.3 Sources, by region
- 1.5.1 Secondary
- 1.6 Market definitions
Chapter 2 Executive Summary
- 2.1 Industry 360° synopsis, 2021 - 2034
- 2.2 Business trends
- 2.3 Power source trends
- 2.4 Capacity trends
- 2.5 Deployment trends
- 2.6 Application trends
- 2.7 Regional trends
Chapter 3 Industry Insights
- 3.1 Industry ecosystem analysis
- 3.1.1 Raw material availability & sourcing analysis
- 3.1.2 Manufacturing capacity assessment
- 3.1.3 Supply chain resilience & risk factors
- 3.1.4 Distribution network analysis
- 3.2 Regulatory landscape
- 3.3 Industry impact forces
- 3.3.1 Growth drivers
- 3.3.2 Industry pitfalls & challenges
- 3.4 Growth potential analysis
- 3.5 Porter's analysis
- 3.5.1 Bargaining power of suppliers
- 3.5.2 Bargaining power of buyers
- 3.5.3 Threat of new entrants
- 3.5.4 Threat of substitutes
- 3.6 PESTEL analysis
- 3.6.1 Political factors
- 3.6.2 Economic factors
- 3.6.3 Social factors
- 3.6.4 Technological factors
- 3.6.5 Legal factors
- 3.6.6 Environmental factors
- 3.7 Cost structure analysis of floating power plants
- 3.8 Price trend analysis
- 3.8.1 By region
- 3.8.2 By capacity
- 3.9 Emerging opportunities & trends
- 3.9.1 Digitalization and IoT integration
- 3.9.2 Emerging market penetration
- 3.10 Investment analysis & future outlook
Chapter 4 Competitive Landscape, 2025
- 4.1 Introduction
- 4.2 Company market share analysis, by region, 2024
- 4.2.1 North America
- 4.2.2 Europe
- 4.2.3 Asia Pacific
- 4.2.4 Middle East & Africa
- 4.2.5 Latin America
- 4.3 Strategic dashboard
- 4.4 Strategic initiatives
- 4.4.1 Key partnerships & collaborations
- 4.4.2 Major M&A activities
- 4.4.3 Product innovations & launches
- 4.4.4 Market expansion strategies
- 4.5 Competitive benchmarking
- 4.6 Innovation & technology landscape
Chapter 5 Market Size and Forecast, By Power Source, 2021 - 2034 (USD Million & MW)
- 5.1 Key trends
- 5.2 Renewable
- 5.2.1 Solar
- 5.2.2 Wind
- 5.3 Non-renewable
- 5.3.1 Gas turbine
- 5.3.2 IC engines
Chapter 6 Market Size and Forecast, By Capacity, 2021 - 2034 (USD Million & MW)
- 6.1 Key trends
- 6.2 > 1 - 5 MW
- 6.3 > 5 - 20 MW
- 6.4 > 20 - 100 MW
- 6.5 > 100 MW
Chapter 7 Market Size and Forecast, By Deployment, 2021 - 2034 (USD Million & MW)
- 7.1 Key trends
- 7.2 Ships
- 7.3 Barges
- 7.4 Modular rafts
- 7.5 Others
Chapter 8 Market Size and Forecast, By Application, 2021 - 2034 (USD Million & MW)
- 8.1 Key trends
- 8.2 Manmade water bodies
- 8.3 Natural water bodies
Chapter 9 Market Size and Forecast, By Region, 2021 - 2034 (USD Million & MW)
- 9.1 Key trends
- 9.2 North America
- 9.2.1 U.S.
- 9.2.2 Canada
- 9.2.3 Mexico
- 9.3 Europe
- 9.3.1 UK
- 9.3.2 Germany
- 9.3.3 France
- 9.3.4 Spain
- 9.4 Asia Pacific
- 9.4.1 China
- 9.4.2 India
- 9.4.3 Japan
- 9.4.4 Australia
- 9.5 Middle East & Africa
- 9.5.1 UAE
- 9.5.2 Saudi Arabia
- 9.6 Latin America
- 9.6.1 Brazil
- 9.6.2 Argentina
Chapter 10 Company Profiles
- 10.1 BW Ideol
- 10.2 CGN New Energy Holdings
- 10.3 CHN Energy
- 10.4 Ciel & Terre
- 10.5 Electricity Generating Authority of Thailand
- 10.6 Equinor
- 10.7 Floating Power Plant
- 10.8 GE Vernova
- 10.9 HEXA Renewables
- 10.10 Karadeniz Holding
- 10.11 Kawasaki Heavy Industries
- 10.12 MAN Energy Solutions
- 10.13 Mitsubishi Heavy Industries
- 10.14 National Power Supply Public Company
- 10.15 Ørsted
- 10.16 RWE
- 10.17 Siemens Energy
- 10.18 SJVN Green Energy
- 10.19 Sterling & Wilson Renewable Energy
- 10.20 Swimsol
- 10.21 Tata Power
- 10.22 Vestas
- 10.23 Wartsila