
|
시장보고서
상품코드
1740951
폴리에틸렌 푸라노에이트(PEF) 시장 기회, 성장 촉진요인, 산업 동향 분석, 예측(2025-2034년)PEF (Polyethylene Furanoate) Market Opportunity, Growth Drivers, Industry Trend Analysis, and Forecast 2025 - 2034 |
||||||
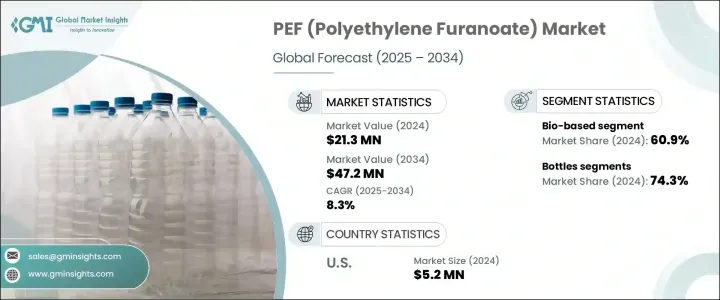
세계의 폴리에틸렌 푸라노에이트(PEF) 시장은 2024년에 2,130만 달러로 평가되었고, CAGR 8.3%를 나타내, 2034년에는 4,720만 달러에 이를 것으로 추정됩니다.
PEF는 주로 식물 유래의 당류를 원료로 하는 재생가능한 원료로부터 얻은 차세대 바이오 폴리에스테르입니다. 폴리에틸렌 테레프탈레이트(PET)와 같은 전통적인 석유 기반 플라스틱을 대체하는 친환경적인 대안으로, PEF는 지속가능성에 대한 소비자와 규제 변화 증가로 큰 지지를 얻고 있습니다. 시장 성장의 주요 요인은 환경 친화적 인 포장 솔루션에 대한 수요가 증가하고 플라스틱 폐기물을 줄이기위한 규제 강화, PET와 같은 기존 플라스틱보다 우수한 이점을 제공하는 PEF 고유의 재료 특성입니다.

지속 가능한 포장에 대한 세계의 밀어남 증가는 폴리에틸렌 푸라노에이트(PEF) 시장의 확대를 촉진하는 중요한 요인 중 하나입니다. 이산화탄소 배출량을 삭감할 뿐만 아니라, PEF는 생분해성이기 때문에 폐기물의 축적을 줄이는 것에도 공헌합니다. 또한 PET에 비해 산소, 이산화탄소, 수증기에 대한 내성이 높은 등, 배리어성이 뛰어나기 때문에 제품의 품질과 유통 기한이 중요한 식품 및 음료 포장 등의 분야에서 특히 편리하다.
| 시장 범위 | |
|---|---|
| 시작 연도 | 2024년 |
| 예측 연도 | 2025-2034년 |
| 시작 금액 | 2,130만 달러 |
| 예측 금액 | 4,720만 달러 |
| CAGR | 8.3% |
PEF 수요가 계속 증가함에 따라 시장은 세계의 기업으로부터의 관심을 높이고 있습니다. 또한, 환경의 지속가능성을 둘러싼 소비자의 의식의 고조가, 음료 제조업체에 이러한 보다 친환경 소재의 채용을 촉구하고 있습니다.
또한 세계의 폴리에틸렌 푸라노에이트(PEF) 시장은 바이오과 식물 기반의 두 유형로 크게 나뉘어져 있습니다. 오베이스의 제조방법에서는 제조업체는 농업제품별, 공업잔사, 당분을 많이 포함한 바이오매스 등 폭넓은 원료를 사용할 수 있습니다.
미국은 폴리에틸렌 푸라노에이트(PEF) 시장에서 중요한 선수이며, 2024년에는 520만 달러를 창출했습니다. 이러한 이니셔티브는 환경 부하의 저감에 도움이 될 뿐만 아니라, 포장, 섬유, 필름 등 다양한 용도로 PEF의 기회를 넓히고 있습니다.
이 급성장 시장에 자본 참여를 위해 PEF 분야의 주요 기업은 생산 능력 확대, 다른 업계 리더와의 전략적 파트너십 형성, PEF 생산 방법 개선 및 재료 특성 향상을 위한 연구 개발에 많은 투자를 포함한 다양한 전략을 채택하고 있습니다. BASF SE, Avantium, Amcor, Alpla Group, and Toyobo 등의 기업은 이 기술 혁신의 최전선에 서서 친환경 포장 시장 주요 기업로서의 지위를 확립하고 있습니다.
목차
제1장 조사 방법과 범위
제2장 주요 요약
제3장 업계 인사이트
- 생태계 분석
- 주요 제조업체
- 리셀러
- 업계 전체의 이익률
- 공급의 혼란
- 트럼프 정권에 의한 관세에 대한 영향
- 무역에 미치는 영향
- 무역량의 혼란
- 보복 조치
- 업계에 미치는 영향
- 공급측의 영향(원재료)
- 주요 원재료의 가격 변동
- 공급망 재구성
- 생산 비용에 미치는 영향
- 수요측의 영향(판매가격)
- 최종 시장에의 가격 전달
- 시장 점유율 동향
- 소비자의 반응 패턴
- 공급측의 영향(원재료)
- 영향을 받는 주요 기업
- 전략적 업계 대응
- 공급망 재구성
- 가격 설정 및 제품 전략
- 정책관여
- 전망과 향후 검토 사항
- 무역에 미치는 영향
- 무역 통계(HS코드)
- 주요 수출국
- 주요 수입국
- 이익률 분석
- 주요 뉴스와 대처
- 규제 상황
- 영향요인
- 성장 촉진요인
- 지속 가능한 바이오 포장재에 대한 세계 수요 증가
- 플라스틱 폐기물과 탄소 배출량의 삭감을 위한 규제 압력 증가
- PEF는 PET에 비해 배리어성이나 기계적 강도가 뛰어난 등, 뛰어난 성능 특성
- 업계의 잠재적 위험 및 과제
- 프럭토오스 유래 2,5-플란디카르복실산(FDCA) 등의 원료의 이용가능성에의 의존
- PLA 및 바이오 PET와 같은 다른 바이오베이스 폴리머와의 경쟁
- 성장 촉진요인
- 성장 가능성 분석
- Porter's Five Forces 분석
- PESTEL 분석
제4장 경쟁 구도
- 서론
- 기업의 시장 점유율 분석
- 경쟁 포지셔닝 매트릭스
- 전략적 전망 매트릭스
제5장 시장 추정·예측 : 유래별(2021-2034년)
- 주요 동향
- 식물 유래
- 바이오베이스
제6장 시장 추정·예측 : 용도별(2021-2034년)
- 주요 동향
- 병
- 섬유
- 필름
- 기타
제7장 시장 추정·예측 : 최종 이용 산업별(2021-2034년)
- 주요 동향
- 포장
- 섬유
- 일렉트로닉스
- 의약품
- 기타
제8장 시장 추정·예측 : 지역별(2021-2034년)
- 주요 동향
- 북미
- 미국
- 캐나다
- 유럽
- 독일
- 영국
- 프랑스
- 스페인
- 이탈리아
- 네덜란드
- 아시아태평양
- 중국
- 인도
- 일본
- 호주
- 한국
- 라틴아메리카
- 브라질
- 멕시코
- 아르헨티나
- 중동 및 아프리카
- 사우디아라비아
- 남아프리카
- 아랍에미리트(UAE)
제9장 기업 프로파일
- Alpla Group
- Amcor
- AVA Biochem
- Avantium
- BASF SE
- Origin Materials
- Sulzer
- Swicofil
- Toyobo
The Global PEF (Polyethylene Furanoate) Market was valued at USD 21.3 million in 2024 and is estimated to grow at a CAGR of 8.3% to reach USD 47.2 million by 2034. PEF is a next-generation, bio-based polyester derived from renewable feedstocks, primarily derived from plant-based sugars. As an eco-friendly alternative to traditional petroleum-based plastics, such as polyethylene terephthalate (PET), PEF has been gaining significant traction due to the increasing consumer and regulatory shift toward sustainability. The market growth is largely fueled by the rising demand for environmentally friendly packaging solutions, stricter regulations aimed at reducing plastic waste, and the inherent material properties of PEF, which offer superior advantages over conventional plastics like PET.
The growing global push toward sustainable packaging is one of the key factors driving the expansion of the PEF market. Consumers, companies, and governments alike are increasingly focused on reducing the environmental footprint of packaging, and PEF, derived from renewable plant sources, offers a promising solution. This polyester not only reduces the carbon footprint compared to traditional plastics but also contributes to less waste accumulation, as PEF is biodegradable. Moreover, its superior barrier properties, which include better resistance to oxygen, carbon dioxide, and water vapor compared to PET, make it particularly valuable in sectors such as food and beverage packaging, where product quality and shelf life are crucial.
| Market Scope | |
|---|---|
| Start Year | 2024 |
| Forecast Year | 2025-2034 |
| Start Value | $21.3 Million |
| Forecast Value | $47.2 Million |
| CAGR | 8.3% |
As demand for PEF continues to rise, the market is seeing increased interest from companies across the globe. PEF bottles, in particular, have captured the largest share of the market, accounting for 74.3% of the overall PEF usage. This is due to PEF's advanced barrier capabilities, which preserve the freshness of beverages for longer periods. In the beverage industry, where product longevity is vital, the shift from traditional plastics to bio-based alternatives is not just a trend but a necessity. Furthermore, the growing consumer awareness surrounding environmental sustainability is pushing beverage manufacturers to adopt these more eco-friendly materials. With governments enforcing stricter regulations on plastic waste and carbon emissions, major corporations in the beverage industry are making the switch to bio-based plastics like PEF.
The global PEF market is also divided into two primary categories: bio-based and plant-based sources. The bio-based segment is dominant, holding a 60.9% share in 2024, thanks to the versatility of bio-based feedstocks. Unlike plant-based sources, which often rely on specific crops, bio-based production methods allow manufacturers to use a wide range of raw materials, such as agricultural byproducts, industrial residues, and sugar-rich biomass. This flexibility not only secures supply chains but also strengthens the scalability and resilience of PEF production, ensuring its continued growth as demand increases.
The United States is a significant player in the PEF market, generating USD 5.2 million in 2024. A major driver of this growth has been government initiatives that support the adoption of bio-based materials. Programs designed to promote the use of renewable plastics, particularly through federal procurement mandates, have created a favorable landscape for PEF. These initiatives not only help reduce the environmental impact but also open up opportunities for PEF across diverse applications, including packaging, textiles, and films. By fostering an environment conducive to the growth of sustainable plastics, the U.S. is establishing itself as a leader in the global shift toward eco-friendly materials.
To capitalize on this rapidly growing market, key players in the PEF sector are employing a range of strategies, including expanding their production capacities, forming strategic partnerships with other industry leaders, and investing heavily in research and development to improve PEF production methods and enhance its material properties. Companies such as BASF SE, Avantium, Amcor, Alpla Group, and Toyobo are at the forefront of this innovation, positioning themselves as key players in the eco-friendly packaging market. By embracing sustainable solutions and leveraging government incentives, these companies aim to stay ahead of the curve in the fast-evolving packaging industry.
Table of Contents
Chapter 1 Methodology & Scope
- 1.1 Market scope & definition
- 1.2 Base estimates & calculations
- 1.3 Forecast calculation
- 1.4 Data sources
- 1.4.1 Primary
- 1.4.2 Secondary
- 1.4.2.1 Paid sources
- 1.4.2.2 Public sources
- 1.5 Primary research and validation
- 1.5.1 Primary sources
- 1.5.2 Data mining sources
Chapter 2 Executive Summary
- 2.1 Industry synopsis, 2021-2034
Chapter 3 Industry Insights
- 3.1 Industry ecosystem analysis
- 3.1.1 Key manufacturers
- 3.1.2 Distributors
- 3.1.3 Profit margins across the industry
- 3.1.4 Supply disruptions
- 3.2 Trump administration tariffs
- 3.2.1 Impact on trade
- 3.2.1.1 Trade volume disruptions
- 3.2.1.2 Retaliatory measures
- 3.2.2 Impact on the industry
- 3.2.2.1 Supply-side impact (raw materials)
- 3.2.2.1.1 Price volatility in key materials
- 3.2.2.1.2 Supply chain restructuring
- 3.2.2.1.3 Production cost implications
- 3.2.2.2 Demand-side impact (selling price)
- 3.2.2.2.1 Price transmission to end markets
- 3.2.2.2.2 Market share dynamics
- 3.2.2.2.3 Consumer response patterns
- 3.2.2.1 Supply-side impact (raw materials)
- 3.2.3 Key companies impacted
- 3.2.4 Strategic Industry Responses
- 3.2.4.1 Supply Chain Reconfiguration
- 3.2.4.2 Pricing and Product Strategies
- 3.2.4.3 Policy Engagement
- 3.2.5 Outlook and Future Considerations
- 3.2.1 Impact on trade
- 3.3 Trade statistics (HS Code)
- 3.3.1 Major Exporting Countries
- 3.3.2 Major Importing Countries
- 3.4 Profit margin analysis
- 3.5 Key news & initiatives
- 3.6 Regulatory landscape
- 3.7 Impact forces
- 3.7.1 Growth drivers
- 3.7.1.1 Rising global demand for sustainable and bio-based packaging materials
- 3.7.1.2 Increasing regulatory pressure to reduce plastic waste and carbon emissions
- 3.7.1.3 High performance properties of PEF compared to PET, such as better barrier resistance and mechanical strength
- 3.7.2 Industry pitfalls & challenges
- 3.7.2.1 Dependency on feedstock availability such as fructose-derived 2,5-Furandicarboxylic acid (FDCA)
- 3.7.2.2 Competition from other bio-based polymers such as PLA and bio-PET
- 3.7.1 Growth drivers
- 3.8 Growth potential analysis
- 3.9 Porter's analysis
- 3.10 PESTEL analysis
Chapter 4 Competitive Landscape, 2024
- 4.1 Introduction
- 4.2 Company market share analysis
- 4.3 Competitive positioning matrix
- 4.4 Strategic outlook matrix
Chapter 5 Market Estimates and Forecast, By Source, 2021-2034 (USD Million) (Kilo Tons)
- 5.1 Key trends
- 5.2 Plant based
- 5.3 Bio-based
Chapter 6 Market Estimates and Forecast, By Application, 2021-2034 (USD Million) (Kilo Tons)
- 6.1 Key trends
- 6.2 Bottles
- 6.3 Fibres
- 6.4 Film
- 6.5 Others
Chapter 7 Market Estimates and Forecast, By End Use Industry, 2021-2034 (USD Million) (Kilo Tons)
- 7.1 Key trends
- 7.2 Packaging
- 7.3 Textiles
- 7.4 Electronics
- 7.5 Pharmaceuticals
- 7.6 Others
Chapter 8 Market Estimates and Forecast, By Region, 2021-2034 (USD Million) (Kilo Tons)
- 8.1 Key trends
- 8.2 North America
- 8.2.1 U.S.
- 8.2.2 Canada
- 8.3 Europe
- 8.3.1 Germany
- 8.3.2 UK
- 8.3.3 France
- 8.3.4 Spain
- 8.3.5 Italy
- 8.3.6 Netherlands
- 8.4 Asia Pacific
- 8.4.1 China
- 8.4.2 India
- 8.4.3 Japan
- 8.4.4 Australia
- 8.4.5 South Korea
- 8.5 Latin America
- 8.5.1 Brazil
- 8.5.2 Mexico
- 8.5.3 Argentina
- 8.6 Middle East and Africa
- 8.6.1 Saudi Arabia
- 8.6.2 South Africa
- 8.6.3 UAE
Chapter 9 Company Profiles
- 9.1 Alpla Group
- 9.2 Amcor
- 9.3 AVA Biochem
- 9.4 Avantium
- 9.5 BASF SE
- 9.6 Origin Materials
- 9.7 Sulzer
- 9.8 Swicofil
- 9.9 Toyobo

